Tuesday, March 31, 2020

A Marginal New High, then a Zigzag Lower

Last night the futures made another marginal new high - which you can see on the hourly chart of the ES futures, below, in the position labeled (iii). Then, they fell off and made three-waves down - another a-b-c, this time lower. That is shown as the position labeled as (iv). Yesterday's chart showed the three waves down or a-b-c for wave (ii), and the beginning of the three-waves up for wave (iii).

ES Futures - Hourly - Marginal New High and Zigzag Lower

Last night's higher high occurred on a marked divergence with the Elliott Wave Oscillator. Then, on what appears to be wave (iv), the EWO went below the zero line. The EMA-34 crosses through each numbered wave for form and proportion.

Today was the end of the month and the end of the quarter. This is usually noted for both the usual "window-dressing" of stocks, but also for the usual quarterly re-balancing of some blended portfolios (i.e. 30%-bonds, 70% stocks).

Tomorrow is the first day of the new month. There might be some of the usual quarterly inflows from pension funds, 401k's, company bonus plans, etc. If another marginal new high is made on these inflows, and then prices fall off rapidly, it might be possible to conclude this is an ending diagonal for the minute ((c)) wave of Minor 4. 

Today in the comments (and shown again at this LINK), we showed another such diagonal on as small a time scale as the 1-minute scale. We said, "so far, nothing impulsive upwards yet at all". Notice the fifth wave failure in this tiny diagonal, and the pre-terminal triangle that signaled the end of the wave. Here, at this second LINK2, is how the count turned out. Note the impulse character of the wave with a very, very long fourth wave - as far as time goes. This whole impulse lower was the ((C)) wave of wave (iv) shown on the chart.

We suppose something like this might be occurring with the Minor 4th wave, but it remains to be proven.

So, have a very good start to your evening, and the new month.
TraderJoe

Monday, March 30, 2020

Chop in Both Directions - Not Glued to any Count

On an intraday basis, the chart of the ES Futures shows a high level of chop in both directions. The only solid impulse wave is the downward wave - labeled ((C)) - that continued this morning in the overnight session.


ES Futures - 15 Minutes - Choppy

Readers will also note there is divergence on today's slightly higher wave with the EWO. It should just be noted. It is not definitive.

The only way I can currently count the sequence, without degree violations is a-b-c down, and a-b-c, up. That could change if a convincing downward fourth wave can be made without overlapping the second ((A)) wave shown, the one on the right, at the Critical Overlap level.

Could the current sequence - as it is shown - start a diagonal downward? It could, but there is insufficient evidence for such at this time. Like triangles, diagonals can not be called until their five waves are in place - and, at best, this would be (i), down, and (ii) up, of such a diagonal. 

To even begin a downward wave, price must exceed the red down fractal (v) shown on the right. To begin an upward count, price must exceed the blue up fractal (^) shown on the left.

For this reason, I am not glued to any particular count at this time. The market must simply demonstrate by price lengths or overlaps which direction it wishes to proceed in. It'll be another good night to watch the overnight prices, and see what gaps or other clues are provided.

Have a good start to the evening.
TraderJoe

Friday, March 27, 2020

The Battle at the 18-Day

The U.S. Dollar was down today - nearly a full cent, as the FED pumps to try to turn the contraction around. GOLD was down. Crude Oil was down, and - even with this - stocks were down. Did I mention the U.S. Dollar was down?!

The daily chart of the ES Futures is below. Price initially waged a battle at the 18-day SMA, mostly in the after hours, and then price settled below that line - leaving the market with a negative bias.

ES Futures - Daily - Tag of 18-Day SMA

This increases the probability somewhat that a Minor 4th wave (non-overlapping) might be made as part of an impulse wave downward.

You'll also note that the upper daily Bollinger Band is about to cross under the 100-day SMA. If price should rebound at some point, that level would likely offer formidable resistance to further upward movement. We are not there, yet.

From the slow stochastic, we see that it became un-embedded from being under the 20 level for three or more days, and when that occurred, price and the 18-day SMA tried to come together. That was the expectation, and it has been met. You will also note that the slow stochastic is no longer in over-sold territory. It has effectively worked off the old-sold condition.

Wave 5, lower, if it occurs, may not be easy to figure out. It might be a diagonal, or it might be an impulse, or it might be an impulse with a diagonal in its fifth wave. So, we'll do our best as the wave progresses to monitor for a new low.

The stimulus bill was passed today, pretty much as expected. And yet, this is how the market reacted. Oh, and did I mention, the U.S. Dollar was lower.

Have a good start to the evening and the weekend.
TraderJoe

Thursday, March 26, 2020

What's It All About?

I'm going to post a chart I posted earlier. Many of you will look at the count, shake your head, and ask "why is he posting an incorrect chart?" The chart is of the U.S. Dollar Index. When I posted the chart, I specifically stated, "The longer term analysis indicates the dollar should not go over the high." That's why the A-B-C clear alternate was posted on the chart. And I said so in the comments.

DX Futures - 2 Hr - A-B-C


Clearly, the chart had the makings of the fourth wave at the point market minute ((c)) of 4. It was a perfect 38% retrace. And the EWO was in reasonable territory. Did it hold? It did not. This is what it's all about. It is about the FED spending unlimited resources (literally) to bend the Elliott waves into less recognizable patterns, or at least ones that trap the greatest number of participants into leaving their profits in the market.

Did the minute ((b)) wave make a new high for a fifth wave? It did not. Is there a clear "third of a third" on the EWO? There is not. Are there a clear five waves down from 3 to minute ((a))? There are not. It looks more like a "three" than any wave I have seen. Are there are clear five waves up to minute ((b)), so it would be a fifth wave instead? There are not.

The FED knows the only way they can help is to "bend the yardstick"; it is to "change the ruler". This chart shows clearly how they have done that. They need to lower the Dollar, not see it increase. They need to make sure that wave counters have "the most difficult time possible". And, they do it by changing the yardstick - whenever they wish. They can add and drain resources to the market unseen to the retail trader, and force the "Smart Money" to make maneuvers based on what they, with better access, can glean from the treasury market and open market operations.

Does this mean that The Eight Fold Path Method for Counting an Impulse does not work? No, it means the opposite. The Eight Fold Path Method was developed for precisely this reason. As the methods states, "1-2-3 is the same as A-B-C until it is not."

So, what does it mean for U.S. stocks? It means that while a Minor fourth wave is not invalidated yet, the odds of it occurring correctly have dropped. The parameters are pushed out to the max, making it even-odds only, or less-than even-odds, as opposed to yesterday where the odds favored the fourth wave at the location in which that wave ended.

The key lesson is this. They are playing a game against you, and they are doing it with your tax dollars and the lack of interest that they pay to retirees in their savings accounts. They do not want five-waves-down in the U.S. equity market. They don't want it because they know it will signal to most people even a greater drop ahead. True fact: they have even announced to you that they are doing this - just minus the focus on the Elliott Wave. They say they are doing it to try to increase inflation, or increase employment, or improve the economy. Whatever the faux reason - they are doing it.

I can not fight a trillion dollars. I can only try to count the waves it makes or the waves it does not make. As I have often said, "I do not make markets; I can only try to count them."

ES Futures - Daily - Wave 4 at Risk


Have a great rest of the evening.
TraderJoe


Wednesday, March 25, 2020

'Minimum' Wave 4 Attained

With 144 candles on the ES 4-hr chart, price moved above the minute ((a)) wave, meeting the 'minimum' expectation for a flat fourth wave. As such, if the fourth wave holds, it would alternate really well with the sharp (or zigzag) second wave.

ES Futures - 4 Hr - Minute ((c)) above ((a))

The 4-hr candle at the cash close (the just one prior to the settlement candle) was a weak Gravestone Doji. It did not close exactly equal to its open, but close to it.  For this candle to indicate the end of the fourth wave, the high of the candle should hold, and there should be a confirming lower close candle below the EMA-34. 

If confirmation of the Gravestone Doji is not obtained, then it is still possible the upward wave is in a fourth wave triangle. In that case, it would be minuet (iv) of minute ((c)). However, from the minute ((b)) wave low, five-waves-up can be counted including a slight truncation at today's high. That truncation would be acceptable.

The Elliott Wave Oscillator is about as high as it should get on this trip above the zero line, so watch any further upward movement in price and the oscillator carefully. The EWO should try to hold 100 - 120 for the fourth wave.

If the Minor wave 5 begins in earnest, it should make a new low and not truncate before doing so. Trading below the EMA-34 and the mid-line of the channel shown would be mile posts along the way to a potential new low.

Have a good start to your evening,
TraderJoe

Tuesday, March 24, 2020

EWO Green & Above Zero

At the end of the day, with 140 candles on the 4-hr chart, the Elliott Wave Oscillator has just gone to the other side of the zero line.

ES Futures - 4 Hr - EWO is Above Zero

Using The Eight Fold Path Method, this most likely means prices are into the Minor 4th Wave as shown on the chart. Typically, this wave should retrace about 38% of Wave 3, and tends not to go much beyond 50% of Wave 3. So, there is not any clear evidence that wave minute ((c)) of Minor 4 is over. It may challenge the upper channel . It may try to fill the gap below minuet (a)

However, the EWO should not go to beyond +40% of the trough reading. We'll address that situation only if it should occur before a Minor 5th wave low. Wave Minor 5 should make a new low. It should not truncate. It could become as long in price as Minor 1. But, if Minor 5 does make a new low, it should occur on a divergence with the lowest through on the Elliott Wave Oscillator.

It looks like Congress is working on the larger stimulus bill, but as of this writing, the work is expected to carry-over into Wednesday.

Have a good start to the evening.
TraderJoe

Friday, March 20, 2020

They Popped A Little, Then Dropped

Again, because of the price action today, this variant of the count, with roughly 130 candles on the chart, now appears to have the best chance for success. We have been attempting to count an impulse, if at all possible. We did give some brief consideration to an overall diagonal lower, but the upward waves today became too long in price and time, so the diagonal consideration is now in the background.

ES Futures - 4 Hr - Flat?

The singular problem with this count is the size of the minuet (a) wave of the minute ((iv)) triangle of Minor wave 3. However, recall we had this same issue counting to the upside in January and February, 2018, when we called for a Minor 4 triangle because the minute ((a)) wave would have been too long and created a degree conflict. If this same consideration is given, then wave Minor 3 occurs within points of the 1.618 x 1 extension, as shown by the Fibonacci ruler. The consideration is that the minute ((iv)) triangle resolves the degree conflict with the size of Minor 2. It results in minute ((iii)) of Minor 3, on the low of the Elliott Wave Oscillator, and Minor 3 on a divergence, as per The Eight Fold Path Method which is the featured post in this blog (see link on the upper right).

Subsequently, we'd have three waves up, yesterday and today, to minute ((a)), up, and we already know we had a near 100% downward wave to a near-equal low. This could be the minute ((b)) wave of Minor 4 - or part of it. The EMA-34 finally contacted what could be part of the fourth wave.

But, so far, while the EWO is close to the zero line, price is not up near the upper channel line. So, again, a significant difficulty in a trending market is assuming it will reverse. It hasn't really yet, and we are not assuming it will. The market must show us that.

Minute ((b)) could go down to between 1.382 or 1.618 x wave minute ((a)), up. A flat wave for Minor 4 would alternate well with Minor 2 and the alternation would finally be in the expected sequence for an impulse (a zigzag or sharp for Minor 2, and a flat or sideways for Minor 4).

Congress has not yet agreed to the larger stimulus package for the economy. It would be great if they did so, soon.

Have a great start to the weekend.
TraderJoe

Thursday, March 19, 2020

What If they Drop instead of Pop ? (Only Because of Today's Action)

Today, in the comments, we showed an internal count of an impulse up, and then a diagonal. The diagonal took much more time to make than the impulse, and it did not exceed the impulse high. (That chart may be seen at this LINK.) Because the diagonal 'took more time' than the impulse, it should be of the same or higher degree than the impulse.

In other words, today's internal count can be a-b-c upward.

So, we have been showing this potential downward count in the ES 4 hour futures as the 'minimum' impulse lower.

ES Futures - 4 Hr - Minimum Impulse Lower

We said that wave Minor 4 can become longer in time than wave Minor 2 and alternate with it by becoming a FLAT wave. And that would mean a lower fifth wave. As of yet, Congress has yet to report out a major stimulus bill. What if they don't tonight, or if prices make a new low for some other reason? Then, it seems this alternate would be able to be applied.

ES Future - 4 Hr - Potential Diagonal Lower

Again, this count is only made possible by today's internal count and possible failure wave Minor 4. Such a count would now diverge against the Elliott Wave Oscillator in the manner expected. But, a lower low would be expected. Here is the kicker. If this count played out, then most would expect to find resistance at the upper channel line, and it might not be there.

From a degree labeling perspective, wave Minor 2 would be larger in price than minute ((b)) of Minor 1. And, it might explain why minute ((b)) of Minor 1, is shorter in time than minute ((a)) of Minor 1. Still, and I need  to emphasize this, this count was simply not even plausible before today. As it is, wave Minor 4 in this count is a tad longer in time than wave Minor 2, but at least waves Minor 2 and Minor 4 would then be of the same degree.

For this count, a new lower wave Minor 5 low must be made, and it must be in a zigzag. Further, Minor wave 5 would need to remain shorter than Minor wave 3.

Personally speaking, with as much fun as I have with the markets, this is where I get my sleep over-night, let the "Smart Money" decide how this goes, and then try to deal with the result - whichever it is.

Have a good start to evening.
TraderJoe

Wednesday, March 18, 2020

'Minimum' Impulse Requriement Met - 3

Although price swings were a bit more wild today, with lower prices and additional trading halts, the interpretation of the four-hour chart has not invalidated a larger 4th wave.

ES Future - 4 Hr -

The EWO stalled its upward movement, then recovered a bit. Earlier today, we showed a chart (link HERE) of where the downward 1.382 level was from the initial wave 4 - or ((a)) of 4 - location. So, there is a decent probability that today's low was the minute ((b)) wave of 4.

Towards the end of the day, there was an initial 4-hr candle that formed a potential 'hammer' candle. Remember, such a candle needs confirmation with higher closing candles. With 115 candles on the current chart, if confirmed, it would be reasonable to see the EWO head back towards  the zero line.

Again, such a rally might come on the announcement of any other significant fiscal stimulus or progress on the disease/testing.

Have a good start to the evening.
TraderJoe

Tuesday, March 17, 2020

'Minimum' Impulse Requriement Met - 2

Nothing much has changed from yesterday, except the EWO has lifted a bit more towards the zero line. 

ES Futures - 4 Hr - EWO Green

See yesterday's post for the fourth wave options which would be 'longer in time' than the one shown. Keep one eye on the FED announcement tomorrow, and another on any firm agreement for a fiscal stimulus from Congress.

Have a good start to the evening.
TraderJoe

Monday, March 16, 2020

'Minimum' Impulse Requriement Met

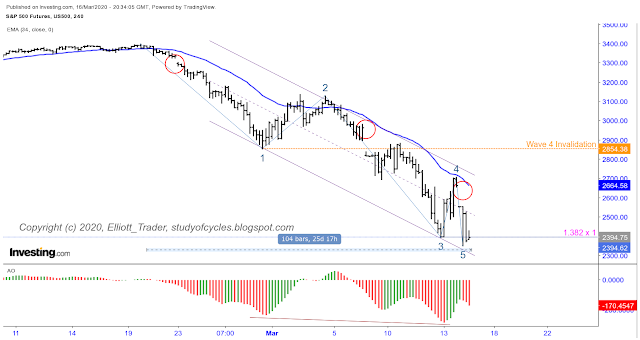
From the same charts we have been showing for days, you can now discern for yourself there is a clear pattern of 'five-waves-down' that meets the minimum requirements for an impulse. The only question remaining is whether wave 4 finds a better pattern of alternation.

ES Futures - 4 Hr - Five Waves Down at Minimum

Wave 4 could still turn out to be a flat wave, or a running triangle, as in the illustrations below. This is because we note there are only 104 candles on the above chart, and not the 120 - 160 recommended by The Eight Fold Path Method.

Additional Ways Wave 4 Could Extend in Time

If wave Minor 4 wants to extend in time, that is perfectly okay with me. Right now it could do so as a Flat wave or as a "running triangle" as the wave after Minor 3 is lower than 3.

Such a pattern might allow wave 5 to reach a more typical length of 5 = 1. But, it needs to be said, that with trading halts, a FED meeting and a potential legislative stimulus package ahead, the best that can be done is to count the internal wave sequences, keep and open mind, and see if the Elliott Wave Oscillator returns to the zero line.

I will once again caution readers to 'self-censor' nasty comments being posted that have nothing to do with an Elliott Wave count. Such comments may cause the commenting mode to go to 'moderated only' or to be discontinued all-together. I clearly have better things to do with my time than to clean-up the words of those who can not be professional and/or stick to the topic at hand.

Have a good start to the evening,
TraderJoe

Sunday, March 15, 2020

No Preconceived Notions - 2

The title of this weekend's post is "No Preconceived Notions" for a reason. Yesterday, we covered the case for how an impulse could be made. We said one thing not to like was that the third wave did not reach the 1.618 extension which is more typical for an impulse. Yet, we know the third wave is longer than the first.

We also noted that a lot of stimulus is currently being applied. There is potentially legislative action due next week, and there is a Federal Reserve Meeting and rate decision to follow. With that in mind, we said the best that one might do this week is to count the internals of any upward wave, and see which pattern it fits best. A second pattern that could work equally well is that of the expanding diagonal.

ES Futures - 4 Hr - Expanding Diagonal

Things to watch for. In this count wave 4 would need to become longer in price than wave 2 and should become longer in time, as well. Wave 4 needs to overlap wave 1, without also exceeding the end of wave 2.

Then, IF a lower low is made, wave 5 would need to become longer in price than Wave 3, and would likely become longer in time, as well. 

Such a diagonal might also explain the current time signatures that wave 2 is a bit shorter in time than wave 1, and wave minute ((ii)) is also shorter in time than wave ((i)).  This count might also better explain why there is no seeming "three-of-three" peak at this length in the EWO of about 100 candles.

In this count, if wave 4 gets underway, then it's Elliott Wave Oscillator should make an equal high or higher high to the point it did for wave 2. Then, the EWO on Wave 5 would make a lower low than it did on wave 3.

Also, it means on the fifteen minute chart, that the three most recent up waves might develop into a longer impulse instead of the zigzag. We just have to count to see which it becomes.

So, we have no preconceived notions. We will watch and we will count. Please note that this is the second post this weekend, and you may wish to read yesterday's post as well.

Have a great rest of the weekend.
TraderJoe

Saturday, March 14, 2020

No Preconceived Notions

For an impulse wave to be in effect on the four-hour chart of the ES futures, below, there must be a non-overlapping fourth wave higher, and then a fifth wave to a lower low. Truncation not allowed. In the chart below, the invalidation level for a fourth wave is shown in orange.

ES Futures - 4 Hr - Channel

At this point it - an impulse - is still plausible. The major wrinkle, so far, is that wave Minor 3 is not a 1.618 wave. It is a 1.382 wave at this time. But, this may be understood in terms of the massive Federal Reserve stimulus that was thrown at the market on Thursday & Friday, and what will likely be some fiscal stimulus in the form of legislation early next week.

We will note - as in previous posts - that the Elliott Wave Oscillator has made a lower low, and is now likely trying to regain the zero line or near to it (remember, it is allowed to stall around +10% of the lowest trough reading). And all of a third wave is below a line from 0 - 2.

The EMA-34 appears positioned properly to tag a fourth wave, but even it doesn't have to do so right here. Why? Well, a triangle or flat could form for a fourth wave, and the EMA-34 might wait to tag only the minute ((e)) wave of such a triangle or the minute ((c)) wave of a flat.

The reason I say there are no preconceived notions is that this count could devolve into a contracting diagonal or other structure made up of waves starting only of A,B,C as shown in the alternate count in red.

If the market wants to continue to impulse, it might do so after - or in conjunction with - the upcoming FED meeting and policy announcement. A triangle fourth might be awaiting a FED decision, etc. Remember, a triangle could be a running triangle or barrier triangle, as well as a regular symmetrical triangle at this point.

So, the best plan seems to be to follow the internal waves as closely as reasonable, and see if that lower low is made, or not prior to wave 4 invalidating.

Have a great start to the weekend.
TraderJoe

Thursday, March 12, 2020

Significant Lesson

So, this is the way I was taught to count Elliott Waves. The 'base channel' has been broken lower. There is now another parallel acceleration channel which is shown on the chart. As long as prices continue to decline, and/or the EWO makes a new low, and as long as prices remain in the acceleration channel, then a third wave (or a 'C') wave should be respected.

https://invst.ly/q3jke

I say, 'or a 'C' wave because the alternate for 1,2,3 is A,B,C until it is not. It is very probable that Neely's rule of wave 2 always being longer in time than wave 1 is being put to the test here. But, based on the 'size' or measurements of the waves, degree considerations still work.

A flat wave up was never confirmed by crossing the (b) wave higher. The market was looking for the President to lay out clear plans for fiscal stimulus, and instead, he laid out clear plans for economic contraction by curtailing travel to Europe.

Regardless, the market is exceptionally disjointed due to circuit breakers interrupting trading at unspecified times during the day. I do not think we are making a diagonal downward as the zigzags are multiple zigzags.

Update after the close

ES Futures - 4 Hr - A Third Wave of Some Type


We have not concluded that wave minute ((v)) of 3 has ended yet. Nor have we concluded that wave Minor 3 has ended yet. The only conclusion reached is that since wave minute ((iii)) of 3 is shorter than minute ((i)) of 3, that wave minute ((v)) of 3 must remain shorter than minute ((iii)) of 3. So far, it is much shorter.

At the settlement, wave 3 is 1.272 x 1. Since wave 2 is a 50% retracement (and not a 38%) then wave 3 is allowed to become the extended wave. That means it could easily travel to 1.618 x 1. We are not there yet. As I have said before, the worst mistake one can make in a trending market is to assume it will reverse.

The significant lesson learned is that very, very clearly second waves are not always longer in time than their first waves. Wave 2 was close, but not exact. Wave ((ii)) is not even close.

However, note in this count, that all of wave 3 is, indeed, below a line from 0 - 2. Further, minute ((i)) takes less time, and covers less price than Minor 1. Also, minute wave ((ii)) takes less  time and covers less price than Minor 2. So, degree labeling is being adhered to.

And, once we can determine where wave 3 ends, then we will determine if a better overall parallel channel can be formed.

Have an excellent start to your evening.
TraderJoe

Wednesday, March 11, 2020

Divergence Maintained - 2

For a third day, the Elliott Wave Oscillator still diverges from price. Prices gapped down in the overnight, and when the cash market opened, they became very choppy immediately, and just ground and whipped around.

The cash market made a lower low, the futures market did not by the settlement, but it could. At any rate the count likely remains that of a FLAT wave.

ES Futures - 4 Hr - Still Diverging

Prices would need to get up over the most recent b wave to better confirm a flat wave in progress. 

Have a good start to your evening.
TraderJoe


Tuesday, March 10, 2020

Divergence Maintained

With the caveat that a minute ((c)) wave upward can fail, there is a good possibility a flat is under construction. The divergence of the EWO on the minute ((b)) wave was maintained for a second day.

ES Futures - 4 Hr - Flat?

The minute ((b)) wave is currently inside of the 1.618 x minute ((a)) level which is shown by the Fibonacci ruler on the chart. The minute ((c)) wave might be constructed by any actual news on fiscal stimulus.

Have an excellent start to the evening.
TraderJoe

Monday, March 9, 2020

Always the Same

Regardless of the size of the wave, and regardless of one's thoughts about their wave-counting skills, a good wave count always begins with the designation of a "base channel". The base channel (or zigzag channel) for this move is shown below.

ES Futures - 4 Hr - Base Channel

When one looks at the base channel and the two significant futures gaps shown, one can see that it is hard to tease more out of the wave count than this. Could the most recent down wave be a minute ((b)) wave down on a divergence with the Elliott Wave Oscillator?

Yes, that is possible, but one should not assume so, until there are more substantial waves and more direct evidence. Could there be a Tuesday turn-around day? There could, but there is very, very little evidence for that yet. The prime case would be that the Fibonacci ruler shows today's down move is a 1.382 relationship. And, one could argue that the VIX is very high, and the CBOE put-call ratio is quite high - perhaps in the "Zone of Despair".

But, price will still be the best indicator. And, there, upward overlap, trading above the mid-channel and eventually above the upper descending channel line will be better indicators of a minute ((b)) wave, lower.

Trading full bars below the lower channel boundary, would tend to indicate other things. As it stands now, there are only three-waves down.

If today's down wave is the ((b)) wave of an expanded flat, it would indicate a significantly weaker market that we have seen in a very long time. It would be similar to the start of the 2009 - 2018 bull market - which also started with a flat wave.

If a zigzag winds up being the down count, then a diagonal lower can not be ruled out. 

Bottom line .. it is a little too early to say what the overall count is with more specificity. Sharp reversals are possible in bear markets, and we have to see 1) if they occur, and 2) how far they travel.

Try to relax and recognize the most typical wave counting options. Flats are a little more common that diagonals, so perhaps that is what will develop. Don't get worried too much about 1.382 or 1.618; a flat can 'fail' if the market is to be exceptionally weak.

For now, let's hope the market circuit breakers are not needed for a while. They are very, very disruptive to actually trying to place orders.

Have a very good start to your evening.
TraderJoe

Sunday, March 8, 2020

Some Homework For You

This is the second post this weekend. If you have not seen the first, yet, you may wish to view it, as well.

This chart is being posted for those of you who think a "B" wave should not be over the 1.382 level. This is a weekly chart of the New York Composite Index (symbol NYA). Where did this "B" wave - Intermediate (B) in this case - top? Why, exactly before the 1.382 level. That's where.

NY Composite Index - Weekly - Intermediate (B)

And, for all the talk of higher $NYAD lines, look at the stunning divergence on the weekly Elliott Wave Oscillator.

But, did the other "high-flying" indexes make 1.382 waves? They did not. The Dow got to inside of 1.618, and a chart of that was already posted (can be seen at this LINK). The S&P500 and the NDX got to slightly over 1.618.

So, now, the primary item under consideration for the longer term is whether the Dow and the S&P500 did make true ending diagonals - which their market trend lines did sketch out - or is it just the Intermediate (B) wave - as this chart and degree labeling seems to point to. You'll note that it does not seem possible to make an ending diagonal wave out of the above structure.

And, now for your bit of homework. Where did that Intermediate (A) bottom on the NYA compared to the up waves made in 2016? Take some time to investigate it, and you'll have another clue as to why I think the larger trend topped at 5 of (5), shown. Remember, the Dow and the S&P did make those higher highs in October, 2018. The $NYA did not and I called it a fifth wave failure at that location.

Have an excellent rest of the weekend.
TraderJoe

Friday, March 6, 2020

So Far, the78.6% Has Held

Today, the 78.6% retracement appeared to have held, and may have finished the minute ((b)) wave downward.

S&P500 Cash Index - 15 Minutes - Minute ((b))?

If we began minuet wave (i) of minute ((c)), upward, that still doesn't mean that Sunday night is out-of-the-woods, as a significant retrace can still be expected. And, because there is no overlap on diagonal wave i, downward, we can not definitively rule out new lows, but a larger fourth wave in this location does seem less likely. Possible, but less likely.

Have a good start to the weekend.
TraderJoe

Thursday, March 5, 2020

Under No Grand Illusions

I harbor no such illusions about being able to 'nail' this correction. So I start small. Today, in the comments for the previous post I was able to count down a diagonal wave. Because of the way it formed (as 3-3-3-3-3) but with a lower fifth wave, it could be ending, or it could be leading! Thank you Mr. Market for providing two options in the same exact wave. (I have discussed that in posts before: some diagonals can be their own alternate wave.)

But, as stated previously, I was looking for a downward wave that would break the recent up trend line. Today's wave did that, and it did something else - as well. Here is the hourly chart.

ES Futures - 1 Hr - Long Enough Minute ((b))

Today's wave - because of its shallow angle - also wasted enough time to be able to become a minuet (c) wave of a completed minute ((b)) wave at today's low. If you will view the time ruler, you can see that this sequence, starting at the end of minute ((a)), with minuet (a)-(b)-(c), is now longer in time that the upward diagonal - which is potentially a leading diagonal. We simply won't know that unless or until its high is bested.

But, the minuet (b) wave is interesting: it hit the 90% level, upward, qualifying it for the (b) wave of a Flat wave, and that means the structure that you see here could be a simple truncated flat for minute ((b)).

Of course, we do not know what tomorrow's employment report will bring - although we could see today that factory orders were weak. Still, employment tends to lag other data by a few months. Therefore, we have posted an alternate that today's diagonal is only wave 1, of a larger five wave minuet (c) wave to finish minute ((b)) lower than today's level.

If, instead, there is another five-wave sequence, upward, from here then the objective would be to finish a second wave, Minor 2, with a retrace wave that is longer in time, than Minor 1, down. And, it would be excellent if it surpassed the March highs so there was no truncation.

The Elliott Wave Oscillator on this time scale, is not providing too much help, so it will be best to see how employment looks tomorrow, and to try to gauge the reaction to the report.

Have an excellent start to your evening.
TraderJoe

Wednesday, March 4, 2020

Biden's Stock Market or Trump's ?

What? Today they blamed the stock market going up on Joe Biden beating Bernie Sanders (although we did say it could likely go up 'after' the FED rate cuts). I thought the stock market going up was supposed to be blamed on Donald Trump? What's going on here!

ES Futures - 4 Hr - Some Or all of 2

In the above chart, the current up trend line has not been broken to the downside. And, the time of the recent up wave does not yet exceed the number of bars in Minor 1, down. One person (not me) has counted this up wave as minute waves ((w))-((x))-((y)). Another really good option is that the first series, up, was minute ((a)), and we'll make a minuet (a)-(b)-(c) down to falsely break the up trend line and get everyone bearish again, in a minute ((b)), down, and then there will be a minute ((c)) wave upward - the "see your creator" wave.

If there is another set of large waves upward in the overnight, then it is also possible to get (a)-(b)-(c), up to ((a))-3, and then a ((b))-3 wave down to 90%. A third option is that minute ((w))-((x))-((y)) double-zigzag lengthens out to a relatively rare triple zigzag, upward.

As I have said, with eight different ways - excluding triangles - that this correction can occur, an unskilled analyst has a 1:8 random chance of getting it right. A skilled analyst has about a 1:3. At least we can outline the most-probable routes.

That's all for now.

Have a good start to the evening.
TraderJoe

Tuesday, March 3, 2020

FED Cuts; Markets Pop & Drop

The U.S. Federal Reserve cut their interest rate by 0.5% today, the equivalent of two cuts all at once, are now back down to a target range between 1%-1.25%, and made the first inter-meeting action since December 2008 - during the financial crisis. The market initially popped on the news, yippee, and then it sold off quite a bit. But, wait a minute. The rate cuts are supposed to boost the market, right? (Eventually it might for a while). Oh, you say, but traders sold because the move was widely expected? Buy on the rumor, sell the fact? Hmm.

According to Steve Leisman of CNBC, the move was intended to 'shock' markets. Is that why they ended lower?

So, nothing has changed with the chart of the ES futures, other than to change the time scale, below, which we are changing to the 4-hr chart.

ES Futures - 4 Hr - Some or All of 2

As you can see from the Fibonacci ruler shown, the up move reached the 50% retrace level. This means it has, already, qualified as a retrace that can have a 1.618 wave to the down-side following it.

The up move looks shorter time-wise than the down wave, but the EWO has come back to the zero line - which is all it needed to do. Accordingly, we are saying this wave could be "some or all of 2". Given the number of styles of corrections, we must watch for further development. While we are, we will remind you of some of the most common kinds of corrections for second wave: zigzag, or multiple zigzag, flat, expanded flat, flat-x-zigzag, or flat-x-triangle.

We will remind you that wave 2 can never be a triangle in it's entirety.

So far, the up move has been orderly. It 'can' be counted as the expanding diagonal a wave we cited yesterday, but we also have a sneaking suspicion it can be counted as a three-wave sequence. Accordingly, the wave label at this stage can be a, a-3 or 2.

Remember, if this up wave is an a-3 wave move, then for an Flat, the b-3 wave down must reach the 90% level of the wave 1 bottom by Elliott wave 'rule'.

We will better label this wave as more information about its nature comes in. We have a sneaking suspicion that in addition to the 'grinding up wave' that you see above, there might at some point come a "see your creator wave" near the end of the move - one that will convince you that we are going over the top again.

Until then, we did a decent job today counting some intraday waves. We had fun and hope you enjoyed it.

Have a good start to your evening.
TraderJoe

Monday, March 2, 2020

First of the Month Money

Today was the usual influx of cash from the reinvestment of dividends, contributions from company 401k accounts, company bonuses, and pensions which are often automatically allocated to the market-place without much human intervention on the first trading day of the new month. As the result, the wave which I showed yesterday as the invalidation point was hit today at the end of the day. This is shown in the chart below.

As a result, I demoted the waves in the count to minute waves, and we now have a Minor wave 1, at the low. I did stick to my word about the invalidation point, and the count below does meet degree labeling requirements.

ES Futures - Hourly - Minor 1

I told blog reader and contributor BBRider I would consider the downward diagonal, which he must be given credit for proposing, if an when there was upward overlap. There was, today, at the very end of the session. There wasn't much point to looking for a better count until there was that overlap.

One problem is that the count from the bottom is a complete mess, and therefore may still be an incomplete structure - and it 'may' be the start of an expanding diagonal. 

However, given the rise in the EWO to the level it has risen to (beyond -40% of the trough low), it appears that a second wave is in progress. By comparison, wave 2 will have a lot of hours to burn yet - many of which will occur in the overnight.

This is all I can add at this time. It was a funky wave down - not withstanding the 77 point drop in the futures last night - but there is alternation as shown and minute ((v)) on a 5-minute chart is an expanding ending diagonal that counts very well.

Have a good start to the evening.
TraderJoe