Friday, November 30, 2018

Wave in a Channel

Market Outlook: Likely Long Term Top Identified
Market Indexes: Major U.S. Equity Indexes closed higher
SPX Candle: Higher High, Higher Low, Higher Close - Trend Candle
FED Posture: Quantitative Tightening (QT)

Today's post is occurring in two parts. The first part shows the S&P500 Cash Index chart - close only - using five minute closes to simulate one of Neely's techniques for wave counting. Besides simulation, we think this view can provide unparalleled insight into the nature of this wave, and wave counting in general. Yes, using 5-minute closes might leave out a data point or two, but, yesterday, we used the hourly futures with every data point included, even overnight ones, and one can arrive at a slightly better count by using cash chart.

Further, we know we verified all of the degree labeling requirements on the hourly futures. So, we will not dispute those in this chart. The main purpose of this chart is to show the form of the wave, without a lot of the distractions from the bars.


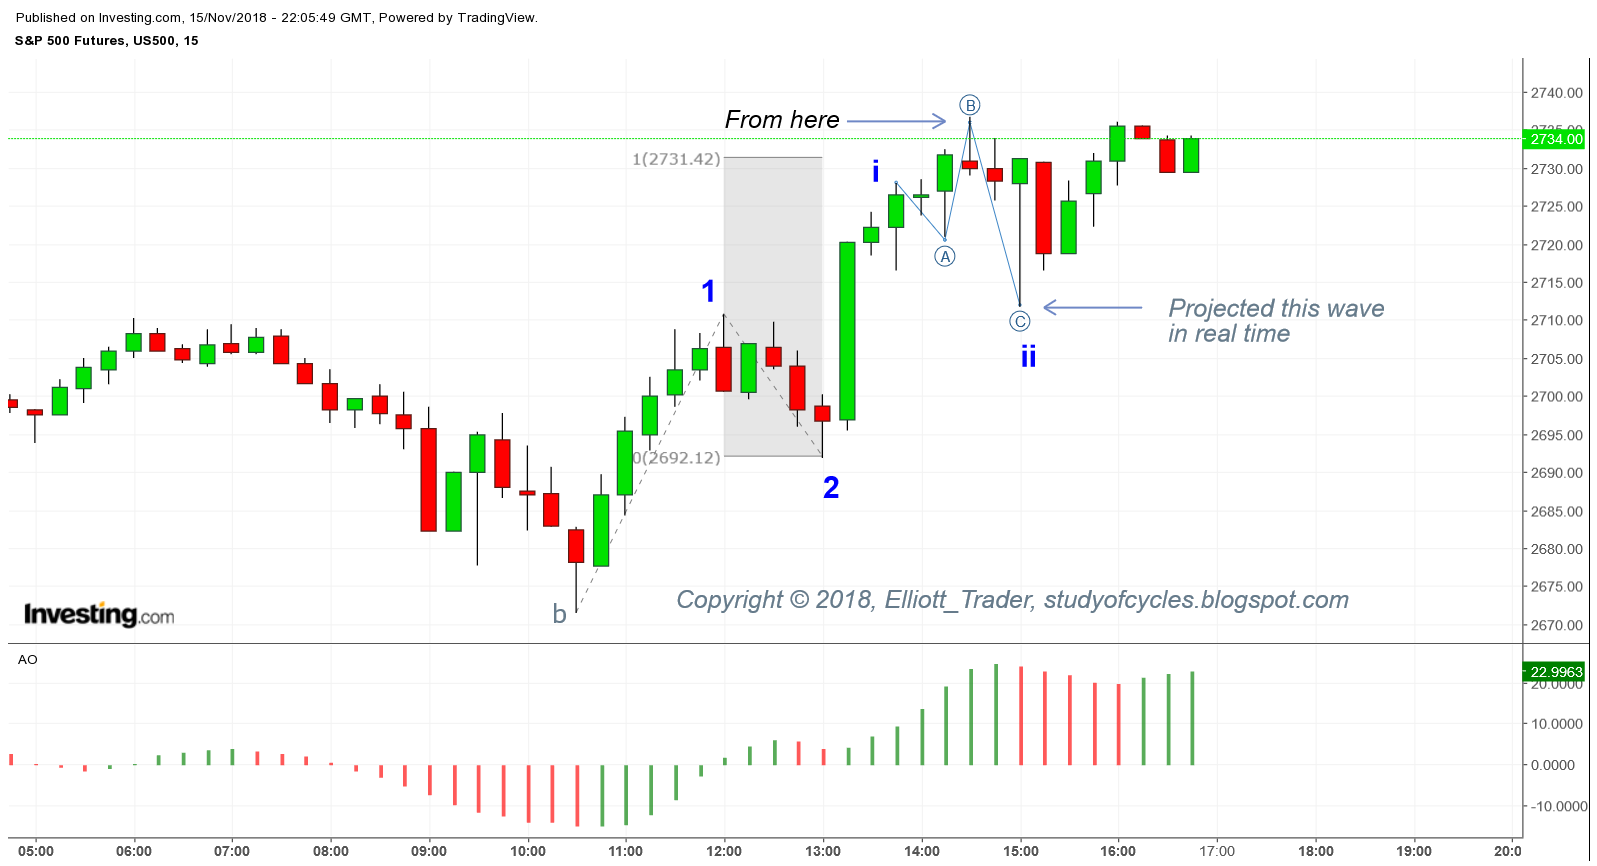
S&P500 Cash Index - 5 Minute Line - Neely Style


The first thing we notice about cash, is that where it was possible to call wave ((2)) a sharp in the futures, this is not possible in cash. 

Why?

This is because of the Neely guideline that a line from zero to wave ((2)) must not cut off any part of a wave ((3)). Showing wave two at almost any earlier location would do that. And, at this location, wave ((2)) overlaps wave ((1)) as required for wave ((2)) to be "corrective" to wave ((1)).

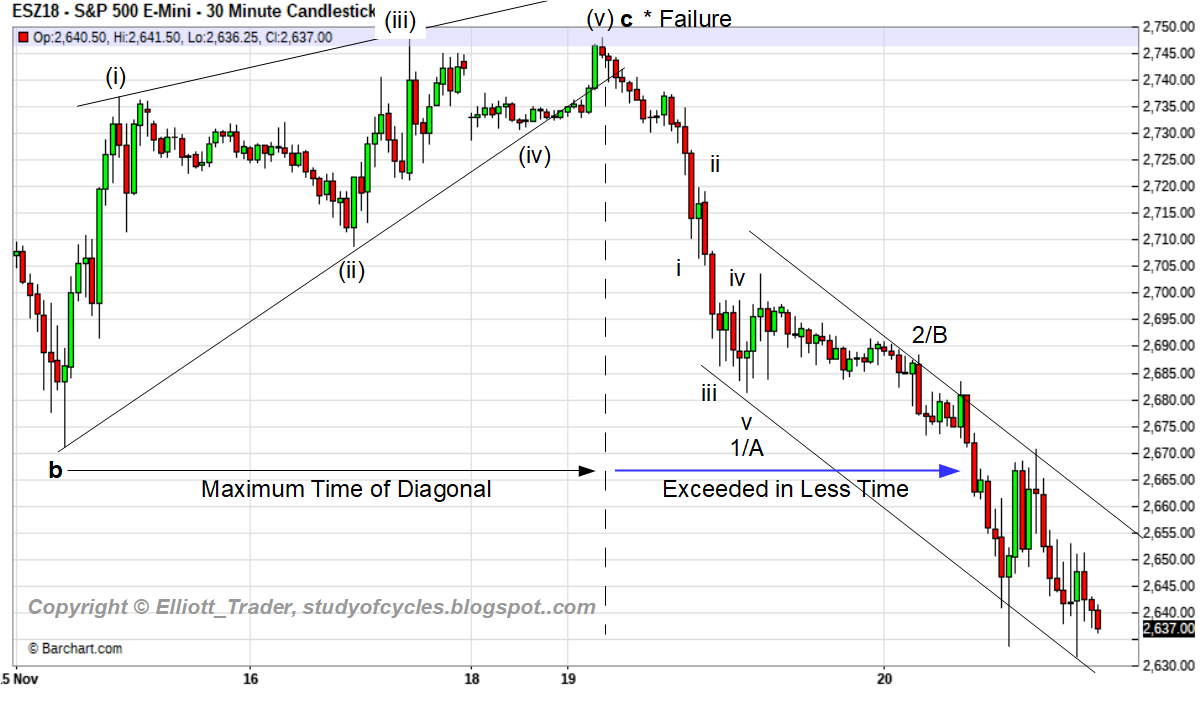
Wave ((2)) thus becomes a "running wave" with a higher (B) wave, and that is important. It means that wave ((4)) should only be a 'short sharp' or a longer triangle. If the fourth wave were to become longer than two in time, then it would have to be a triangle. But, keep in mind this is an a wave up, overall. As such, it can throw a wrinkle or two into the impulse. It doesn't have to but it can. The wrinkle would be that that fourth wave is shorter in time than the second wave for it's alternation. This is the real discussion of alternates in wave analysis. In either case, the (B) wave of ((4)) should not cross over the top to alternate with ((2)). As the chart shows, it didn't.

The second part of this post consists of reminding us that the daily ES price is still over SMA-18, and therefore still has a positive bias. There is some potential for two things over the weekend: a) the results of the G-20 meeting. If negative, they could temporarily bring a down draft. If positive, perhaps a gap up. b) Monday will be the first day of the new month with the usual potential for inflows into the market, as we have written about many times before (company bonuses, dividend reinvestment plans, 401k's, etc.). If G-20 is positive and inflows occur, and a gap up results, then there is an alternate count here where ((1)) and ((2)) are actually ((A)) and ((B)) of the (y) wave upward to minute ((ii)).

That latter interpretation would be the ((A)) wave as a Leading Diagonal.

There is nothing that says that wave ((5)) in the above chart is done either. It could be but it doesn't have to be.

Take it easy. Rest up. Have a good start to your evening and to your weekend.
TraderJoe

~~~~~~

P.S. In trying out the ALTERNATE count of A, as a diagonal at the bottom, and B the very brief retrace, it creates a degree violation that 1 of C, at or near any of the peaks of the high, which would be a sub-wave of lower degree than A, yet it would be longer than A in price, which does not work. Good news.

1 of C (in the ALTERNATE) would have needed to be located near one of the highs because the potential gap up would be a iii of 3 of C.

Bottom line: best count at this time is a five wave move from the bottom, most likely as an A wave to Friday's high.


Thursday, November 29, 2018

Over the Thin Red Line

Market Outlook: Likely Long Term Top Identified
Market Indexes: Major U.S. Equity Indexes closed lower
SPX Candle: Higher High, Higher Low, Lower Close - Doji Candle
FED Posture: Quantitative Tightening (QT)

Yesterday, on the daily ES futures, we said that since the close was over the SMA-18, that the market had a positive bias. Some disagreed, promptly entered shorts, and had their stops hit as the market did make a fresh new high today.  They told us how pointless wave counting seemed. It was better to use their trades. I have sympathy for them. Many times I have felt like wave counting is difficult at best - almost useless - until about five years ago when a number of concepts just began to 'click'. More about that later.

The new high was enough to create a 1.618 extension on a prior wave in the futures, and be high enough for a third wave, by measurement, and then some. It was also high enough to cross that "thin red line" we showed yesterday.

Here is the hourly chart of the ES E-Mini S&P500 Cash Index futures showing the current count of an impulse upward. The 1.618 Fibonacci extension from wave ((1)) to ((3)) is shown.

ES E-Mini S&P500 Cash Index Futures - Hourly - Likely Impulse In Progress

The wave locations shown are the only locations that allow counting without degree violations in the futures. There was a triangle for wave (iv) of ((1)), and there was an expanding diagonal for the c wave of (iv) of ((3)). Wave (iii) of ((3)) must have ended where shown or otherwise the longer wave to b would create a degree violation. That's ok. It made a flat wave to alternate with it's sharp (ii) wave of ((3)), and wave (iv) took more time than wave (ii), as well.

During the day, we gave guidance that IF cash crossed below the mid-point of the channel only then could one assume a corrective wave was underway. Futures broke the channel, cash never did : it was only a pull-back not one of the significant corrective waves. Still it provides a 'marker'.

Now, if wave ((2)) in the futures is a sharp, then wave ((4)) could either be a Flat or Triangle, with the flat preferred. That means price could go over the highs again.

According to the SMA-18, the bias remains positive, and the SMA-18 should provide some support to downward movement. The Hourly futures seem to be following The Eight Fold Path Method at this point, and the divergent high should be indicating wave (v) of ((3)) based on the EWO. We would expect the EWO to come back down towards the zero line at the end of wave ((4)), if it occurs as expected.

The day ended on an hourly bearish engulfing candle. There should at least be three waves down to start a flat or a triangle. The third wave likely also ended on an RSI divergence, a MACD divergence, and a volume divergence.

Have a good start to your evening.
TraderJoe

Wednesday, November 28, 2018

FED Remarks Day

Market Outlook: Likely Long Term Top Identified
Market Indexes: Major U.S. Equity Indexes closed higher; DJUtil lower
SPX Candle: Higher High, Higher Low, Higher Close - Trend Candle
FED Posture: Quantitative Tightening (QT)

U.S. Equity prices today were almost uniformly higher as the result of the reactions to FED Chair Powell's remarks. The potential down channel prices were following for a potential X wave broke to the upside, and prices continued higher. We had previously warned the new up wave was long enough in time to prevent the 1-2-i-ii count lower within the wave down from the 2,815 high.

Looking at the ES futures chart provides some simple clues. If the "thin red line" is broken to the upside, then it is possible minute wave two ((ii)) will become a double zigzag.

ES E-Mini S&P500 Index Futures - Daily - Thin Red Line

Because wave (x) did not reach the 90% level, then the double zigzag would be the correct wave structure. It is most likely not a flat wave. Price closed over the SMA-18m shown in green, which means the chart now has a positive bias. The daily slow stochastic has also turned up.

There can be "backing and filling" for a b wave at any point. Yes, there are other options, lower, but at this time the chart shows none of that evidence.

Have a great start to your evening.
TraderJoe


Tuesday, November 27, 2018

Overlapping Wave Day

Market Outlook: Likely Long Term Top Identified
Market Indexes: Major U.S. Equity Indexes closed higher; RUT lower
SPX Candle: Higher High, Higher Low, Higher Close - Trend Candle
FED Posture: Quantitative Tightening (QT)

All day today the market made a series of overlapping waves. About 11 AM we said a contracting diagonal could be forming on the intraday chart. As a result, there is no change to the count.

S&P500 Cash Index - Hourly - Overlapping Waves in a Wedge

Now, no matter how one tries to count the down waves in an impulse as a 1,2,i,ii, the second ii in such a count has become longer in time than the first two. And that would be a degree violation which is not allowed. And, again, the waves remain in a rather 'perfect' channel which could indicate a double zigzag, lower, forming.

Have a good start to your evening.
TraderJoe

P.S. Here is an up count on the current wave that does not violate degree labeling. All individual waves within (5) must remain shorter than (3), and they currently are. This is the half-hour chart.

S&P500 Cash Index - Half-Hour Chart - Potential Expanded Flat


Monday, November 26, 2018

No Acceleration Lower

Market Outlook: Likely Long Term Top Identified
Market Indexes: Major U.S. Equity Indexes closed uniformly higher
SPX Candle: Higher High, Higher Low, Higher Close - Trend Candle
FED Posture: Quantitative Tightening (QT)

In our Thanksgiving Day post of 11/22, recapping the prior day, we said that acceleration would soon be needed for minuet wave (iii) to get underway. Acceleration lower is not what occurred today.  In fact, in the latter part of the afternoon we posted that an impulse up had occurred. And that impulse upward also created upward overlaps which are difficult to reconcile as part of a downward impulse. As a result (i), (ii), (iii) in the downward direction now becomes (a), (b), (c) in the downward direction. And today's impulsive up move could be all or part of an X wave.

Here is the S&P500 Cash Index - Hourly Chart. The arrow at the top means we may soon be moving the black minute ((ii)) wave, circle-ii much further to the right.

S&P500 Cash Index - Hourly - No Acceleration Lower

The issue is this. The upward wave since 20 Nov, already has more bars in it than the flat (b) wave, formerly wave (ii), had in it. Therefore, since it has more bars and overlaps the downward b wave (as shown on the chart above), it is very, very likely a wave of a higher degree; like an X wave.

Again, this wave count is by measurement only. Not by guessing. Further, the degrees of the wave structure would no longer fit a continued downward third wave. Lastly, the downward structure again forms a 'perfect' channel. So, we must allow the possibility that a multiple zigzag downward is forming. The objective of that wave structure would be to reach the 90% or better level needed for the Flat (as per the FlatLander's post).

In the short run, this means there could be more poor momentum downward wave structure. In the medium term it means the 2,815 level could be revisited. We will take it wave-by-wave until the structure becomes more clear to all.

Have a very good start to your evening and to your week.
TraderJoe

Friday, November 23, 2018

Max Length of Sm i

Today was a largely a down day for major U.S. equity indexes. The purpose of this post is to clarify the maximum length of a sub-minuette first wave lower, Sm i; IF we are in minute ((iii)), lower.

S&P500 Cash Index - 4 Hr - Max Length for i

So, to avoid confusion, if mi = minute one, and (i) = minuet one, and i = sub-minuette one, then the maximum length for i is about 2,587. This is because as a smaller degree wave, sub-minuette wave i may not become longer than the previous larger degree wave - which is minuet (i) in this case.

However, a new minuet wave (i), down, of minute ((iii)) can become as long as mi. That is because in relationship to minuet (i), of the new minute three wave, then minute one - or mi above - is the previous larger degree wave. This is the  way a minute-three grows to become a larger wave.

I hope this is not too confusing. Please take some time to look it over and clarify it for yourself. I still have to review it, almost every day to try not to make a mistake.

Have a good start to the weekend.
TraderJoe

Thursday, November 22, 2018

Some Trend Lines to Watch

The shorter term 5-minute charts get confusing for some, and others are not so interested in such a short term chart. For those readers, a slightly longer term 2-hour cash S&P500 chart is below. It shows the downward waves we have counted, so far.

S&P500 Cash Index - 2 Hr - Trend Lines

If there is to be a minute wave ((iii)) lower, it must soon begin to show acceleration lower. If that occurs, prices would stay below the red acceleration line. Acceleration in market analysis means a very similar thing to what it means in physics. In physics it means that more distance is covered in less and less time. In market analysis, it means more price is covered in less & less time, whether upward or downward.

So, this is another example of time analysis in Elliott Wave.

If prices only poke at the bottom, and rebound above the red line, then we must consider the alternate flat for minute ((ii)) to take more time to correct minute wave ((i)). That has not happened yet, and we will only address that alternate if it does.

Meanwhile, prices are currently in the black channel lower, and have again pierced the mid-channel line. Within this downward wave, prices have gapped lower a couple of times, but the gaps have provided nothing definitive yet.

The Elliott Wave Oscillator (EWO) is still mid-range. There isn't a sign of acceleration lower, yet. But there could be.

Bottom line: as long as prices stay below the red line, then the primary count remains minute ((iii)) downward. And, if they return under the mid-channel line, and stay below the mid-channel line, this would be more evidence of a likely minute ((iii)), lower, in progress.

Have a great holiday!
TraderJoe

Wednesday, November 21, 2018

A Flat and a Fade?

Market Outlook: Likely Long Term Top Identified
Market Indexes: Major U.S. Equity Indexes closed higher; DJIA, DJUtil lower
SPX Candle: Higher High, Higher Low, Higher Close - Yin-Yang Candle
FED Posture: Quantitative Tightening (QT)

During today's live market session, we wrote than either a triangle or a Flat wave could be in the making. This would have been the possible wave 4 in yesterday's impulse count lower. Why did we say a flat could be in the making? Have a look at the chart below.


S&P500 Cash Index - 5 Minutes - Possible Flat Fourth Wave

Notice that there are a clear three waves up as a:3. Then, as a b:3 wave, the downward wave reached at least 90% of the previous a:3 wave; in fact it made a marginal new low before exceeding the a:3 high early today. (This is what the waves on the hourly chart needed to do to make a flat- but hasn't gone low enough yet!)

Starting with the b:3 wave low, there were a clear five-waves up including a fourth wave triangle iv before making the vth wave up to c:5. Very, very often such a triangle signals 'the last wave up is dead ahead'. Note how that wave iv triangle alternates well with the sharp wave ii, and takes more time than the wave ii. Near ideal wave relationships in time.

As if on cue, slightly before noon prices started to fade and picked up down-side momentum later in the day. So, the whole up move can be wave 4, as per yesterday's downward count. And the whole down move late in the day looks like an expanding diagonal - and maybe stretching out the first wave lower so there are no eventual degree violations.

If a 5th wave down is made in the next trading sessions, there may be a valid downward impulse - and we will consider the implications of that impulse more fully in subsequent posts.

For now, it's time to enjoy the holidays!
Best to all.
TraderJoe

Tuesday, November 20, 2018

Diagonal Confirmation & Follow-Through

Market Outlook: Likely Long Term Top Identified, Now likely in Minuet (iii), down
Market Indexes: Major U.S. Equity Indexes closed lower;
SPX Candle: Lower High, Lower Low, Lower Close - Trend Candle
FED Posture: Quantitative Tightening (QT)

Yesterday, we wrote about the c Failure wave for a possible minuet wave (ii).  We had showed those who had looked at the post script written about the potential diagonal ending diagonal c wave, and said to confirm it, it must exceed the start of the diagonal in less time than the diagonal took to build. It did that today. The chart is below.


ES E-Mini S&P500 Index Futures - 30 Minute Chart - Ending Diagonal Confimration

The diagonal failure is clearly labeled. Further, you can see that the time of the blue arrow is less than the time of the diagonal. We said yesterday, the overnight waves were part of the diagonal - part of the previous trend. And, we counted the five waves down (shown as i - v, above) to a larger wave, shown as 1/A in this case.

So, the diagonal was confirmed as an ending diagonal, and prices continued to sink. The sideways wave now looks suspiciously likely a triangle, and 'could be' a B wave. If so, it is part of an A,B,C down wave for a wave of the larger flat we discussed over the weekend (see the post at this LINK). If not, it is part of an impulse lower.

Price has not exceeded the upper channel line yet. Price is now 100 points lower than when I suggested the c wave up might have ended. This is in distinct contrast to another site that said that they were expecting prices to hit 2,815 or possibly 2,880. <Gulp>. Wrong again at another significant turning point.

Whether minuet (iii) of minute ((iii)) is forming, or the larger flat is forming will be determined in the next couple of days. Right now, as best I can tell, price is not yet at the 90% level needed for the flat.

For now, as long as price remains in the channel, lower, or breaches it only by a partial bar, then one should still consider prices may be headed lower. If they break the resistance of the upper channel line by two full bars or more, then an up trend may be resuming.

Have a good start to your evening, and a good holiday.
TraderJoe

Monday, November 19, 2018

c Failure

Market Outlook: Likely Long Term Top Identified, Now likely in Minuet (iii), down
Market Indexes: Major U.S. Equity Indexes closed lower; DJUtil Higher
SPX Candle: Lower High, Lower Low, Lower Close - Red Marubozu
FED Posture: Quantitative Tightening (QT)

Sorry for the late post. The holidays approach, and I won't be posting anywhere near as much, or as timely, or responding to comments as frequently.

Today was an excellent example of how the contracting diagonal we showed on the ES chart likely ended the upward c wave of minuet (ii) wave on the hourly chart. Nearly to a person, with a few notable exceptions that are catching on, almost everyone wanted that wave to have more time, or to have more price upward. Those that saw the very long b wave down know that in such a case, the upward c wave can fail. Fail it did, and down it went.

When one looks at the daily chart, the candle pattern that is seen is that of a Red Marubozu candle. Often, and not always, such a candle is a continuation pattern, and not an ending pattern. For that reason, and because of degree labeling, the count that applies best is this one.


S&P500 Cash Index - 5 Minute Chart - Red Marubozu

The 'Prior wave' at the top that looks so tempting as 1-2 (with the whole down wave as 3) is likely the failure wave. You will note that the wave from ~12:30 to 14:00 did not break the low of the prior fourth wave in less time than the wave from 09:30 on the 16th to the high at ~13:00 took to build. Therefore, that down wave from ~12:30 to 14:00 would be very, very suspicious as the first wave of the down count, even though that's it what it might look like to one's eye. But that down wave also did not even break the trend line of the prior waves - making it even more suspicious as a first wave lower.

Notice in this count that wave ((5)) is shorter than wave ((3)) which is shorter than wave ((1)), and wave ((4)) took more time and alternates in shape with wave ((2)) - which is the usual order of business. Wave ((4)) is a Flat, and wave ((2)) is a Sharp. Further, there are no degree violations in this count, which is very, very difficult to say if the waves from 12:30 - 14:00 are counted as a 1-2. That count would seem to introduce degree violations. The gap is a sub-wave iii of the wave ((1)).

The hourly count remains the same at this time.

Have a good start to the evening,
TraderJoe


Saturday, November 17, 2018

To The FlatLanders and Double Ziggers

This is going to be a relatively short post. In the world of Elliott Wave analysis, one sees a lot of counts that just don't make sense. People argue without thinking or measuring or much 'in-depth' investigation. They post some letters and numbers and call it a count. So let's address two recent counts I have seen.

The first one is for the FlatLanders. You know these people. They think the Earth is flat. No, I'm just kidding. But, they think the "three waves up" since 29 Oct, were the three waves of a FLAT wave, presumably as A:3,  and the recent action down counts as a "double zigzag", presumably B:3 wave, and then there will be a C:5 wave up - just in time for the holidays.

But, as the first chart below shows, there is a huge problem with that scenario. The chart is so wrong at this time I won't even put my name on it.

S&P500 Cash Index - Hourly - FLAT? No, Not Yet

According to the published RULE for flat waves, if a-b-c up is to A:3 of a FLAT, then the B:3 wave down must obtain the 90% level. This is a hard and fast rule. I can't change it. It is published. If you don't agree with this rule, you are not doing Elliott Wave Analysis - plain and simple. You are doing something else.

IF the market obtains the 90% level, only THEN will I go along and say, "ah, yes, that FLAT is now a good possibility." But, we are not there yet, and that is one reason I have turned more negative on this market. But, those who claim a flat has already been made, by the supposed downward double zigzag wave as it is below, are just plain incorrect by the rules. As happy readers of this blog, I don't want them to be incorrect. It's just the rules.

Now, let's address that supposed double-zigzag. Again, another chart I won't even put my name on. This one is the S&P500 15-minute cash chart.

S&P500 Cash Index - 15 Minutes - Likely Incorrect DZZ

There are some people who have looked at this wave in a channel and said, "It's a perfect Y = W", double-zigzag. But there are three huge problems with that count.

  1. At the W location, there is no fifth wave of a 'c' wave down for W.  Yes, you can try to finagle one, or wrestle one into the count, but otherwise it is simply not there.
  2. "Ah", the critics say, "just move that W down to the lower waves after the 13th Nov." If you do that, you lose the Y = W relationship you just had claimed. As Sheldon says, "Bazinga!".
  3. Short & simple: X does NOT overlap the 'a' wave of W.
On page 77 of the Elliott Wave Principle, the instructions say that any impulse wave can be construed as a series of A-B-a-b-c, but to do so is specifically incorrect counting. It goes on to say that if the fourth wave (in my impulse count downward) does not overlap, it should be counted as an impulse. Elliott himself said, "count like an impulse when possible".

For these three reasons, the double zigzag downward count is among the least likely possibilities, and that is whether it is attempted to be counted as a B:3 or an X wave. Much, much, much less likely. Not impossible, just way, way down on the list.

And if you are counting the upward wave from the low, as a double zigzag because of the poor momentum, then, the same mistake is being made again. Currently it is a non-overlapping impulse wave in cash, likely a 'c' wave of (ii). And, we showed how it can be a diagonal wave in futures. Will such a diagonal end the move? Only time will tell. If it's an ending diagonal, it must break the low in less time than it took the diagonal to build.

Staying with the rules and guidelines, this weekend, and always.
TraderJoe


Friday, November 16, 2018

Even Shorter Post Today

Market Outlook: Likely Long Term Top Identified, Now likely in Minuet (ii), up
Market Indexes: Major U.S. Equity Indexes closed higher; NAS/NDX, DJTrans lower
SPX Candle: Higher High, Lower Low, Higher Close - Bullish White Soldier
FED Posture: Quantitative Tightening (QT)

Here is the hourly chart. The minimum objective for a c wave of minuet (ii) has been reached. Because of the length of the b wave, this upward wave can fail. It doesn't have to, but it can.

S&P500 Cash Index - Hourly - Minimum for c of (ii) Obtained


There could be one more up wave beginning early Monday. But this is absolutely not required. If there is, it is because there is one more wave to finish in a diagonal upward, to finish the c wave. If you have questions about this count please see the chart that was added as a post script (P.S.) to yesterday's post. If you wish to know more about how the count developed in real time, please read all of yesterday's comments. We followed all the rules and guidelines, as well as the degree considerations, and the contracting diagonal was the result.

Will it be a leading or an ending diagonal? Apart from it's 3-3-3-3-3 structure, there is only one way to tell that I know of.

Thanks and have a good start to your weekend,
TraderJoe

Thursday, November 15, 2018

Short Post Today

Market Outlook: Likely Long Term Top Identified, Now likely in Minuet (ii), up
Market Indexes: Major U.S. Equity Indexes closed higher; DJUtil lower
SPX Candle: Higher High, Lower Low, Higher Close - Bullish White Soldier
FED Posture: Quantitative Tightening (QT)

The morning started with a new lower low. That was OK, as we said not to start upward counting until the a wave was exceeded higher. Early in the morning, near the new low of 2672 after downwardly filling the gap shown by the black circle - which I warned yesterday could be filled, I stated it could still be the b wave down. Apparently, it was as the market began tacking on 15 and 20 points, upward, at a time.

So that things don't get too confusing, here is the same ole hourly chart first, so you can see that it is still the c wave up of minuet (ii) we are in.


S&P500 Cash Index - Hourly - Minuet (ii) Up Likely

Again, the count is based on measurements, and the EWO is now clearly green, rising and headed upward. I have no more to say today, other than if you are interested in how I made the projection in real time in the chart below based on degree labeling, then please read my comments from yesterday beginning at 14:45 EST, or 02:45 pm.


ES E-Mini S&P500 Index Futures - 15-Minutes - Flat Projection

The bottom line is, as you can see from the Fibonacci ruler, at the location of ((B)), a wave i sub-wave would have become longer in price than wave 1, which is not allowed. 

Therefore, it stood to reason that the last waves at the top were part of a FLAT, and, specifically, the ((B)) wave of a flat, and that a strong ((C)) wave down would follow. Which they did - projected ahead of time - although I used cash and not futures for the measurement. From 2,737 the market declined to 2,712; a 25 point decline and it provided a warning to commenters - ahead of time. The down wave came right on schedule. Wave ii had to main 18 points net distance traveled, and it did! I would expect wave 3, up to become a 1.618 extension.

That is the benefit of understanding degree labeling as best as possible. I am still learning about it. I hope you are too.

And I hope it helps. 

In subsequent days and weeks as the holiday's approach I am going to be reducing my frequency of commenting during the days and evenings. Again, my only intention is for you is to learn how to use these techniques, not to be performing continual real time analyses. I hope today's intraday chart demonstrates a bit of how to go about it.

Have a good evening.
TraderJoe

P.S. ES futures count of a diagonal (with overlap at the wave ((2)) low is posted below. Such a diagonal could be finished or it may go to 2,753 MAX.

ES E-Mini S&P 500 Futures - 15 Minutes - Potential Contracting Diagonal

Wednesday, November 14, 2018

Today Changes Things a Tad

Market Outlook: Likely Long Term Top Identified, Now likely in Minuet (ii), up
Market Indexes: Major U.S. Equity Indexes closed lower
SPX Candle: Lower High, Lower Low, Lower Close - Trend Candle
FED Posture: Quantitative Tightening (QT)

Yesterday, we counted five waves down to a ((5)) = ((1)). That is not what's changing. Today, there was a brief three waves up, that crossed up over the upper channel down trend line, from the fifteen minute chart, shown yesterday, and then lower lows that did not, as yet, fill a gap on the hourly S&P500 chart shown below. From a time standpoint, that three waves up early this morning was simply too brief to be a whole correction. So, we called it an a wave up. Then there a down wave that appeared as a "three" which we called a b wave. Without filling the hourly gap, the market sported quite the rally, upwardly overlapped wave (i) down, again, and then gave a bunch of it back in the last hour.

Not to worry, we again advised readers on line and commenters, not to begin upward wave counts until or unless the prior wave ((4)) high was exceeded. It wasn't.

The problem was this: the lower lows of today, even if they are the lower b wave of a FLAT for a minuet second wave have bearish implications. I don't want them too. That's how they work.

Further today I was able to find a 38% Fibonacci ratio, in time, to the prior up wave sequence, that I counted as ((A)), ((B)), ((C)), up, for you in near real time, which makes it just long enough for the minute ((ii)) wave in terms of time. The lower lows for today ruled out many of the possible patterns that could have been considered yesterday. So, if you look along the top of the chart, you will see a timeline which provides 38.2% to the high, versus the length of the previous entire minute ((i)) diagonal down.

S&P500 Cash Index - Hourly - Minute ((ii)) Confirmation

Because the up wave as minute ((ii)) is 38.2% as long as the diagonal (see the 38.2% flag at the upper right), and because it made a near exact 62% retracement, it can be a valid second wave. We have fallen well out of the up channel for minute ((ii)), the minuet (b) wave of minute ((ii)) is broken lower, AND the EWO is currently making new hourly lows.

That likely means that after minuet (ii) completes upward, if it does, that a strong minuet wave (iii) will occur downwards. The target for minuet (ii) would be the prior wave iv. Again, there is no upward counting unless today's a wave high is exceeded.

Today, the only difference in the hourly chart above is I have changed the degree labels from what I used when working quickly to their actual Elliott Wave degrees as best I can tell at this point. Overall, I would expect the five minute waves ((i)) through ((v)) to add up to a Minor 1, or Minor A that will break the February and April, 2018 lows in the S&P500 and the Dow.

I know a lot of people were asking why the October low 'couldn't have just been the C wave of a running flat fourth wave'. This is more evidence why. It certainly doesn't have the beginnings of a look of 'five waves up'. Just the opposite. So, I hope the explanation I provided earlier at this LINK made sense to you.

Be careful out there, and have a good evening.
TraderJoe

Tuesday, November 13, 2018

Lower Lows

Market Outlook: Likely Long Term Top Identified, Now likely in Minute ((ii)), up
Market Indexes: Major U.S. Equity Indexes closed lower
SPX Candle: Lower High, Lower Low, Lower Close - Trend Candle
FED Posture: Quantitative Tightening (QT)

Yesterday's three waves down as ((A)), ((B)), ((C)) converted to ((1)), ((2)), ((3)) down, as today there were a lower series of lows. Not to worry, we had warned readers and commenters, not to begin any up count until or unless the high of ((B)), now ((2)), was exceeded higher. It wasn't.

Here is  the S&P500 15-minute cash chart, so you can follow along.

S&P500 Cash Index - Fifteen Minute - Impulse


With the first new low, we were able to rearrange yesterday's potential barrier triangle, to a "running triangle" preserving the proper degree labeling on the chart. This allowed (5) < (3) < (1).

We also gave instructions for re-drawing the potential down trend line from the FLAT wave ((2)) to the new wave ((4)) high that occurred today. As a result, there was excellent alternation with a long in time wave ((2)) flat, and a short in time wave ((4)) sharp. Then, there was another lower low, and it appears to be a fifth wave at approximately ((5)) = ((1)).

Looking at the EWO signature on the 15-minute chart, then currently you have (3) of ((3)) on the low of the EWO, ((3)) on last night's and today's continuing divergence, and ((4)) above the zero line. And now five down ((5)) would be on another divergence.

Sounds like The Eight Fold Path Method to the tee. As of this time ((5)) = ((1)).


The key to the count was uncovering the running triangle or else a) the wave degrees would not have worked out properly, and b) the implications of a "running triangle" with a lower B wave are bearish. And it projected today's lower low.

Prices have not broken 2,700 yet, and there are now several possible counts depending on whether that is broken or not. We'll have to simply reserve judgement until that does or does not occur. To avoid some questions the biggest possibilities are:

  1. We have seen the top of minute ((ii)); and this is the first impulse down; need to break 2,700 for that.
  2. We have seen only the c wave of a larger ((B)) wave flat, and (c) of minute ((ii)) up is yet to come; need to hold above 2700 for that.
  3. A retracement occurs and fails, and we go back to the 2,600 lows as a FLAT. Then a final (c) wave up of minute ((ii)).
Those are very hard to sort out at this time. Additional waves are needed.

Have good evening,
TraderJoe


Monday, November 12, 2018

((C)) wave Down to 78% Retrace ??

Market Outlook: Likely Long Term Top Identified, Now likely in Minute ((ii)), up
Market Indexes: Major U.S. Equity Indexes closed lower
SPX Candle: Lower High, Lower Low, Lower Close - Trend Candle
FED Posture: Quantitative Tightening (QT)

Saturday, we said that based on degree labeling, that the most likely course of prices today was lower for a ((C)) wave. Others disagreed. There were some fake-out waves higher in the futures, overnight, but the market opened lower with a solid gap, lower. Prices declined and kept on declining. Typical of a ((C)) wave.

As an impulse ((C)) wave, lower, this would be the only count at present that makes sense. There is no upward overlap between the high of the triangle and wave (1) down.

S&P500 Cash Index - Fifteen Minutes - C Wave lower?

The only way the count works from a degree labeling standpoint is if there is a "barrier triangle" at the end of the day. Otherwise wave (5) of ((C)) is too long in price. Remember, in a barrier triangle prices bang along the lower barrier, but they don't close lower than the barrier. That IS what we see, above, and the purpose of the triangle is to "better equalize the net distances traveled between wave (2) and waves (4)". This one does that quite well.

Prices briefly breached the 78% retrace, but then they held there for the close.

The downward price structure is just awful, which is what makes me think it is a ((C)) wave. And, the triangle might be signalling that we've seen the last wave. The day ended on a divergence with the Elliott Wave Oscillator.

I will not start an upward count until price should regain the upper declining tend channel line shown above. So far, the degree labeling considerations have been predictive. With "five waves down" today, there should at least be three-waves up, next. And, there could be more. But that remains to be seen.

For a continuing count of an upward contracting diagonal (c) wave of minute ((ii)), in no case can price trade below the prior low at 2,700. That would invalidate a diagonal.

Have a good start to the week.
TraderJoe

Sunday, November 11, 2018

Diagonal Degrees and the Avoidance of Conflict

If you did not read the Friday or Saturday posts and comments, you should. There is a lot of information there. Today, though, we want to talk about a topic that you do need to know about and one that will help clarify a lot of things about wave counting for you. That topic is "how do diagonals avoid degree conflicts?".

Don't worry. We're going to make it short simple and take it step-by-step so it is worth the read. So let's begin.

In order to make this as simple as possible, we will start with the case of the contracting diagonal first, with reference to the diagram, below.

Contracting Diagonal - No Inherent Degree Conflicts

If what we mean by the term 'lower degree' is that the next sub-wave after a higher degree wave has completed must be shorter in price and time than the previous wave of the higher degree, then we can see that a contracting diagonal inherently avoids a degree conflict.  Why?

So, since wave (iii) is shorter overall than wave (i), then we know by logic that wave a, within wave (iii) must also be shorter than (i). This is provided that wave (ii) is shorter than (i) – which it must be if it is a second wave.

Let's be clear. Wave a does not have to be shorter than the first 'a' within (i), it just has to be shorter than wave (i), overall. Wave (i) is the higher degree wave. Wave a is what we are calling the first lower degree sub-wave after wave (i). And so, the same occurs within wave (v). And, since wave (v) is shorter than (iii), then all of the same considerations apply, and inherently degree conflicts are avoided.

It should now also be clear why contracting diagonals usually, almost always, also contract in time, too. That is because the sub-waves must be shorter in each section. In fact, I contend that “counting bars” can be an effective way to determine whether one is in a contracting diagonal or not. If the next sub-wave gets “too long in time”, then one most likely will not be in a contracting diagonal.

The time considerations of degree violations also help determine why wave (v) is always shorter than wave (iii) in a contracting diagonal. Most people tend to think of it as, “wave (iii) can never be the shortest wave”. And that is true, too. But, in fact, if wave (v) is adhering to time degree considerations, then it should also not be longer in time than wave (iii), either.

Now, let's move on to the somewhat more diabolical Expanding Diagonal. In the case of the Expanding Diagonal, we expect wave (iii) to be longer in price and time than wave (i). But serious Elliott Wave students want to know, “just how does this happen without degree violation?!”.


Avoiding Degree Conflicts in an Expanding Diagonal

So let's assume we have made first wave down, (i). This wave (i) establishes the “Field of Play” as it were. Then, the first sub-wave a of the next wave must be shorter only than wave (i). It does not need to be shorter than wave 'a', of wave (i) – just shorter than (i).

So now follow this logic. Since, wave a can be almost as long as (i), then if you put two of them together in an a-b-c wave, then the whole wave can be longer than wave (i), particularly if there is a shorter b wave in the middle. And now the wave (iii) can be longer in price & time than wave (i) without degree violation! And, it is OK for wave (iii) to be longer than wave (i), as they are the same degree wave, and that is the usual course of events – to have the third wave longer than the first wave in a sequence.

Again, the only restriction is that the sub-waves of (iii) are shorter in price and time than all of wave (i). Well, the same thing occurs for wave (v), except now it is wave (iii) that has become the 'longest wave on the board' and it sets the new “Field of Play” as it were. Then the sub-waves of wave (v) must only now be shorter in price and time than all of (iii).

The next consideration is wave (iv). Keep in mind there is no Elliott Wave rule that says a wave four can not be longer in price than a second wave. And as long as the sub-waves in wave (iv) are shorter in price and time than all of wave (ii), then wave (iv) is going to take full advantage of the lack of a rule regarding fourth wave price and travel as far as it can - provided it does not travel beyond the end of wave (ii). That, of course, is something no fourth wave is allowed to do, by rule!

When you consider time and price degree like this, you can also answer for yourself, “what is the maximum extent of travel” of wave (v) in an Expanding Diagonal?

And, if you have ever seen an Expanding Diagonal in real time, you know that the last upward move can be especially aggressive in an Up market, and the last downward swoosh can be quite devastating in a Down market. How far will the move go? A person caught trapped in such a wave might have a vital interest in knowing.

Well, it should be clear by now that wave (v) can not proceed farther in time than it's c wave would become longer in time than all of wave (iii)! That may not be much consolation if money is lost – but at least it is a LIMIT that would otherwise be undefined. Otherwise, how do you know? And you know, the c wave – wherever it starts is limited to the maximum price travel of wave (iii), too!

Now the above example was for a 3-3-3-3-3 diagonal. By extension, the serious Elliott Wave student should undertake specifying the limits of travel of the various sub-waves of a 5-3-5-3-5 diagonal, as well. We think if you will do that it will also crystallize for you the concept of degree violations in impulses, too. 

Does this make sense? We hope so. After reviewing this article, you may be able to answer more questions about price and time than many professional Elliott analysts can. More importantly, we hope it makes your wave counting that much more accurate.

Have a good start to your Sunday.
TraderJoe