Friday, October 30, 2020

Failure Wave Turns Bullish into the Close

Today, the last trading day of the month, we were following this potential ending diagonal as the futures first traded significantly lower overnight, and then began what seems to be the continual intraday grind.


We cautioned that people should be very careful with this pattern, and when price was below 3,250 at 3,240, we said that a wave ((4)) at 3,250 was possible, but that it was the max. If that price (3,250) was exceeded higher, it could mean that the low was on the prior low. That is how it turned out. Prices shot up into the close as another reader (Tjchuck) had reminded all, that the first of the month - with expected possible inflows - was just around the corned. The result can be seen above.

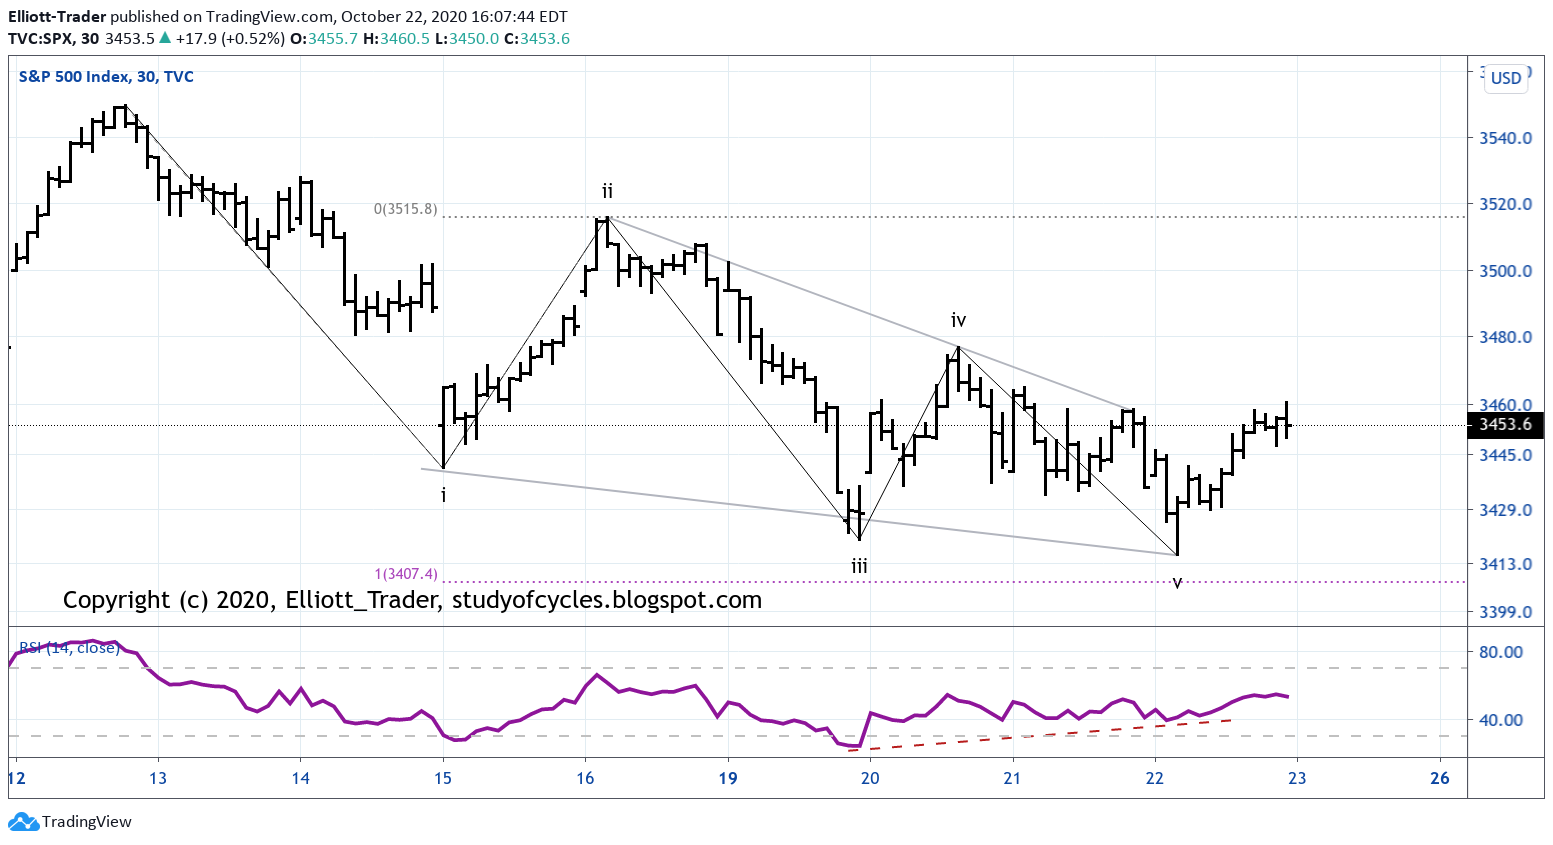
With about 183 candles on the S&P500 30-minute cash chart, the failure gives us one way to count the five-waves-down into a minute ((i)) wave as follows.

SPX Cash - 30 Minute - Minimum Minute ((i))
 

The failure would have ended only the fifth wave of wave (v) - which is not outrageous for a truncation. The wave itself would not have failed to make a lower low that minuet wave (iii).

But, there is another wave to consider the failure, as well, and that is a part of a running triangle for a wave (iv) still in progress. This might make some sense given the looming election scenario. So, I'll show that with fewer bars on the hourly chart, as below.

SPX Cash - 30 Minute - Larger Minute ((i))

This second pattern might provide better alternation between waves (ii) and (iv), so it really is hard to rule it out at this point.

And again, with the election immediately ahead it is best to be patient, calm and flexible at this time. 

Have a good start to the evening.

TraderJoe


Thursday, October 29, 2020

Ugly Stuff

Ugly waves in the ES futures, intraday chart, today. Per the comments in yesterday's post, we are looking for a fourth wave (iv). Here's how today's intraday ES chart counts.

ES Futures - 5 Min - Ugly

There is a .c = 1.5 x .a wave resulting from the thrust out of a running triangle. The downward wave after the cash close came nearly down to the 0.786 retracement before trading ended. There might be a triangle, running triangle, or double-zigzag in progress in this index.

Whereas the ES made a new low today, the NQ futures did not. The Dow Jones Futures (YM) also made the new low, and have already beaten their Minor A wave down. For this reason, we will be be on the look-out to see if the Minor A wave down can also be a Minor 1 wave down, but I have more work to do on that one.

Have a good start to the evening.

TraderJoe

Wednesday, October 28, 2020

Third Wave, As Expected

No change to the overall daily count. Still expecting prices to parallel (or make a larger Flat) with the parallel option shown below.

ES Futures - Daily - Likely C of (X)


Early this morning, we noted the advance-decline statistics were greater than 1-to-10 to in favor of declining issues. That ratio held through the close of the session, so it appears to be a "kick-off" wave lower. For the Flat option, prices would re-test the lows in some fashion.

Have a good start to your evening.

TraderJoe

Tuesday, October 27, 2020

Split Decision

Stocks as measured by the Dow Jones Industrial Average, and SP500 cash index had a down day. The NASDAQ Composite had an up day. The ES futures opened higher at the outset as expected from yesterday's post and comments. They did not exceed the 3,416 level which keep the possibility of the i, ii, ((1)), ((2)) setup, downward, on the table.

The updated chart of the ES 4-Hr futures is below.

ES Futures - 4 Hr - Micro ((2)) ?


While today was a down day, the advance decline line was only about 1-to-2 in favor declines, and, by the futures settle, it was still an inside day. 

The market re-tested the daily pivot point (PP) using the classic calculation and round-number resistance at the 3,400 level about seven-to-nine times today, depending on how you want to count it, but could not make it through 3,410, and then made a series of lower highs and lower lows.

This is a very heavy earnings week, so things can still get volatile. speaking-of-which the VIX had a locally higher high, and higher close today.

Have a good start to the evening.

TraderJoe

Monday, October 26, 2020

Stocks Falter

We showed the possible reversal from "three-waves-up" on the weekend diagram of "Waves you can not see yet." Futures gapped down Sunday night and kept on going for much of the day. They turned up slightly in the afternoon. At the end of the day, a preliminary advance-to-decline ratio was about 1-to-6.9, which is starting to get into the more impulsive region.

As a result, it is possible there is a good set-up for a i, ii, ((1)), ((2)) wave downward. See the ES 4-Hr chart below.

ES Futures - 4 Hr - Channel

Prices this morning stabbed through the lower channel boundary that you see - which is also a very similar location to the up trend line from the 23 March lows. Then, they rebounded a bit. With the lower daily lows, today did confirm that the expanding diagonal in futures that we labeled in near-real-time, wave-for-wave, was in fact a Leading Diagonal. It is followed by a Flat wave (with an internal lower low) in the futures. The cash market counts a little differently with the contracting diagonal, down, followed by three-waves-up.

Today, in the cash market we counted five-waves-down and posted the same when we had done so.

By the principles of degree labeling, if the market is to make a valid  i, ii, ((1)), ((2)) sequence lower, then wave ((2)) should not cross the 3,416 level in the futures, as shown by the Fibonacci ruler above. Otherwise, there is something else going on. In other words, smaller degree wave ((2)) - micro degree - should not become longer in price or time than sub-minuette degree wave ii

P.S. With five-waves down today, following the diagonal and flat retrace wave, the alternate for this count has to be a-b-c, down.

Let's see how it goes.

Have a good start to your evening.

TraderJoe

Saturday, October 24, 2020

EW Uncertainty

Here are some more thoughts to consider this weekend. Yesterday we showed a tentative channel, and only three-waves-up. This makes the local situation the most unclear it could be from an Elliott Wave perspective. That's why the most recent terminal points upward are currently labeled as a/i, b/ii..

Please consider that the future is currently invisible to us all. (If you know someone who says they can see it, please provide the reference). And, in that regard we should consider the Elliott Wave patterns that we 'can not yet currently see'.  For that reason, I have just made a little diagram, as below. The solid lines are the ones 'baked in the market'. The dotted ones are possible.


In the first diagram, if upward prices start with a big gap up on Sunday night, then a zigzag is possible, particularly if prices stop at the arrow and then reverse lower to overlap the first wave a/i, up. And, then, is a multiple zigzag possible?! Yes! But, with the same gap up, prices could continue on to form an impulse.

Still more insidious, prices could only travel over the high marginally, and begin to form a diagonal. 

But, supposing there is no gap up on Sunday night. What if the up wave needs to be corrected by a wave that takes more time? Then, even a flat is possible.

And, lastly, depending on circumstances, there are three waves up - and maybe a potential failure. Prices could reverse and head lower.

Yes, one can offer the trader's maxim, "the trend is your friend until it isn't", and maybe even "support at 3,440 holds until it doesn't", or even "Price is over the daily 18-day SMA, so the bias is likely up". But even those don't express the full range of possibilities. Not even Bill Williams' fractal breaks can provide assurance of follow-through prices higher or lower here.

Next, we can see from this daily chart of the ES futures that this week prices have bounced up off the trend line from the low.


What this tells us is, "the trend line is recognized", and the next most significant piece of information is whether this daily trend line is exceeded lower and back-tested higher with a subsequent failure swing lower OR whether prices exceed the September high, first. This doesn't have to occur this week. It could, but there are ways to stall it.

So, this is a time not to have the blinders on, and to see how things progress. It is a time for patience, calm and flexibility as the market maneuvers it's way to the next price levels.

Have an excellent rest of the weekend. This is the second post this weekend, and if you have not seen the first one yet, you may wish to review it.

TraderJoe

Friday, October 23, 2020

Mixed

The Dow cash was lower, the S&P higher. A continued chart is below. Last night made a higher further high as a fifth wave up extended somewhat, as we said it might in yesterday's post.


Prices then headed lower for the morning, making a retrace wave of 62% or more, then turned higher, and neither cash nor futures settled over the highs of their prior morning prices. The wave count in cash, above, has only three-waves-up from the low at the close. There is now a tentative up channel, which is to be respected until full candles close down outside of the lower channel boundary.

Have a good start to the evening.

TraderJoe

Thursday, October 22, 2020

Diagonals of Two Types

In Tuesday's post, we showed the expanding diagonal potential in the ES futures contract. (That chart appears here at this LINK.)  Today, because of lower lows in both the futures and the cash, the S&P500 cash index 30-minutes can now be counted as a diagonal, too. This diagonal is of the contracting variety, and not the expanding variety like the futures.

S&P500 Cash Index - 30 Minutes - Contracting Diagonal


In the cash market, above, price has already broken the upper declining diagonal trend line and made five waves up. In the futures market, the upper declining diagonal trend line has not yet been broken. It could be.

Further, while we counted five waves up in cash since the morning low, it is possible the fifth wave can extend - if it wants to - perhaps in the overnight.

Can these patterns send price waves over the top? They can; it is possible if they are ending diagonals and not leading ones. The expanding diagonal in the futures market seems to suggest that the diagonal was leading, with a flat wave following it. The timing was quite accurate. So maybe it will simply make a deeper retrace to break that declining trend line, and then head lower to make new lows. These are difficult patterns to deal with - understanding them is really advanced in Elliott Wave theory. So, we must be patient and just count what we see.

There are some who might pose that such a diagonal might just represent an ending wave of a non-overlapping fourth wave up from the 24 September low, kind of like the following.

SPX - 2 Hr - Hypothetical

The question that needs to be asked in that case is whether or not the wave would represent a degree violation because the internal waves of the diagonal look larger than all of minute ((ii)). So, while I think so, I am still learning on this topic. And I hope you are, too.

Have a good start to the evening.

TraderJoe

Wednesday, October 21, 2020

Sideways Consolidation Continues

After the three-waves up noted yesterday in the comments section, price continued to move sideways without breaking the highs or the lows on the ES 4-Hr chart.


There are ways the correction can continue - such as a Flat, Double-Zigzag, or combination wave. Price back-tested the underside of the channel once; it can do so again if it wants. Price has not contacted the blue moving average yet (VWAP), but can do so. Yes, a full triangle is another possibility here, but they are a bit more rare than the first two types of correction. A combination with a triangle would indicate significant market weakness ahead.

So, we are patient, calm and flexible until we see more.

Have a good start to the evening.

TraderJoe

Tuesday, October 20, 2020

Stimulus Stalemate

In the NQ daily and ES daily futures, today was an inside day that settled near the low of the range. For consistency, the ES daily futures are shown below.


With about 120 candles in the hourly pattern, the Elliott Wave Oscillator showed the expected widening pattern to match with the expanding diagonal.

As expected, the upward correction began, and prices crossed the 38.2% Fibonacci level in three waves. Yes, the correction could be over. The minimum wave length has been fulfilled and the EWO has crossed the zero line back to the up side. However, if the upward move wants to continue, it can easily do so as a Flat, if price goes down to the 90% level, and then upward to cross the ((C)) wave shown. Or, barring a 90% downward retrace, price can continue the correction in an upward multiple zigzag.

It is interesting that the stock futures settled a tad lower while the cash market is touted as closing higher.

Have a good start to the evening.

TraderJoe

Monday, October 19, 2020

Qualified Diagonal Down

By forming a longer vth wave than the iiird wave shown in the prior blog post, the market made a qualified diagonal downward. The longer vth wave is shown by the Fibonacci ruler in the ES 4-Hr chart below.

ES Futures - 4 Hr - Qualified Diagonal

Price made a new low beneath wave iii, but did not reach the moving average shown (VWAP) as of yet. It did, however, overlap the highest part of the prior ((x)) wave shown.

The reason the diagonal is qualified is that it has met all of the requirements of an expanding diagonal. However, whether such a diagonal is a leading or ending diagonal can only be determined by whether price makes a new lower low before it crosses back over the high of wave Minor B. These are 4-Hr candles, so it could be quite a while before we know for sure.

IF the diagonal is leading, then it counts as minuet (i), or alternatively minuet (a). So, an upward wave, tentatively labeled as minuet ((ii)) could begin at any time. If and when it does, it can back-test the lower channel on the above 4-hr chart for a while. Often - not always - such waves break the upper diagonal trend line and wind up in the territory of the prior wave ii, or wave iv. Remember that Tuesday is often (not always) a turn-around day. So, if Monday was a fair-sized down day, then Tuesday might be expected to be an up day.

As of the close of trading, the daily slow stochastic had lost it's embedded reading as shown in the daily chart, below. The only day it can get it back is tomorrow. Price tried to reach for the 18-day SMA (or line in the sand) but couldn't quite make it today.


From what I have seen and learned so far, there is no 'time limit' on price and the 18-day SMA trying to come together. It could take a couple of days, or it could take less time, but that is the eventual expectation. At the end of the day, the advance-decline ratio was about 1: 2.7 which is only mildly in the impulsive category.

Have a good start to your evening.

TraderJoe

Sunday, October 18, 2020

Tentative Count Downwards

It's not for certain yet, but if prices do make a run for the moving average shown (which is the VWAP or Volume-Weighted Average Price from the low), then a count like this seems to make the most sense and provide tentative degree labels.

ES Futures - 4 Hr - Tentative Count
 

In this tentative count, wave v should become longer in price and time than wave iii and this would likely bring price down to the VWAP, and/or slightly beyond. The reason the count is still tentative is that diagonals are relatively low probability patterns that must prove themselves out in every detail.

This is still expected to be quite a whippy count, and the eventual retrace - if the pattern occurs - allows for variation in the depth of the retrace. Further, we do not know, if the first five waves down will be (i) or (a). And if it is (a) it could be part of an even larger diagonal, so we must take it a step at a time.

Have a good rest of the weekend.

TraderJoe


Tuesday, October 13, 2020

Back in The B-Band

Yesterday, we said the probability of staying over the upper Bollinger Band today had roughly dropped to 3 - 4%. Today closed back inside of the band.

ES Futures - 1 Day - Back inside the Upper Band

If price continues to drop, this could be an excellent location for the Minor B wave. A good sign of confirmation would be trading below the local up trend line - shown - from A to minute ((b)).  One issue is that the daily slow stochastic is likely embedded. So, another good sign of confirmation would be the red line of the slow stochastic trading back under the 80 level.

Have a good start to your evening.

TraderJoe

Monday, October 12, 2020

Crash, Where?

Most of the pundits on YouTube, a large Elliott Wave service, and many, many websites have been predicting a crash - with uncertain or awful timing for several weeks. This website resisted the temptation to play with emotions. The recent daily chart of the ES futures is below.

ES Futures - Daily - Deep Retrace

As you can see, they, the pundits, plainly forgot the "crash up", before the "crash down" if there is to be one. Staying very neutral and objective, the sole factor that matters from an Elliott Wave perspective is whether a new high is made or not. The downward wave to A counts best as a five-wave diagonal.

As such, diagonals are certainly allowed to have a deep retrace. I've shown the MACD in this chart, because if a new high is made, it is going to be on quite a divergent reading. But, plain and simple, if the wave goes over the former high, it would invalidate the combination of Minor A, down, Minor B, up, with the expectation of a Minor C, down to follow as a zigzag. This is the problem with diagonal waves. Even if they are counted properly, they can still be ending diagonals, and not leading diagonals. And only time will tell.

For the second day, prices closed up over the daily Bollinger Band. So, that is one problem with the up wave from the viewpoint of the wave continuing. It drops the odds to a very rough 3 - 4% that Tuesday/Wednesday will close over the upper band.

A further problem with this up wave is going to be the put-to-call ratio. On Friday it was in the low 0.40's at 0.44. It will be interesting to see what a day like today does to that ratio again and if it drops into the 0.30's. And remember, sometimes - not always - after a large up day on Monday, Tuesday is the day on which prices turn-around.

We shall see. It all sounds good in theory. Let's see how it holds up in practice.

Have a good start to your evening.

TraderJoe


Saturday, October 10, 2020

Elusive Wave

Most Elliott analysts do not like to provide even a hint of the difficulty in their efforts to determine their one true Elliott Wave count: you know - like the one that a major service provides which has almost always been grossly off in its timing. And you know why: if they admit fallibility or indecision - even with alternate counts, they fear their readership will decline. That is one of the benefits of an unpaid blog. We can speak our mind and tell it like we see it. 

With that background, we admit clearly and loudly that the upward wave and it's constant grind is very, very tempting to count as a five wave sequence. If so, this is probably the best way to do it.

ES Futures - 30 Minutes - Impulse Version

But sharp readers of this blog will also note a few things in this chart - which does have a requisite 140 candles on it (from the range of 120 - 160 recommended) and could be counted as an extended first wave. The first and most glaring issue is that in this style count wave (ii) which is the longest retrace in time does not even retrace 23.6% of the first wave! That, in and of itself, should raise more than one eyebrow. But the second thing to note is in regard to the Elliott Wave Oscillator.  For neither the second nor the fourth wave, there is no travel below the zero line. This again seems very unusual but it reflects the lack of retracement also.  Another thing to note are the lack of real long and impulsive wave segments. By that I mean really large upward bars similar to the large downward bars that preceded this entire wave. Thus, the whole wave looks like a grind upwards rather than impulsivity in the futures, even though there are, indeed, gaps in the cash chart.

So, another way to count this very same wave is the following.

ES Futures - 30 Minutes - Corrective Count

As such, the first thing to note is that the (c) wave might not be done yet. There are enough waves for it but the latest peak could also just be iii of (c). So, there could be a further high on Sunday/Monday. In this format, the very small wave retrace would belong to a (b) wave, and the zigzag is corrective.

There are not many times that I have run into a wave this long-lasting with such a small retrace (even given it may be anticipatory of a stimulus deal).

So, all I can say is that I am willing to live & learn and see what lessons this wave has for us. In turns out that both counts can fit in a potential Minor B wave count as follows. First, for the five-wave sequence.

ES Futures - 4 Hr - Five Wave Count Incorporated

And now for the three-wave sequence.

ES Futures - 4 Hr - Three Wave Sequence

Either count has it's good and bad points. Neither breaks the rules. A lot will depend on any retrace waves - if and when they occur - and whether the lower parallel trend line is broken. And so here it's a really excellent strategy not to get too emotionally adhered to a particular variant at the moment.

Have an excellent rest of the weekend.

TraderJoe

Friday, October 9, 2020

Over Upper Band

The after-hours are making it more difficult than ever to get a handle on the wave count. For now, price closed above the daily Bollinger Band - which is 'often' where the so-called Smart Money takes some of their profits off the table. The swing line is up; the bias is up. The daily slow stochastic is over-bought but could embed on Monday.

ES Futures - Daily - Close Over Upper Band

The upward Minor B wave has not yet reached the 78.6% retracement level. It might. Price is positive while over the 18-day SMA and the rising local trend line. There is currently nothing bearish on the chart. True to form, the market ended on bullish notes on Thursday and Friday.

Remember, a downward count does not resume until or unless the low of Minor A is exceeded lower.

Have a good start to the weekend.

TraderJoe

Thursday, October 8, 2020

Tennis Match at 62% Retrace

From the hourly chart of the S&P500 cash index, it looks like the upward wave has reached the 62% retrace level. All day on the ES futures, there was back & forth over and under the intraday 18-period SMA until prices reached the R1 daily pivot point. That coincided closely with the 62% retrace level on cash.

SP500 Cash Index - Hourly - Minor B?

Hourly prices have formed something of an upward channel, but not a good one. Resistance today was also at the midpoint of the upward channel. The upward count is very, very difficult with a couple of different interpretations. (Price never did pierce the upward parallel and so a third wave is not yet indicated.) The Elliott Wave Oscillator is on a divergence and has turned red and declining.

Each upward wave is shorter than the prior wave, but the second minute ((x)) wave is longer than the first. (That rules out a contracting diagonal for those thinking of such.)

So, the best interpretation appears to be that Minor B is in progress or has been completed.

Have a good start to the evening.

TraderJoe

Wednesday, October 7, 2020

Flexible

After yesterday's outside day down to the 18-day SMA, today made an inside day. It has not yet taken out the high of the outside day down on the ES futures, but it did on the Dow cash and the Dow futures..


Yesterday's down bar may have been a "running (c) wave" of some type within Minor B, up, or a smaller degree (x) wave. The daily price bias is still up, the Bollinger Bands are currently headed sideways, and the daily slow stochastic is in over-bought territory. The count is made more difficult by the fact that today's bar can be counted in the futures as a-b-c up with c = a, and only a 23.6% b wave. Or it can be counted as five-waves with a 23.6% second wave. (The former interpretation is preferred unless we go over the high).

All-in-all, a wave count is very messy, and very sloppy as we said would be expected in both a Minor B wave, and an Intermediate (X) wave.

Have a good start to the evening.

TraderJoe

Tuesday, October 6, 2020

Dzz, Then Oops!

Yesterday, we counted the up waves to minuet (b) as a,b,c "so far". The reason we said, "so far", is that "b" waves in general can be quite tricky, and there was no good evidence the upward wave had ended. Today, the up move continued for a while, then "Oops!", the White House tweet indicated that stimulus talks had been called off. The additional sub-divisions upward appeared to be another three-wave sequence making the larger wave w-x-y, upward, inside of the Fibonacci 150% external retracement on the (a) wave down - a measurement which is quite common for (b) waves. See chart below.

ES Futures - 30 Minute - Minuet (b)

With no particular sense of urgency about the health of the populace or the economy, in once again trying to showboat for the election, the President created the downward price spike, above, which broke through the lower boundary of the Elliott parallel trend channel. Of course, we expected that, at some point, a (c) wave lower could occur, and this appears to be the start of it. A retrace of the high should hold for the downward count.

Have a good start to the evening.

TraderJoe

Monday, October 5, 2020

Three-Down, Three-Up "So Far"

If the wave count to the early morning Friday low represented three waves down, as was described in the previous post, then today tentatively represents only three-waves up to prior resistance at the 3,400 level. Here is the ES half-hourly chart.


At the 3,400 level tentative wave c is 0.786 x wave a. This could represent the minuet (b) wave higher of the minute ((b)) wave lower. If so, a minuet (c) wave down could occur in the form of an Expanded Flat. The wave labels are tentative until there is downward overlap on the a wave, and price trades below the b wave. A significant break, lower, of  the most recent upward parallel, and a back-test of it with a subsequent failure low would provide a lot more additional confirmation.

Keep one eye peeled to any stimulus or political news that might alter the landscape.

Have a very good start to the evening and to the week.

TraderJoe

Friday, October 2, 2020

'Minimum' Minute ((b)) : Circle-b

In yesterday's post, it was indicated that a better length for the minute ((b)), or circle-b, wave would be at least 38.2% on the minute ((a)), or circle-a, wave. Today, that occurred as shown in the ES hourly chart below.

ES Futures - 1 Hr - Into Minute ((b))

Overnight, the lower channel boundary was broken, lower, the 38.2% level was attained, and prices in the ES futures spent much of the rest of the day attempting to back-test the lower channel line. The back-test occurred on additional talk of renewed stimulus hopes.

So, we have shown the 'minimum' minute ((B)) wave location on the chart above. It could still grow longer and and form something like a choppy double-zigzag or even triple zigzag lower. It could also form a triangle or a Flat wave. A lot depends on the news. (Note: the NQ futures did make lower lows after the initial overnight low. The ES did not.)

In terms of the shorter-term count, I can legitimately only count three-waves-down on the ES 30-minute futures, as in the chart, below.

ES Futures - 30 Minutes- Three Waves Down


If the down waves count like 'three-waves down', the up waves don't count like anything yet. But notice the topping tails along the upper parallel. There may have been a failure there preventing a full 'c' wave up count. If prices bust the larger upper parallel on Sunday/Monday, and exceed the b wave, then perhaps look for an upward triangle or the (b) wave of a larger Flat. If prices break and back-test the smaller parallel, lower, then perhaps look for a continuation lower like a grinding double zigzag.

Either way it's going to be messy slop as the daily chart has us fighting the famous "battle at the 18-day SMA, the line in the sand".

Have a good start to your evening and to your weekend.

TraderJoe

Thursday, October 1, 2020

Currently Stuck in Neutral for PF

Today made the new slight higher high that was an option from yesterday's post. Most of it was made in the after-hours as a gap in the cash market. In the ES 30-minute chart below, that portion of the wave largely traded above the intraday 18-period SMA. 


Then, after hitting the R1 Daily Pivot (Classic Calculation) shown as the purple dotted line, prices reversed and traded for the rest of the session largely below that 18-PSMA (red). During the middle of the session, we called out an ES 30-min outside candle lower, said it had to be confirmed, which it was, and prices headed further lower. The "shaking of the trees" occurred when stimulus agreements seemed to get farther apart. So far, the high of that particular outside candle has not been exceeded higher. (There was another outside candle four bars latter in the session, but its high was just barely exceeded).

Regardless, tomorrow is payroll Friday and the wave count will likely be affected by the reaction to the number. There are several options for wave counts at this time. We could be in either a triangle for minute ((b)) of the Minor B wave - with the minute ((a)) wave having ending yesterday; we could be in a very long ending diagonal fifth wave of minute ((a)), still; we could be in a Flat wave for the minute ((b)) wave - which can go over the high if it wants; or we could have started a very sloppy larger wave downward which is still not discernible. There is also an outside chance of the fourth wave of minute ((a)) being a triangle, and a higher high in minute ((a)).

In case that's not clear, we are looking for a potential ((b)) wave in an Intermediate (X) wave, and the options for both the ((b)) wave and the (X) wave are almost any "three-wave" correction. So, this would be expected to be the time of most uncertainty. This is a good opportunity to see what the market does with the jobs number, and remember it is Friday. All-in-all I would like to see a deeper correction for wave minute ((b)) - somewhere over 38% of the hourly up wave.

While there definitely were some inflows today - and amounting to the typical 30 points or so, it didn't feel like much. So, some may have been holding some firepower in reserve for either a good payroll number, a stimulus deal, or both.

Have a good start to your evening,

TraderJoe