Saturday, May 30, 2020

The Minute ((b)) Wave, So Far

From the flat for the three-wave minute ((a)) wave in the lower left, you can see that this wave has been traveling upwards in the 'half-channel' provided by the parallel shown. You can see that the count already has a problem with overlap at the red line across (w) labeled with "Already Overlapped".

ES Futures - 2 HR - Half Channel Count

On Friday we discussed that the most recent down wave, currently labeled as the second (x) in the series is longer in nominal length than the whole of the prior (x) wave. We said on Friday that could mean a "turn of degree" was at hand. We also said on Friday that one way to rectify that potential degree violation is with a triangle. I do not know if a triangle will form, but it should be watched for. All it needs to do in Sunday's overnight is for an e wave to travel back down over the (y) wave.

Don't like this count? Well, there is another internal problem I ran into with the time parameter. If you look at the absolute number of bars in (y), you find that it is greater than the number in (w). That means that (y) and (w) 'must' be of the same degree or (y) must be of a larger degree. Further, that means there 'must' be a sub-division within (y) that I have showed as black a, b. I have showed one location for a that is less than the number of bars in (w), but you could also move it down one peak, and b could be another flat within (y).

Again, I don't know if a triangle will form, but if a triangle does form, it also has the potential to be the triangle just before that last wave up. But, let me be clear, a triangle does not have to form. It is possible that the net distance traveled in a flat wave to the current (x) location resolves the degree issue, as the net distance traveled is less than the point drop in the whole of the first (x).

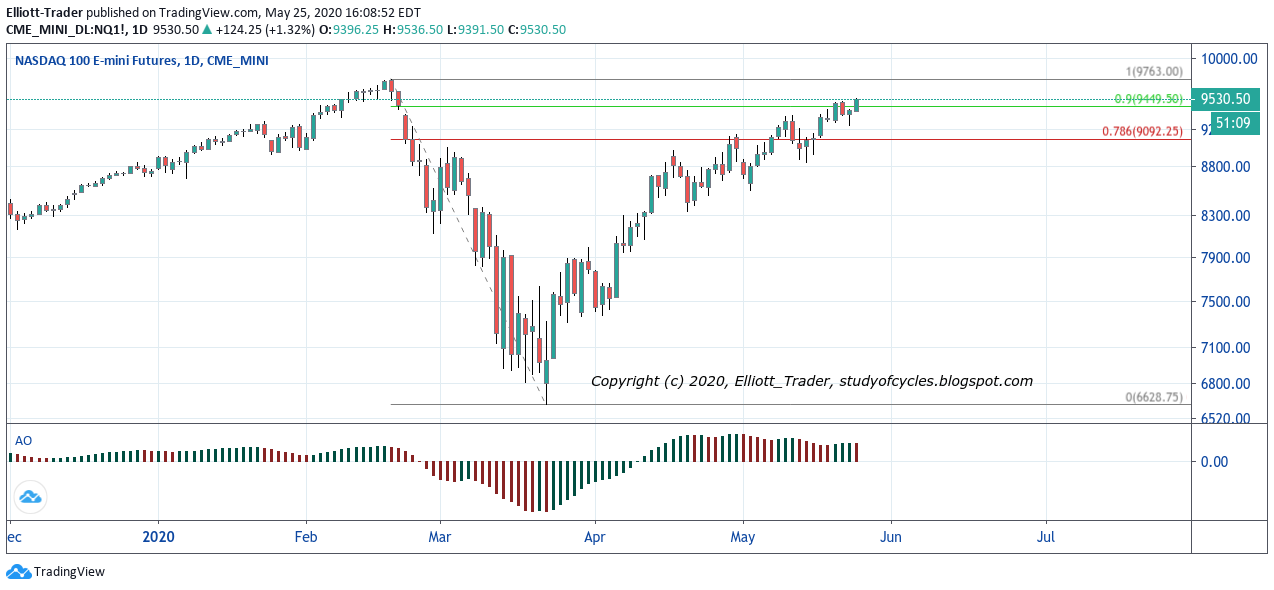
Again, the Elliott Wave Oscillator continues declining and does not look like an impulse signature on this time scale.

Something to chew on over the weekend. Enjoy it. This is the second post this weekend, and if you have not seen it, you may wish to read the first one, also.

TraderJoe

Friday, May 29, 2020

Not Drinking the Cool-Ade Yet

Bottom Line: Three Waves Down Only

(Yes, I know how it is spelled). Today was a whippy day. The market as measured by the ES futures made a new daily low of 2,992. It had little reaction to chair Powell's remarks, but was turned around upwards when the president made his remarks against China but failed to put any teeth into them.

What we did today.
  1. We examined the overnight market and found a way we could count a five-wave sequence downward, and then a three-wave sequence upward.
  2. We labeled the fifteen minute overnight chart with those sequences, ((1)) - ((5)), lower and then ((A)) - ((C)) upward. They are shown in light blue from left-to-right on the chart below.
  3. We also added the day's pivots, as R1, PP, S1, and S2 (classic calculation).
  4. Because of the clear five-wave sequence lower, we expected a lower wave. It occurred. Price found support at the S2 pivot.
  5. Measuring that wave, downward it was longer than either (x) wave in the two hour chart. That meant a "turn-of-degree" is potentially possible - see explanation below.
  6. When the first up wave exceeded the length in price of the first three-wave sequence upward that we had counted, the ((A)) - ((C)) upward, we said the down count could only be a three-wave sequence a-b-c, although it might start a diagonal. 
  7. During the course of the upswing, in the after-hours prices approached the R1 pivot.
Here is the ES fifteen minute chart as of the daily 17:00 PM ET, close.

ES Futures - 15 Minutes - Three Down Five Up

At the end of the day, with both a likely degree change and possibly five-waves up, it turns attention to this count on the daily chart. Yes, this is a slightly different count, but still in a Minor B wave. Remember, at the outset I said the B wave could take almost any three-wave form, including a zigzag, multiple zigzag,  flat, or triangle.

ES Futures - Daily - Triangle B?


I have not categorically ruled out the flat wave, but a large move up Monday/Tuesday would do that as the up wave would become more like a 1.618 wave upward. So, the market would have to prove the flat wave by taking out the minute ((a)) wave, low, and so far it has not done that yet.

Please remember that price is still over the 18-day SMA, and therefore still has a positive bias, and further the daily slow stochastic remains embedded above the 80 level.

But, with the daily Bollinger Bands overhead, I say I am not drinking the cool-ade yet. That's because a further high on Sunday / Monday - remember Monday is the first new trading day of the month - would put us over the upper Bollinger Band, and price has a low probability of staying there - only about 5% of the time.

And a triangle in this position would make it harder for most analysts to follow, make it much harder for traders to profit, and yet still be in keeping with the usually lighter summer trading volumes.

Have a good start to your evening - and maybe a glass of wine, instead.
TJ

Thursday, May 28, 2020

Possible - Not Certain (3)

The count remains the same, that of a minute ((b)) wave upward. See the daily chart from two days ago for the larger count.

What we did today:
  1. We realized the daily slow stochastic was still embedded, and price still has an upside bias over the 18-day SMA. We also realized from yesterday that price closed over the daily Bollinger Band, and there is only about a 5% chance of that occurring.
  2. We placed a dashed gray line on the chart to show where the upper daily Bollinger Band was located, and the day's pivot points (classic floor-trader calculation).
  3. Then, we looked over the overnight count in the chart below an realized the count made absolutely no sense unless there was a triangle in the middle of the sequence. That triangle is highlighted in blue, below.
  4. Next we realized that yesterday's "blast off" wave, where there is little retrace, is 'usually' an (a) wave up. This is shown as :5 in the chart below. That's why we said yesterday, the count may not be done.
  5. So, given the overnight count of only three clear waves down, including the triangle, we suggested we were making a b-3 wave up, and then should make a flat wave.
ES Futures - 30 Min - Flat Wave

We cautioned all, we did not know if the initial high was the end of the b-3 wave at the Bollinger Band. It wasn't. But, then, we got a doji candle on the R1 (Resistance Level 1 - Floor Trader's pivot). We said that there needed to be a substantial confirming lower close candle, and there was. This was followed by a stronger bearish outside reversal candle, and then the low of the a-3 was exceeded lower, proving out the FLAT wave. A real key to this count was identifying that internal triangle. I know people hate diagonals and triangles. Learn to find them, and they can actually help your confidence at labeling waves.

This kind of whippy action represents a market that is getting tired. We further pointed out - and showed by chart - how the up volume in the b-3 up wave was much, much lower than than in yesterday's five-wave sequence upward.

So, now we have a "b" wave count that exceeds the high, on a smaller time scale than the daily chart. The purpose was to give the prior up wave more time and proportion. Is that what is happening on the daily chart, too? It certainly is a likely candidate.

The market closed with the daily slow stochastic still embedded, and bias being upward. But, overall, the day formed a doji and closed just inside the upper daily Bollinger Band.

Still the higher b-3 wave indicates there could be another push upward. But, there does not have to be - or if there is - it might fail. 

My market outlook is reverting again to 'negative', and, yes, I might be a few days early. (This is a wave-counting outlook only, and is not to be taken as trading or investment advice.)

Have an excellent start to the evening.
TraderJoe

Wednesday, May 27, 2020

Possible - Not Certain (2)

Please refer to yesterday's post for the potential minute ((b)) wave count upward on the longer term daily chart. Today is another day where an upward terminus is 'possible' but not certain. Here is the ES 2-hr chart which helps clarify the upward count.

ES Futures - 2 Hr - Overlap

First, please note the orange dotted line in the price chart indicating the overlapping waves.  Second, please note that today we counted both five-waves-down from the high, and then another five-waves-up from the low. That rarely happens except in a Flat wave. IF we did have a Flat wave, then that makes this contracting triple zigzag difficult to be a diagonal. It would break the 'rules' which require zigzags only for waves two and four of a diagonal.

Next note that all the higher highs have occurred on decreasing Elliott Wave Oscillator (EWO) values.

Lastly, we note that yesterday we had said the daily slow stochastic had embedded. Ira Epstein said it hadn't. Three different data sources - other than his - confirmed an embedded reading. Today is no different.

Today, price closed above the band, and typically has an expectation of closing outside of the upper band about 5% of the time. For each consecutive close the rule-of-thumb is to subtract 1%. So, IF tomorrow closed outside of the band as well, the probability would drop to 4%. However, daily price bias is still up with price over the 18-day SMA, and today is a good example of how the algo's can just whip around prices and the typical traders' "pet theories" are destroyed in the blink of an eye. These are theories like, "there is round-number resistance at 3,000. It will be defended." And on & on ..

Have a very good start to your evening.
TraderJoe


Tuesday, May 26, 2020

Possible, but Not For Certain

It is possible we completed, the minute ((b)) wave, up today. But, for all the critics out there in wave-counting land, it is not for certain. ES daily price did hit and trade over the upper daily Bollinger Band today, and there was some profit-taking into the close.

ES Futures - Daily - Minute ((b)) Complete?

But, the major wrinkle in the picture is that the daily slow stochastic is now embedded at the settlement. We need to watch it's progress in the next day or two. Here is the four-hour chart. 

ES Futures - 4 Hr - ((b)) in a Wedge?

There are some who will try to see this wave as an impulse. That's fine, it's a good alternate and is shown in red as alt: a of (y) of ((b)). Yet, the wave didn't act much like an impulse as certain sub-waves, like the (x) wave took, so long to complete relative to the b wave at the bottom. Also, wedge shaped impulses typically form when the first wave is the extended wave, not when the c of (w) wave is the extended wave.

So, that is the rationale. Better confirmation will come if and when the ((a)) to (x) trend line breaks to the down side, and the prior wave (b) high is overlapped in the downward direction.

Have a good start to the evening.
TraderJoe

Monday, May 25, 2020

No Parallel

When an Elliott analyst looks at a longer term monthly logarithmic scale chart of the NASDAQ 100 futures (NQ) from the 2009 low, there are a couple of things that stand out like a sore thumb. Let's see if you agree. With between 134 and 140 candles on it - depending on where you see the 2009 low - here is the chart.

NQ Futures - Monthly x((1))

First, just from a visual standpoint, you will note that there has been no wave that has come down to touch the lower parallel trend line! This is truly astonishing - as we see that phenomenon on charts from 5-minutes, to hourly, to daily and even weekly. Now ask yourself, for a moment, why don't we see it here?

Next, take some time to plot this chart and experiment with drawing 0 - 2 trend lines. There are only a couple of places where they will not cut off the next wave up. The location we have drawn is one of them.

So now, let's use the symbol ((1)) to mean circle-1 or Primary-1 in terms of wave degree. If we use the 0 - 2 trend line shown as a guide, it suggests that the entire structure is one with the "extended first wave". Why? Because wave ((4)) has already cut off the line from 0 - 2. In this case, the third wave would be on the peak of the Elliott Wave Oscillator, and wave Primary ((5)) is on a divergence.

Without touching the lower channel line is this another one of those "waves in a wedge"? No, not a diagonal, but an impulse with the extended first wave? Such waves often form wedge shapes.

Yet there is something else going on, too. If you look at the first two candles in the year 2020, they appear very much like only a three-wave sequence at this scale - and they are so short in time compared to the whole prior wave. So, IF we have finished an impulse (in this index), is it possible that prices in this index will eventually go 'over the top'? Well, let's look at another chart.

NQ Futures - Daily - 90 Percent Attained

Here you can see on the NQ daily futures chart - regardless of the current wave count, price has, indeed, reached the 90% level, qualifying this wave for the (B) wave of yet another flat (or triangle) without bending any rules or guidelines. So, we know about (B) waves, right? They can reach 90%, they can reach 100%, they can reach 138% (or even more, right?).

So, while this review does not make me more bullish at this time, it does suggest that if there is a significant pull-back to gain some fuel, that it might well be possible for price to make it over the top.

This does not have to occur in other indexes - like the S&P500 - which has a separate count. It doesn't even have to happen in the NQ. However, in the NQ, the Elliott wave structures do appear to be present to support such a count, if it does.

Have an excellent rest of the long weekend.
TraderJoe

Saturday, May 23, 2020

Bias and Count

The first chart below is a daily four-block of the major U.S. equity index futures relative to their 18-day simple moving averages. Without exception each daily price is currently above "the line in the sand".

US Equity Futures vs the "Line in the Sand"

As Ira Epstein likes to say, this means the current daily bias in the equity market is to the upside. And that bias is up until it isn't.  Now, without getting too complicated, we know that major moving averages (such as a 100-day or 200-day) or upper daily Bollinger Bands are just overhead of the markets - depending on the particular index studied - and these will likely offer resistance. Readers of this blog should plot those out for themselves to see how close to resistance we might be for the indexes that interest them. As far as I can tell, the NQ has the daily slow stochastic embedded, the ES needs another day to embed, and the Dow and the Russell are not close, yet.

The NQ has clearly been the powerhouse and is closest to it former pre-March high. Still, it is worth looking at the wave count on a couple of stocks. I decided not to show you these until I felt the wave counts were getting quite mature. The first is Amazon - which is over it's pre-March high.

AMZN - Daily - Nearing or Completed Five-waves Up

In AMZN, wave minute ((i)), circle-i, appears to be a contracting leading diagonal which led to the large wave three rally that contains the central gap in the "third-of-the-third".  Wave ((iv)) was a very clear flat wave to alternate with the short sharp for wave ((ii)). The stock is either clearly in or has finished it's fifth wave up. Within the fifth wave ((v)), there is not yet an overlapping wave down. It is 'possible' for wave ((v)) to become as long as wave ((i)). That is a typical Elliott wave expectation.  The point is - as an Elliott wave structure - it is getting quite mature.

The next stock is MSFT.

MSFT - Daily - Potential Diagonal

The length relationships in this name allow it to be counted as a partial diagonal. It may have a few days to run yet, but the same conclusion: the count on the waves is getting mature. Should some of these stocks begin to sell off in the upcoming days and weeks, it may be possible to get that Minor B wave down.

And, yes, there could be good sell-offs, particularly in the overnight, but until shown differently, the upward bias remains in the charts. So what other clues do we have?

If we look at the daily VIX, we see that price has not yet contacted the lower daily Bollinger Band. It may be that the large "Smart Money" put-writers are waiting to solidly contact that band before executing their larger strategies that can help move prices.

VIX - Daily - Nearing Lower Bollinger Band

Still, the bands are narrowing in on even them, and it may only be a day or two until contact with the lower band occurs. So, we continue to be patient, flexible and calm awaiting what might be a turning point for the short term, at least.

Have an excellent rest of the holiday weekend.
TraderJoe

Thursday, May 21, 2020

Slap Me Silly

A lot of people like to take an Elliott wave analyst out to the woodshed and beat them into a fine mixture of compost. I want to take this opportunity to do it myself, and save you all the trouble. As you know, I originally started counting the move from the 14 May bottom as a corrective move. So, how in the world, does this analyst get off now potentially calling the up wave as an impulse? This seems like "snake oil" at best or maybe "dishonesty" at worst. Contrary to many paid services, when I make a mistake of some significant kind I like to examine where I went wrong and why, especially to see if degree labels were violated somewhere. Hopefully, I can learn from it.

In the spirit of learning, let me remind you of my initial count from the low.

ES Futures - 5 Min - Corrective From May 14th Low

Now, to be honest, you have to remember I was highly focused on that ((A)) wave on the one minute chart and showing you how to count that wave without violating degree labels. To refresh your memory, refer to this CHART.

Working on such a small time scale as the linked chart, above, can really cause some stress and myopia, but that was not the problem. The chart below shows what I missed at the low.

ES Futures - 5 Min - Missed Diagonal

Those first three waves were, in fact, an a-b-c sequence. But they were a-b-c of ((1)) in a larger contracting leading diagonal that completed after the regular session. Notice that all the needed requirements of a diagonal are met: ((5)) is less than ((3)) in price and time, and ((3)) is less than ((1)) in price and time, and ((4)) is less than ((2)) in price and time, and overlaps wave ((1)).

The reason I am taking the time to show you these charts in this detail is strictly for learning. People scream at me, "You find too many diagonals!" Well - you know what - I missed this one, and it had a large opportunity cost (upward trades not taken).

But mostly, I show you these charts so you can learn something too. Did you find the diagonal? Did you care? Or, like other charting 'professionals' with paid services, did you just ignore degree labeling and say (literally), "Um.. it looks impulsive". No, not an impulse - a diagonal. And, as a diagonal, it meets all degree labeling requirements.

And, then the wave following (which in the cash S&P did not overlap, and I said, "it didn't overlap - do you trust it?") had to be some kind of flat wave, or compound flat wave as it did overlap in the ES futures.

So, now you know. An error was made because I was trying to help show you short term degree labeling. And the results of such efforts was a mistake made in the type of upward direction. Is that honest enough? Does anyone else on the web give you that * for free *?

Hope it helps,
TraderJoe

Wednesday, May 20, 2020

Larger Minute ((b)) Wave

Today, using The Eight Fold Path Method, the futures may trace out an impulse if they can tonight trade over the prior 2,976 high. If that happens, and an impulse up is recorded, then it is possible we are just making a larger minute ((b)) wave, or circle-b, wave up for an expanded flat, and today's impulse is the minute (a) wave up. Here is the daily chart with the count.

ES Futures - Daily - Minute ((b)) Circle-b Up

IF a 105 - 132% x minute ((a)) = minute ((b)) wave can be made, then it is possible to get the expanded flat for the Minor B wave. The higher highs are already generating lots of bullishness. From a degree labeling standpoint, I see nothing wrong with this count because Minor A is the larger wave in comparison to minute ((b)), circle-b. That means that minute ((b)) must simply remain shorter in time than the Minor A wave. So far, that is not a problem. And, of course, it must remain shorter in price than Minor A, its larger wave - and that is not a problem either.

Also - by measurement - the minuet (c) wave of the minute ((a)) wave down or circle-a is shorter in price than all of the minute ((ii)) wave, lower, circle-ii. So, this fits with degree labeling also, and the wave structures seem to fit.

Part of the technical reason for this count is the location of 1) the 100 & 200 day SMA's, and 2) the location of the upper daily Bollinger Bands. With those factors, as well as the extreme gaps formed in the cash charts, it is hard to be as bullish as those who see an immediate C wave 'going to the moon'.

Have a great start to the evening.
TraderJoe

Tuesday, May 19, 2020

Corrective vs. Impulse

Two charts are below. One is the cash S&P chart (cartoon of the Road Runner, meep meep, and Wyle E. coyote). The second chart is the ES hourly futures.

S&P500 Cash Index - 15 Minutes - Double ZZ to 1.272

This chart carries the original count from the bottom, and shows (y) at 1.272 x (w) to a pip. You can see where we labeled the ending diagonal. Today, Wyle E. Coyote was spinning his legs fast and furious to avoid dropping over the cliff. But you can see he made lower prices today before higher ones.

The next chart is the one of the ES hourly futures.

ES Futures - 1 Hr - Channel Count

Reasonable people can agree on these observations. You'll note the futures definitely did make a new overnight high. One very big question is, "Why didn't cash?", as in the cash chart at the top.

Next, you should take your Fibonacci ruler and verify that you can measure a near exact 1.618 extension of the third-movement upon the first in the futures. Is that 1-2 & a 1.618 wave 3? Or is that A-B & a 1.618 wave C? And why couldn't cash make a 1.618 extension, too?

A key inclusion in The Eight Fold Path Method is that 1,2,3 is the same as A,B,C until it is not.

So far, IF the downward wave stopped somewhere near this location, the chart could very well have alternation. It would be a flat for the second wave, and a zigzag for the fourth wave.

Still, we have shown that a typical fourth wave would generally retrace between 38 - 50% of it's third wave. That would put the lower limit at about 2,890. Below there and the odds of a true fourth wave get increasingly minuscule.

Will the fourth wave hold? If it does, an impulse might be claimed in the futures. If it doesn't then, the minute ((b)) wave count at the high might be the better count. Stay tuned.

And have a good start to the evening.
TraderJoe

Monday, May 18, 2020

First Vaccine Day

This post is titled the "first vaccine" day because I don't know how many announcements we will go through of companies that suggest they have a viable one. From Friday's count ...

While we were definitely headed in the right direction (up) but looking only for a 62% or 78% retrace at the 2,900 - 2,907 targets, the vaccine news extended the rally. We then exceeded the prior high in cash, but not the Minor A wave, yet. The updated chart in full detail is below.

ES Futures - 4 Hr - A Larger ((b)) Wave?

It is possible that this is a larger 'news-driven' minute wave ((b)) back to the 90% level or better. The initial flat counts as this 3-3-5. There is nothing incorrect about what we did about calling for a flat wave. We got one.

And there is nothing wrong with what we did counting five-waves down to Thursday's low, which is now minuet (c) of the minute ((a)) wave, or circle-a wave, low. So far, we only have three waves up to the 'possible' minute ((b)) wave, or circle-b wave. It can still count as a w-x-y wave in futures and a minute ((c)) wave down for Minor B is still possible.

Meanwhile, it was so boring after the gap up, we had to have some fun.

S&P500 Cash Index - 5 Minutes - Wyle E. Coyote?

Not only might Wyle be falling of the cliff, there might be nothing holding the cliff itself up. More seriously, the five minute diagonal in cash and futures - which is correct is every detail might end the "three-wave" sequence upward to that minute ((b)) wave, or circle-b.

Have a great start to the evening and week.
TraderJoe

Friday, May 15, 2020

Looking for the End to Minuet (ii)

Nothing has changed with the four-hourly chart of the ES futures. Yesterday, we called the end of minuet (i) within a half-hourly bar, and we are trying to count minuet wave (ii), up. Here is that same four-hourly chart of the futures.

ES Futures - 4 Hr - Minuet (ii)

As it currently stands, minuet (ii) is a little over a 50% retracement on minuet (i).

Summary of what we did today relative to this count:

  1. We saw the futures had some higher highs in the after hours.
  2. When the cash market opened, we looked at a cash chart to see if there was any count that was possibly compatible between the cash and the futures.
  3. We saw that, given the three-wave-up structures yesterday, an X wave or a triangle might fit the bill. We published that cash chart in the comments. 
  4. We published the hourly futures chart in the comments and below.
  5. The hourly futures shows a much cleaner potential triangle. We stated it would not be confirmed however until prices exceeded the high. 

ES Futures - 1 Hr - Triangle X

In the futures, the triangle can be clearly discerned with an ((E)) wave that overlaps the w wave downward, as must occur in a running triangle. We said that the triangle might help burn some time, since, so far, the correction is very short in time relative to the down wave.

Further, in after-the-close studies we can see that the "time" of this up wave exceeds the time of sub-minuet wave ii's 25 hours by several hours. This tends to confirm it is the higher degree wave minuet (ii), in progress.

The wave does not need to go higher. It certainly can go higher. The lower edge of the upward Elliott parallel trend channel should be watched for any breaches to the down side.

Have a good start to the weekend.
TraderJoe

Thursday, May 14, 2020

Interim Post - Minuet Wave (i)

With 166 candles on the current half-hourly chart, the Elliott Wave Oscillator suggests that the minuet (i) wave may be completed as a "bullish falling wedge". This is not a diagonal pattern, but a non-overlapping impulse.

ES Futures - 30 Minutes - Five Waves Down

There are definitely 'five-waves-down'.  Thre "third-of-a-third" is on the lowest trough of the EWO. The fifth-of-the-third ends on the expected divergence. The fourth wave may be a triangle. The fifth wave is currently on a divergence with the EWO. And, it is worth noting that the EMA-34 contacts every major numbered wave as expected.

On a one-time only basis I have added two charts, below, to the post to show a very clear example of the wrong way and the right way to count the very same five wave movement upward. The wrong way does not consider the elements required in degree labeling. The right way considers these elements, and more.

Wrong way and right way to count using degree labeling. In this chart, the supposed sub-wave of wave ((3)) whether counted as wave i or ((3)) or iii of ((3)) is too long, if wave ((1)) is the larger degree than i or iii.

ES Futures - 1 Min - Wrong Way to Count

And here is the right way to arrive at the same conclusion.


ES Futures - 1 Min - Right Way to Count

In the first chart, degree labeling says "one may not claim a lower degree sub-wave is longer than a larger degree wave". Yet, everyone counts this way. The second chart eliminates that problem because wave ((3)) and wave ((1)) are of the same degree, so wave ((3)) may be larger than wave ((1)).

See the comments below at 12:55 ET, and this CHART, as to how the "correctly counted" wave led to the correct conclusion in 'real time', where the incorrectly counted chart leaves one with two alternates and a lot more uncertainty.

Also, notice the overlap at the top?? Very, very telling.

Have an excellent start to the day.
TraderJoe

Wednesday, May 13, 2020

Five Down - Maybe Incomplete

Whether in futures or cash, it is 'possible' to count five-waves-down to a minuet first wave (i) of the minute ((c)) wave of a Minor B wave. The chart style below has not changed.

ES Futures - 4 Hr - Minuet (i)


The cash S&P market undercut is May 4th low. As of this writing - at the futures settlement - the ES futures have not undercut their May 3rd overnight low, but they could. So, the minuet wave (i) could still be incomplete, but it does not have to be.

The overnight market needs to be monitored for any new lows or upward overlaps. It is too early to provide more detail than this, except to say that in one way, since cash did undercut its low, then it is technically possible to consider that the flat wave to Minor B as completed. But that would make the time in wave minute ((c)) about the same time as in minute ((a)), and very often the odd legs of a correction show more alternation than that.

So, in the currently preferred count, the 2900 - 2907 level or lower would hold as resistance for a second wave, minuet (ii), in the upward direction once minuet (i) is confirmed to have concluded. Then a minuet wave (iii) might begin, lower. This would also provide more price-length lower to correct the Minor A wave.

Have a good start to your evening.
TraderJoe


Tuesday, May 12, 2020

So Many Bullish Comments

Yesterday's 4-Hr ES futures chart closed at 2,923.50. Today's chart settled at 2,852.50 very close to the 18-day SMA, with some -70 points of loss occurring today. If you read the comments on yesterday's post, they are uniformly bullish. Those expressing long-winded opinions said things like "defense of 2,900, leads to 3,000...". Or, "I'm still believe the financials have the clearest pattern, and suggest another 7% or so rally to go." Another said, "agree, the longer we hold up the better of going up to 3K." etc. etc.

First, here is the four-hour chart. One nuisance blogger said I shouldn't change chart styles. I should just admit I was wrong or right. So, here is the continued chart style so the poor soul doesn't get confused.

ES Futures - 4 Hr - Beginning of Wave ((c))

The point is not what individuals say, or that they can't have an opinion. The point is why were they uniformly bullish going into the day, and I was resolutely counting downward? What am I looking at that they are not? Five things. You will see below. Let me explain.

In order to win at this game you have to look at things others are not. Everyone looks at price. I'm here to tell you that if you just look at price, you might as well pick up your ball and take it home. You are going to lose. The one thing that everyone sees is price. The problem is that price alone doesn't tell you where price, itself, is going.  By definition, it can't.

What you need to look at are some things that help predict where price is going. What you need are Leading Indicators of price. So, in addition to the chart above, I am going to post two others - in the spirit of learning - although the way some of the nuisance posters behave on this blog, I'm not sure I should. I mentioned the bullishness above. But, I already knew that - not from the blog posters, but from this chart.

Put-Call Ratio - Daily - Speculative

One of the charts I look at daily is the put-call ratio on equities. This is yesterday's chart. Once again, options players were 'speculating' on higher prices big time as the one-day ratio dropped to 0.50, the lowest in a while. Many people do not make a habit of looking at this chart. Maybe they should.

But here is a more telling chart.

ES Futures - Daily - Volume and Day Count

First, look at the futures volume in this rally. Yesterday was the lowest green volume of the rally days. But everyone is bullish?! Volume is a leading indicator of price. You can't go up if it is not well-supported by volume.

Secondly, look at the day count. Very, very few casual analysts look at the Fibonacci number of days, weeks and months. But, time is also a leading indicator of price. If the up wave continued today and tomorrow, then it could have gone to 55 days. It didn't. No, after a near Fibonacci perfect 21 down days, this rally was a near perfect Fibonacci 34 up days.

So, now that there is a down day, is the down move over? Probably not. Now that things have gotten started, there 'should be' a Fibonacci 5 - 13 day down draft depending on how much ground is covered each day. One wise commenter noted how a cycle analyst called for this week to be a 'down week' based on his proprietary cycles. Hey. How about making this so simple you can do it, too, and not get confused with cycles and left-hand translations, or shortened cycles or inverted cycles? Very confusing: at least to me.

Momentum was the next leading indicator. The daily slow stochastic which I don't show you every single time had turned down. But I noted when it lost its embedded status. Volume leads momentum, and momentum leads price.

So, what is it going to be? Are you going to be a loud-mouthed, opinionated commenter? Or are you going to dig in, and explore the leading indicators of price as well as price itself.

There are very few leading indicators of price. They are:
  • Sentiment (e.g. put-call ratio), which determines...
  • Volume, which influences...
  • Momentum, which runs out...
  • In Time, causing a turn...
  • Which is a fractal in the wave count
It must work this way. People must decide to buy or sell before prices go up or down. Just look what happens when they 'withdraw their bids' and prices plunge. And, their tracks - whether Mom 'n Pop, or the Smart Money - are visible in the markets at all times.
I have done this analysis in several weekend videos. I will not do it every day for you. I am looking to see 'who' is learning .. 'who' is applying. Definitely not who is just flapping their gums.

Have a good start to the evening,
TraderJoe


Monday, May 11, 2020

Will the Double-Top Do It?

Last night I had provided some pretty exacting measurements for a potential minute ((b)) wave upward. They played out as written. So, now we have a minute ((b)) wave, as below, which is greater than a 90% retrace on its minute ((a)) wave.

ES Futures - 4 Hr - Minute ((b))

The futures - in the overnight session - made the needed level of the 90% retrace and then fell off before the cash market open to make a lower low below the low of the fourth wave, iv, of (c), as per yesterday's chart. Once that was accomplished, then the futures began rallying back to the 2,937 level by 13:30 ET. This allowed the S&P 500 hourly cash market to also make a 90% wave back up towards its high. That chart was shown HERE.

By 15:00 ET, a double-top was formed to within a tick. And the question is whether or not that double-top will hold in the overnight. If it does, then it is possible we might start the minute ((c)) wave, downward, of Minor B.

Have an excellent start to your evening.
TraderJoe

Saturday, May 9, 2020

An Exacting Measurment

This is the second post this weekend. If you have not seen the first one, it might be helpful to review that one first. This post is based on potentially making a minute ((b)) wave up, to the 90% level of the prior high. The measurements are intriguing. The ES hourly chart is below. 

ES Futures - Hourly - (c) = (a) ?

The premise of this chart is that if we are making a flat wave, it 'should' reach the 90% level of the prior high. One way to do that is to have a zigzag, upward, in the form of a (c) = (a) wave as shown between the parallel channel guidelines.

You will note that (c) = (a) at 2,942 as shown by the middle colored Fibonacci ruler, and yet the 90% level is at 2,946. Further, if the five waves of the last (c) wave are labeled properly, then v = iii at 2,951. This is shown by the second colored Fibonacci ruler. The reason this is important is that it certainly looks like wave iii of (c) is shorter than wave i of (c). The exact measurements there depend on where i of (c) ended. Is that wave ii of (c) a sharp wave or a flat wave? Where did wave i end, exactly?  So, is i shorter or longer than iii? Also, where exactly did wave iv end? Is it on the low as we have indicated, or did it end a couple of bars later? 

These last four questions are very difficult ones to answer. However, the importance of this post is the following. Even on the surface - the way things look - it should be possible to make a minute ((b)) wave up to the 90% level or even slightly beyond. And - depending on where exactly you see the various wave terminals - it should be possible to construct scenarios where clear levels of invalidation occur.

In the example above, wave v of (c) should not go too far beyond 2,951. Keep in mind in the analysis of risk and reward, if the reward is back down to the 2,760 level or more, the upside risk can be limited to 20 to 40 points, or even less. So, from the 2,946 level that is a risk of (say) 40 points for a potential reward of about -180 points. That is a risk to reward of 1-to-4.5 or 1-to-9 or better. But, yes, because of some of the uncertainties, there is real risk, in such a calculation. It should not be taken lightly.

Nothing in this post is to be considered any kind of trading or investment recommendation.  This post is merely an example of a series of calculations that can be made when using Elliott Wave theory. Each person must make their own decisions regarding what to trade and when to trade it. And remember, futures are particularly risky and can cause a loss of some or all of your capital. Consult your financial adviser if you have questions regarding this information.

Have an excellent rest of the weekend.
TraderJoe


Friday, May 8, 2020

Above 78.6%

Because today's up wave went beyond the 78.6% Fibonacci retracement level of the prior down swing - labeled as minute ((a)) on the chart, below - it appears we are making a flat wave.

ES Futures - 4 Hr - Likely Flat

I am still looking for a Minor B wave to become more proportional in length and time to the Minor A wave. That's all. It's happening internally on the shorter-term intraday charts. It just hasn't happened on the 4-Hr or Daily charts yet.

The upward Minor A wave count has been modified only slightly to give the greatest amount of time possible to the A wave, and have it agree with the 4-Hr MACD.

The minute ((b)) wave could have a little more upwards length to it. However, it should not become longer in length or time than any of Minor A waves sub-waves or a degree violation might result. I am still examining this issue. The ((b)) wave appears to be crawling the mid-channel line higher, finding some resistance at it.

Note the futures gap is at the 62% retracement precisely from this Minor A wave location. That could be an eventual target.

Have a good start to your weekend.
TraderJoe

Thursday, May 7, 2020

Three Waves in Two Directions

From the ES hourly chart below, so far we have only three waves in the down direction and three waves in the up direction. These are completely compatible with either the triangle count or the diagonal count.

ES Futures - Hourly - Three Wave Patterns


Today's up wave made a slightly better attack on the 62% retracement level, and it is taking longer in time than the downward wave. The marginally higher high seems to be on a likely divergence with the hourly MACD, as well. The up trend was stopped (at least temporarily) by an up trend line from the origin of the a wave up through the trough of the first three waves down of the b wave.

So, the game tonight and tomorrow into the payroll employment report is to monitor the high and see if it is exceeded (i.e. IFF today was just the first wave of the c wave). And, if not, a better confirmation of a trend lower might come by drawing a line from the start of the a wave through the bottom of the b wave, and seeing if that line breaks substantially and survives a retest.

IFF today's high is not exceeded tomorrow, the b wave 'should be' exceeded lower. At the end of the day, we could count five-waves off the top, including a 1.618 third wave.

Have a good start to your evening.
TraderJoe

Wednesday, May 6, 2020

Direction Still Needed

Here are the two short term paths that seem to have a probability of success. Both of them have a bit of a problem, too. The first is the recent triangle count for Minor B.

SP500 Cash Index - 2 Hr - Triangle for Minor B

The problem is we would like to not see the minute ((e)) wave of a triangle land directly on the minute ((a)) to ((c)) trend line.

The second count is a potential diagonal downward for a longer minute ((c)) wave of Minor B.

SP500 Cash Index - 2 Hr -Diagonal or Impulse for Minute ((c)) of Minor B


The clear problem with this count is that there just are insufficient waves to begin to call either a diagonal or an impulse downward. They might happen in the overnight or on the open tomorrow. But, they are not in sight at this time. The benefit of the second count would be that it would give the B wave better proportions to the A wave.

So, let's see what tomorrow's payroll numbers say, and perhaps there will be more clarity. Again flexibility, patience and calmness are needed.

Have a good start to your evening.
TraderJoe

Tuesday, May 5, 2020

In A Hurry

The market was in a hurry to get back to the 62% retracement of the down wave. It did that, then stalled for much of the mid-day, then sold off. So far, this wave action is consistent with two counts in a couple of forms. The first count is that of this potential triangle in the cash S&P500 index.

SP500 Cash Index - 2 Hr - Potential Triangle

This is the first form of a potential triangle, the second form would have a slightly larger minute wave ((d)).

The second count that is currently compatible with these waves are that after making the minute wave ((b)), up, and the recent a-b-c waves down into yesterday morning, we could be making a larger (probably expanding) diagonal down for a larger and deeper minute ((c)) wave lower.

Because there are two very good options (actually three if you consider both forms of the triangle) the potential triangle pattern is shown with dotted lines only.

One of the problems is that yesterday & today's up pattern in the futures is completely ambiguous. It can be counted as fives-waves-up (to a in black), or it can be counted as three waves up, as a-b-c in red, both without degree violations. Here is the chart.

ES Futures - 15 Min - Three Waves or Five

The explanation for the above chart can be found in the prior post and comments. It is essential in the futures that the overnight wave at 03:30 ET to the 2,865 level be viewed as the first or the "a" wave or else degree violations result. Please note that the cash market at ((5)) or c did exceed the prior high.

Obviously, from the first chart the triangle would invalidate with any movement below the minute ((a)) wave. But, the expanding diagonal almost certainly must travel below that ((a)) wave.

Clearly, the market-making algorithms want their freedom to swing prices around in the high volatility and try to vacuum up the retail customer's accounts. So, more than ever, this is a time for high flexibility, calmness and patience.

Although I personally prefer the downward diagonal because it would give more downward length to the Minor B wave, I have to be flexible, too. So we'll try to update this situation as it becomes clearer.

Have a very good start to your evening.
TraderJoe

Interim Post - Possible Triangle

The chart below cites the facts as they have been counted out using The Eight Fold Path Method. We said in previous posts that Minor wave B 'could be any corrective structure including a triangle'. In particular, see the specific wave relationships cited in the chart notes.

S&P500 Cash - 2 H - Possible Triangle

The up wave from the low of ((c)) has some 2.618 proportions in it, which 'may' make it part of a triangle. There are no guarantees, but a triangle 'might' precede the last wave set up.

Be cautious, flexible, and open-minded.
Have a good day.

Here is the ES 15-minute count upward. It is likely again an 'extended first wave'. It did contain a leading diagonal - followed by a short flat wave. Note that wave ((2)) up near the top is the "longest correction in price". As far as I can tell, any other count results in degree violations. Wave ((5)), up does not have to be finished, but it could be,

ES Futures - 15 min - x ((1))

This was a sun-of-a-gun of a count because the bottom was potentially so confusing, but it may represent the (a) wave of the minute ((d)) leg, up, of a triangle for Minor B. The diagonal stops where the red arrow is, and then the brief wave ii flat takes over,
TraderJoe

Monday, May 4, 2020

Gap and Grind

Last week on Friday - in the last post - we showed a daily chart of the ES futures, and showed how the daily slow stochastic lost its embedded status. We showed that "price and the 18-day" moving average often try to come together when these two things occur: The first is the ES daily slow stochastic must be embedded, with three days or more with both the %D line and the %K line above the 80 level in an up trend. The second is that this embedded status is lost by the %D line of the daily slow stochastic traveling below that 80 level. Here is a repeat of Friday's daily chart.

ES Futures - 1 D - Price meets the 18 D SMA

So, this expectation was met. How was it met? Well, initially on Sunday night prices gapped down substantially - from approximately 2,820 to 2,770. So, they gapped below the 18-day SMA. Then, they rebounded up through it to possibly begin the famous "battle at the 18-day SMA". Here is a fifteen minute chart of the ES below.

ES Futures - 15 Min - Gap and Grind

The main purposes of this second chart are to show that even though the market ground higher after approximately 21:00, it did so in a parallel channel. Further, it is rare that one sees this exceptional level of adherence to the daily pivot points. When the market gapped down, it opened at the S1 pivot, and traded down exactly to the S2 pivot. After reaching the daily central pivot P, the market sold off a bit in the immediate post-cash-closing 15-minutes.

Although according to Elliott wave 'rules' nothing has invalidated about this being a fourth wave in progress, in either cash or futures, it needs to be watched closely as too much further upside would give a warning with the EWO going above the 20 level.

One of the detractors of this site last night said, "According to this post the market will go either up or down. What a joke!" To which I responded, that he must be such a poor trader or market analyst that he has never seen a market do both at the same time.

Well, here is one example. Keep the above chart in mind. Overnight the S&P went down by -40 or more points. Then, it turned around and did exactly the opposite and a tad more. So which is it? Did he want me to say "up" and be wrong for the first 40+ points? Or did he want me to say "down", and be right for the first 40+ points, and then wrong for the next 50+ points?!! 

The fact is that people like him want only one thing. They want to feed their EGO. They want only themselves to be correct. BOTH camps - bears and bulls - were correct today. Take it as a lesson. Take this stuff easily and flexibly. Right now, until or unless there is a new wave down tomorrow - with a lower low on the futures, then we only have three waves down - as follows from The Eight Fold Path Method.

ES Futures - 15Min - Only Three Waves Down So Far

I'll say it again. 1,2,3 is the same as a,b,c until it is not. Right now, one only has a c = 0.62 x a wave, lower. Whether, I like it or not, any other count breaks "degree labeling requirements" in one manner or another.

IF this wave down is over and completed, could it be an X wave? Yes it could. Could it be part of a triangle or diagonal? Possibly. But, the key is FIRST one must establish that the down wave is over. So, keep one eye temporarily on the overnight futures if you like.

In the meanwhile, be kind to others, and have a very good start to your evening.
TraderJoe