When an Elliott analyst looks at a longer term monthly logarithmic scale chart of the NASDAQ 100 futures (NQ) from the 2009 low, there are a couple of things that stand out like a sore thumb. Let's see if you agree. With between 134 and 140 candles on it - depending on where you see the 2009 low - here is the chart.
 |
| NQ Futures - Monthly x((1)) |
First, just from a visual standpoint, you will note that there has been no wave that has come down to touch the lower parallel trend line! This is truly astonishing - as we see that phenomenon on charts from 5-minutes, to hourly, to daily and even weekly. Now ask yourself, for a moment, why don't we see it here?
Next, take some time to plot this chart and experiment with drawing 0 - 2 trend lines. There are only a couple of places where they will not cut off the next wave up. The location we have drawn is one of them.
So now, let's use the symbol ((1)) to mean circle-1 or Primary-1 in terms of wave degree. If we use the 0 - 2 trend line shown as a guide, it suggests that the entire structure is one with the "extended first wave". Why? Because wave ((4)) has already cut off the line from 0 - 2. In this case, the third wave would be on the peak of the Elliott Wave Oscillator, and wave Primary ((5)) is on a divergence.
Without touching the lower channel line is this another one of those "waves in a wedge"? No, not a diagonal, but an impulse with the extended first wave? Such waves often form wedge shapes.
Yet there is something else going on, too. If you look at the first two candles in the year 2020, they appear very much like only a three-wave sequence at this scale - and they are so short in time compared to the whole prior wave. So, IF we have finished an impulse (in this index), is it possible that prices in this index will eventually go 'over the top'? Well, let's look at another chart.
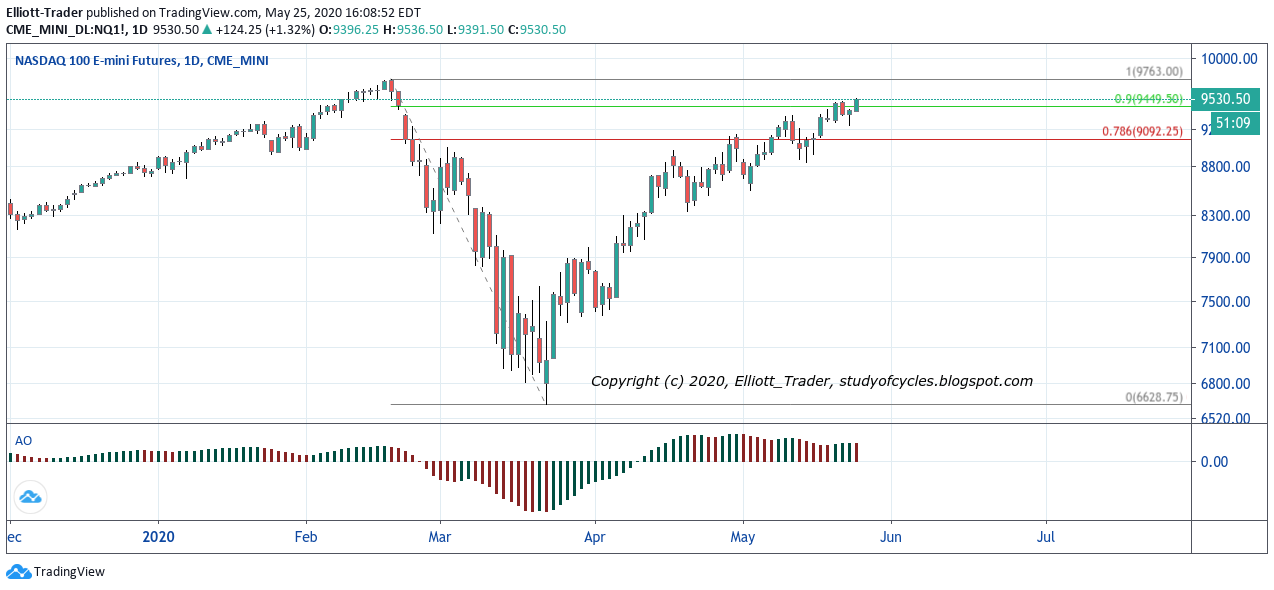 |
| NQ Futures - Daily - 90 Percent Attained |
Here you can see on the NQ daily futures chart - regardless of the current wave count, price has, indeed, reached the 90% level, qualifying this wave for the (B) wave of yet another flat (or triangle) without bending any rules or guidelines. So, we know about (B) waves, right? They can reach 90%, they can reach 100%, they can reach 138% (or even more, right?).
So, while this review does not make me more bullish at this time, it does suggest that if there is a significant pull-back to gain some fuel, that it might well be possible for price to make it over the top.
This does not have to occur in other indexes - like the S&P500 - which has a separate count. It doesn't even have to happen in the NQ. However, in the NQ, the Elliott wave structures do appear to be present to support such a count, if it does.
Have an excellent rest of the long weekend.
TraderJoe
An initial observation is that the AO on ((4)) never really got close to the 90% retrace of highest peak ((3)). It actually only reached about 50% retrace.
ReplyDeleteFor sure!
DeleteThe problem with a 'huge E-D here is the fourth would be longer than the second - which breaks the 'rules'.
ReplyDeleteWhy not fill it now?
ReplyDeleteES @3001.38
ReplyDeleteThe close above 2900 a week or so ago made at least a tag of 3K a foregone conclusion. Strange how no one pays any attention to what has been very consistent price action around these round numbers. My indicators all flashing red...
ReplyDeleteCould also be building cycle wave II as long as we're above red line, this means this correction is 1 degree lower than 2000-2009 "correction".
ReplyDeletehttps://invst.ly/qxjs7
Spx at 3010 how high we headed in this before big wave c?
ReplyDeleteThe unknown account is not responded to. Either log in or pick a username.
DeleteYou could try either the black count in another wedge in the chart below. Or you could try the multi-month triangle suggested by Prechter which is the red count. Either count shares the same 3, 4, 5 at the end.
ReplyDeletehttps://www.tradingview.com/x/1SpXqv8j/
TJ
ES 5-min (very short term); five waves down, three waves up.
ReplyDeletehttps://invst.ly/qxnlq
TJ
resistance area (3020) from last summer held on /ES. :)
ReplyDeleteI think the CLOSE with respect to 3K significant...
DeleteES 5-min (very short term). There is now a lower low, so the diagonal was leading and was properly called. Now the question is will there be only a 'C' wave down, or a '3' wave down?
ReplyDeletehttps://invst.ly/qxntr
In some ways it would be 'nice' to see a triangle form to give more confidence that an up-wave would be over. Not required, but nice. But let's see the reaction at the 38.2% or 50% marks.
TJ
..and for a true sub-wave ii, the upper down trending line of the 'base channel' must hold. If it doesn't then my antennas get up for a triangle.
Deletewhat is the longer term pic elliot? Are we close to that big down wave c?
ReplyDeletei meant joe lol
DeleteFour-hour GOLD may be seen to have come off the top in this fashion. Remember, i,ii,iii is the same as a-b-c until it is not.
ReplyDeletehttps://www.tradingview.com/x/U1cQimy9/
TJ
..that is (w), (x), (y) - where (y) only is a triangle, which is legal for either wave ii or wave b.
DeleteTJ
mm..hmm.. ES has broken the channel to the upside. Triangle possible. More complex second wave or 'b' possible (like GOLD).
ReplyDeletehttps://invst.ly/qxowb
TJ
Yep! One more wave up to go as 3000.00 holding....
Deletehow much more upside do we have in the current up count?
ReplyDeleteMobes, I have answered your question below. But, please don't pester me every minute for the count. Sometimes, it takes a few waves to see where one might be. And remember, I sent you the Ira Epstein trading guidelines for a 'specific' reason. Are we above or below the 18-day SMA? Answer me that question, and what it means in terms of his trading guidelines, or I will no longer reply to your questions.
Deletewe're above the 18 SMA - which indicates an upwards trend correct?
Deletejust trying to keep the focus on the big picture or you might make another mistake like last time
Delete..terrible answer, Mobes.. what does it mean in terms of "trading"?
Deletein terms of trading it means we should take profits and prepare for a downward move back to the SMA?
DeleteA better answer, because price hit the upper daily Bollinger Band.
DeleteLooks like you were right - big move to the SMA
DeleteES 30-min : Here is the larger 30-minute count which might finish the minute ((b)) wave upward before beginning the larger minute ((c)) wave downward. The count would be (a), (b), (c), upward, where (c) is a contracting ending diagonal to finish the wave.
ReplyDeletehttps://invst.ly/qxq86
This is made possible by the fact that price has already once left the up channel to the down-side. Therefore, the wave we are in now should not be a "3", but with all the amazing (lol) gaps up could be a (c)!
TJ
..an upward diagonal has invalidated.
DeleteA new down wave is now longer in price than the first three waves down. Just be very careful.
ReplyDeletehttps://invst.ly/qxr0z
TJ
for the red alt: (b) price 'must' downwardly overlap 2,983 50; not there yet. It 'must overlap the prior (a).
Delete..there's the overlap.
Delete