Wednesday, October 31, 2018

Treat then Trick

Market Outlook: Retracing Minute wave (i)
Market Indexes: Major U.S. Equity Indexes closed higher; DJUtil lower
SPX Candle: Higher High, Higher Low, Higher Close - Trend Candle 
FED Posture: Quantitative Tightening (QT)

Yesterday, we said the scenario for how we would make "five waves up" was uncertain. We saw a potential leading diagonal and a gap up scenario. The gap up is what played out. Prices as measured by the S&P500 Cash Index closed yesterday at 2,683. They gapped up to open at 2,706 (a +26 point gap), and continued traveling upward to 2,737. All day long, until near the close, the buy programs provided the 'treat' some were looking for. In the process the waves up yesterday made a 1.618 extension in the futures - a bit too far for a typical (b) wave, and more like a third wave. In cash, the extension was a 1.27 extension. Still good enough. In the process wave ((4)) of the hourly diagonal was exceeded higher, and with it the hourly down trend line.

Then, as if like clock work, at 15:00 ET late day sell programs played their 'trick' and dropped the market down to gap support, back to 2,710 a decline of -27 points from the high.

Again on a one time basis, so you have some confidence, here is today's five minute cash chart for your review. Included are yesterday's waves.


S&P500 Cash Index - 5 Minutes - Channel

Currently, we have four waves up in a channel that follows The Eight Fold Path methodology quite well. We do not know that the fourth wave is done - could still go a bit lower. But, there is good alternation between wave ((2)) as a clear 5-3-5 zigzag - with its lower (B) wave, and wave ((4)) as a 3-3-5 flat, with its higher (B) wave.

Remember, on the wave ((3)) up count, due to degree labeling requirements, no sub-wave within ((3)) may be longer than ((1)), and the sub-waves are so labeled. They fit well, and wave (3) of ((3)) is on the peak of the EWO, and is the wave with the gap in it.

The day's down trend did not begin until a tiny little ending diagonal C wave of the (B) wave overall had it's fifth wave ((v)) fail by just a bit. Awww ..

For this up wave to remain an impulse, then wave ((1)) may not be overlapped. So far, so good. We'll see what tomorrow brings. From the standpoint of "window dressing" they lifted the market early so they could easily sell their losers into the higher prices, and then dropped it to begin to pick up their preferred names . You never know how these things are going to go.

Have a good night and stay out of mischief on a night like tonight - Boo!
TraderJoe

Tuesday, October 30, 2018

Trick or Treat, or Both?

Market Outlook: Probable Long Term Top Identified
Market Indexes: Major U.S. Equity Indexes closed higher
SPX Candle: Lower High, Higher Low, Higher Close - Inside Candle 
FED Posture: Quantitative Tightening (QT)

Tomorrow is the last day of the calendar month. As I have written about before, this is often a "window dressing" day, with sloppy price action, as portfolio managers trim their holdings of the losers and try to show they were only holding the winners. This will be followed by Nov 1st on Thursday, the first trading day of the new calendar month. This is often a day of inflows as mutual funds, 401k's, pension funds, company bonuses and dividend reinvestment plans often add funds to equities on a planned or timed basis.

From a technical standpoint, today made a higher high than yesterday's late day rally high, but not a higher daily candle overall. Today was an inside day, and from the perspective of the hourly chart, below, price closed right on the hourly down trend line, about which so much has been written.

S&P500 Cash Index - Hourly - Close on Upper Descending Trend Line


So, there are now three competing counts. The market wants us to have to assume a lot of risk - or none - in order to find out which is which. (I chose the latter! Lol!).

The three competing counts are currently a diagonal upward, a flat for wave (ii), or a lower low. Let me explain. First, the upward diagonal version.


S&P500 Cash Index - 15 Minute - Upward Diagonal Version

So, if wave (ii) can hold as a low tomorrow, and then proceed to make a marginal new high (which would likely break the hourly down trend line), then there may be justification for "five-waves-up". Note that wave (iii) stopped almost precisely at the 0.618 extension on wave (i) - which is quite common in diagonals.

But, if a diagonal is made upward, say early in the day, then much of the day could be spent retracing it downward in the "window dressing", prior to say a first of the month rally day.

The other possibility is a large gap up in cash that destroys the pattern of a Leading Diagonal wave, and brings about perhaps a larger flat wave for wave (ii) - in other words today's high might only be all or part of a common (b) wave upward, with a (c) wave down to follow. Wave (ii) would not fully have occurred yet.

Finally, since we have tagged the upper diagonal trend line, and since (i), (ii), (iii) of a diagonal counts exactly as (w)-(x)-(y), is it possible that all of minute ((ii)) is in the market, and prices head lower to break the low? This last option would seem remarkably short in time to correct all of the bars of the diagonal, so far. So, for me, it is lowest down on the list, but I will watch for it. I only mention it because, it is possible, and would not break any rules I know of. But, again, when time is considered as a guideline, then, it should be considered last.

As far as I can tell, because of the grinding up nature of today's movement, I have shown the most likely count on the fifteen minute chart. But, money managers who want to adjust their portfolios may have more to say about it than I do.

Have a good start to your evening.
TraderJoe


Monday, October 29, 2018

Gap Up, Gap Fill, Lower Low

Market Outlook: Probable Long Term Top Identified
Market Indexes: Major U.S. Equity Indexes closed lower; DJUtil higher
SPX Candle: Higher High, Lower Low, Lower Close - Outside Candle 
FED Posture: Quantitative Tightening (QT)

The cash S&P500 Index closed Friday at 2,659. After a gap up at the outset, prices traveled as high as 2,707 a gain of about +48 points by about 10 AM ET. After running smack into the hourly down trend line that we have shown for days and days now, the market turned lower, filled the gap, and kept heading lower until it made new lows for the down move. (P.S. The line is finally so prominent that even TV channels and other websites are finally catching on.)

The new lower daily low on both the S&P500 cash, ES E-mini S&P500 Futures, and NQ 100 futures now insures that the hourly diagonal (if it holds up) can now be classified as a 'Leading' Diagonal since it's fifth wave did not truncate. Remember, Leading Diagonals are not allowed to truncate. Ending diagonals can truncate.

By about 15:45 ET, the S&P500 had reached an intraday low of 2,603 - a more than 100 point swing from high to low. In the last fifteen minutes, the market rebounded by about +38 points to close at 2,641. Here is the continued hourly chart.

S&P500 Cash Index - Hourly - Qualifies for Potential Leading Diagonal

So, at the present time the above structure does qualify for a potential contracting leading diagonal: Wave ((5)) is currently shorter than wave ((3)), wave ((3)) is shorter than wave ((1)), wave ((4)) is shorter than wave ((2)), wave ((4)) overlaps wave ((1)), and they are all three-wave sequences.

At the end of the day, prices were trading back inside the diagonal. I have one manner of counting a completed Elliott Wave Count on the five minute chart. On a one time basis I will show that chart below.

ES E-Mini S&P500 Index Futures - Five Minutes - Possible Downward Diagonal Completion

In other words, the (C) wave of ((5)) may, and I stress may, have completed as an expanding ending diagonal to end the downward diagonal overall. In the above chart wave 4 overlaps wave 1, and wave 3 is longer than wave 1. And, prices are trading back in that diagonal, as well!

The true test of whether the down turn is over, however, will only come if price can get above the hourly down trend line (in the first chart, currently at 2,725) and then back-test the trend line and hold it. I don't know this will happen: I have to see it happen.

However, there are some kinds of divergence at today's lows - including a divergence with fewer declining issues today. So, it bears close monitoring. If for any reason that wave ((5)) on the hourly chart becomes longer than wave ((3)) - presuming a flat correction is not made - then an impulse count must be considered as taking hold lower. So far, that has not happened. We will deal with it if it does.

If, on the other hand, this diagonal holds it's measurements, then we likely have our first minute wave (i), down.

Have a very good start to your evening and your week, and be very careful out there. Given how quickly there can be 50 - 100 point changes in direction this is no time for heroics.

TraderJoe

Friday, October 26, 2018

Still No Higher High Day

Market Outlook: Probable Long Term Top Identified
Market Indexes: Major U.S. Equity Indexes closed lower
SPX Candle: Lower High, Lower Low, Lower Close - Trend Candle 
FED Posture: Quantitative Tightening (QT)

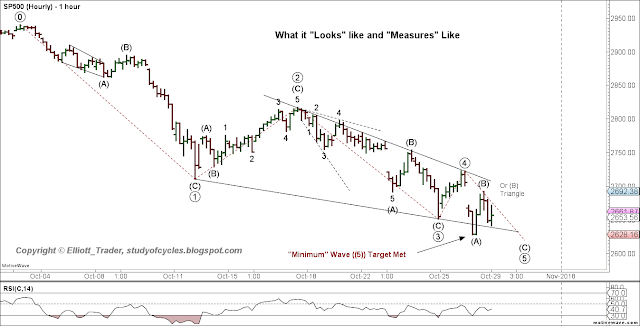
Amazon's earnings forecast hurt futures in the overnight market. It was not until morning that we could definitely say that wave ((4)) on the hourly chart was over. All major U.S. equity markets had daily lower low candles. They are beginning to synchronize. In making the lower low, the "minimum" downside objective for a diagonal count has been made and has been marked on the chart.

Is the diagonal over? Is it the final word in the EW Count? Once again, see the hourly chart below.

S&P500 Cash Index - Hourly - Potential Contracting Diagonal

After the morning's drama, there was a sharp rebound to just beyond the 62% level of wave (A). Then, there was a drop to the the 78.6% level on wave (B).

So, it would not at all be surprising if the (B) wave turned out to be a triangle in some form to indicate "last wave" dead ahead. We shall see if things work out this nice & tidy. And, since wave ((4)) has "played fair", and remained shorter than wave ((2)) in both price and time, it would now be up to wave ((5)) to remain shorter than wave ((3)) in price, especially, and time, as well.

If, for any reason, wave ((5)) becomes longer than wave ((3)) then the  next best count would be an impulse, but we'll cross that bridge if the market makes us. For now, it's just great to have objective criteria.

Again, more than likely if the five waves of a diagonal complete successfully, and they may have already, then we would likely have minute wave (i) downward, with an expectation for minute (ii), upward. But let's not put the cart before the horse. For now we have labeled today's wave down as the (A) wave, so that the diagonal has better form and proportion. The internal (A), (B) of each downward leg is clearly visible, so, we suspect this one should be too.

Rest up, and have a great evening and a great weekend.
TraderJoe


Thursday, October 25, 2018

Most Major U.S. Equity Markets - Inside Days

Market Outlook: Probable Long Term Top Identified
Market Indexes: Major U.S. Equity Indexes closed higher; DJUtil lower
SPX Candle: Lower High, Higher Low, Higher Close - Inside Candle 
FED Posture: Quantitative Tightening (QT)

If you read yesterday's post, it is very hard to say yesterday's S&P500 hourly chart was not predictive. Here is the wave that resulted, today.

SP500 Cash Index - Hourly - Potential Contracting Diagonal

Does the upward wave have to be over? No. Can it be? Yes. It would be super-slick to see price tag the upper trend line as drawn and even push it out a bit.

Hint: Technically, there could be a (B) wave flat from the middle of the day today, which definitely does retrace over the top of the prior (A) wave, both in the cash and especially in the after-hours futures. 

Let's see if they give it one more heave-ho up tomorrow.

What happens if they don't? Consider a very minor truncation at the high today. Today's upward wave ((4)) was just over 38.2%, but less than 50%: sufficient, but it can do better. In any event, remember that wave ((4)) must remain shorter than wave ((2)). If it doesn't, we'll address it at that time. Right now we have very, very objective criteria, which is always a plus.

They're doing their level best to make sure there is the least possible confidence in this wave.

Hang in there and remain patient, flexible and calm.
Have a good evening.
TraderJoe

Wednesday, October 24, 2018

Most major markets Lower Lows

Market Outlook: Probable Long Term Top Identified
Market Indexes: Major U.S. Equity Indexes closed lower; DJUtil higher
SPX Candle: Lower High, Lower Low, Lower Close - Trend Candle 
FED Posture: Quantitative Tightening (QT)

With "five up" yesterday, today was the best chance to see a higher high daily candle. That did not happen. As far as I can tell, the five waves wound up being the 'c' wave end of a flat wave for (B) today. Price in the overnight marked nicked the high of yesterday and then began falling off quickly. Bomb threats in NYC today did not help. People asked yesterday if lower low prices were possible, and I responded that they certainly were.

Today, the NAS/NDX, RUT, DOW and S&P500 all made new lower lows. That is a second lower low for all. Yesterday, I published a count of a potential diagonal as an alternate count. That potential diagonal is still on the table as of today's close. There is nothing about an impulse that has been ruled out yet. It can still very well be the main count. None-the-less the internal wave count is so wicked as to demand a look at the potential diagonal.

S&P500 Cash Index - Hourly Chart - Potential Leading Diagonal

First, nothing says that wave (C) of ((3)) is now over. It may want to spike lower tomorrow to the 78.6% extension where ((3)) would be 78.6% x ((1)). Further, as a diagonal, the wave must conform in every manner to a diagonal wave.

So, now we have very, very objective criteria. If wave ((3)) becomes longer than wave ((1)) downward, then the diagonal is over - meaning invalidated. Finit. Kaput. Then we move on to a 1.618 wave downward - out of the gate.

However, if before the end of the month, wave ((3)) remains shorter than wave ((1)), and we get a fourth wave ((4)) up, as shown above, which remains shorter than wave ((2)), and occurs as a zigzag, then it is possible we will get a fifth wave down to end the series in which a wave ((5)) must remain shorter than wave ((3)).

Again, these five waves down would be to a minute (i) wave, downward.

Please have patience and flexibility. The market is doing the best it can to throw us and everyone else off its course. Again, there is nothing wrong with an impulse lower, it just doesn't "look right" at this time. No upward counts can be considered until there are higher high days. 

On some technical notes, the NQ today just made an outside reversal day down. And today confirmed a cross of the 18--day SMA down under the 100-day SMA on the daily ES futures chart with Bollinger Bands. A lot of moving average cross-over people follow those carefully in the futures. You are encouraged to review the daily futures charts with 18-day Bollinger Bands to see where prices are now in relationship to those bands. NYSE breadth is about 3 or 4 : 1 on the downside; most truly impulsive kick-offs are 9 or 10 : 1; so that may fit more with the diagonal, but new lows are completing swamping new highs.

You have your work cut out for you.
Have a good evening.
TraderJoe

Tuesday, October 23, 2018

Five Waves Down

Market Outlook: Probable Long Term Top Identified
Market Indexes: Major U.S. Equity Indexes closed lower
SPX Candle: Lower High, Lower Low, Lower Close - Trend Candle 
FED Posture: Quantitative Tightening (QT)

Prices plunged in the overnight market, supposedly on worries about China or earnings of American companies in China. Even before the open, the Dow, Russell 2000 and ES (S&P) futures had made new lows below the October 11th low.

After the cash market opened, prices as measured by the S&P500 cash index spiked all the way down to 2,691.43, before the dip buyers came in around 10:15, and prices began a rebound in five-waves and almost closed the opening cash gap, but missed it by just a tad at 15:30 ET. Prices then fell off a bit into the close.

Any way you cut it, there is now the reality of "five waves down". That reality is shown on the first cash chart below. 

Today's low is just precisely below the low of minute wave (ii) on the chart, and this completely eliminates any expanding diagonal upward diagonal some were talking about. Not only does the level do it, but so does the presence of five-waves down. We said we could not consider any upward diagonals as a possibility again until or unless prices got above the 2,900 level. They didn't.


S&P500 Cash Index - Daily - Five Waves Down


What might be unexpected by many? We caution, what appears below does not have to happen, but it could. However, given the current wave relationships, it is possible for the downward wave to form a diagonal lower. Not a diagonal higher. Let me clearly indicate at this time that this count is an alternate. But it is a legit one based on having five-waves up at the end of the day today.

S&P500 Cash - Daily - Alternate

Because so far the waves look like three-wave sequences, and they feel choppy as can be during the day, it is possible we are making a contracting diagonal lower. We already have the potential overlap for iv on wave i, but to remain valid, this alternate must see wave iv first remain shorter in price points than wave ii. This is reason we have placed a Fibonacci ruler on potential wave iv.

Whether or not a diagonal comes to pass, then, either way, more than likely we are looking at minute wave (i) in the downward direction. Remain flexible, calm and patient.

And, have a very good start to your evening.
TraderJoe


Monday, October 22, 2018

Another Lower Low Day

Market Outlook: Probable Long Term Top Identified
Market Indexes: Major U.S. Equity Indexes closed mixed
SPX Candle: Lower High, Higher Low, Lower Close - Trend Candle 
FED Posture: Quantitative Tightening (QT)

Prices as measured by the S&P500 cash index, continue to consolidate lower, and made a lower low day today over that of Friday, and that of Thursday.

S&P500 Cash Index - Daily - Lower Low Day

Today was also still choppy and the NAS/NDX closed higher, so, to some extent prices are fighting each other. 

There are 'partial' formations on the daily chart and on the 30-minute chart which can't be called complete yet. Suffice to say, any daily low below wave iii would likely signify an impulse lower.

The EMA-13 continued to widen out over the EMA-34 which still connotes a negative price bias.

That's all that can be said right now.

Have a good start to your evening and to your week. 
TraderJoe

Friday, October 19, 2018

Some Lower Low Days

Market Outlook: Probable Long Term Top Identified
Market Indexes: Major U.S. Equity Indexes closed mixed
SPX Candle: Lower High, Higher Low, Lower Close - Inside Candle 
FED Posture: Quantitative Tightening (QT)

The market knows we're all watching. Some markets, like the Nasdaq 100 Futures, and the Russell 2000 Futures put on lower low candles. The S&P500 was an inside candle, with a lower close. The DOW had a higher close.

S&P500 Cash Index - Daily - Inside Day

There still remain several ways to count the six last overlapping days. They could be wave iv of an impulse. They could be wave ii of a downward diagonal. They could be part of a triangle for wave iv, with a downward wave v to follow. Today was still very, very choppy price movement.

There are upward possibilities as well, but they will not be addressed unless or until there are higher high days. Right now, price is still being rejected by the EMA-13, and it is widening from the EMA-34, which still connotes a downward bias.  

As of today, the NQ futures on the daily chart have a bearish cross of the 18-day SMA under the longer term 100-day moving average. The Russell 2000 did that on 09 Oct. The NQ futures have upward overlap on their first or 'a' wave down, which makes it seems like further downward price movement might help make a diagonal more readily in that price series. The Russell 2000 futures did not overlap upward.

On a shorter-term basis, the S&P500 30-minute channel we showed in yesterday's post was broken to the downside today, as we expected from the ((A)), ((B)), ((C)) labeling, upward, in yesterday's post.

Have a good start to your evening, and to your weekend!
TraderJoe

Thursday, October 18, 2018

Confirmation Day

Market Outlook: Probable Long Term Top Identified
Market Indexes: Major U.S. Equity Indexes closed lower; DJUtil higher
SPX Candle: Lower High, Lower Low, Lower Close - Trend Candle 
FED Posture: Quantitative Tightening (QT)

Yesterday's possible "hanging man" candle in the cash S&P500 (see yesterday's SPX candle) played out nicely today, with both a lower low day, and a lower close day, confirming the candle. However, after the gap down, in tone the day was quite choppy.

The only things that seemed to work reasonably well were 1) to consider the up move from 11 Oct to 17 Oct as a large three-wave sequence; the chart is shown below, 2) to realize that corrective moves often occur in channels, as a bear flag, & that the break of the lower channel lower could be telling, and 3) to count on a very short term 5-minute basis, the down wave as a five wave sequence.

Here is the S&P500 30-minute chart showing the three wave sequence, and the channel boundaries.

S&P500 Cash Index - 30 Minutes - Channel

In the down wave today you can find a few ways to count "five down", but the alternation gets a little unclear. If the down move continues tomorrow, and makes a new lower low, lower than 2,710 we could have had a minuet fourth wave up, and a minuet fifth wave down to make an impulse.

If the choppiness is endemic of a triangle, we could thrash around for a while before making the lower low. Or finally, if we only make a marginal low then this ((A)), ((B)), ((C)) up wave could be wave ii of a diagonal lower, with the zero point on the chart as a,b,c of i, and the end of the ((C)) wave as ii.

None of these can yet be ruled out, so we remain, patient and flexible.

Counts in the upward direction can not be considered without a daily higher-high candle. And all those larger potential diagonal upward diagonals would require a cross of 2,900 and again would not be considered until or unless that occurs.

Have a good evening,
TraderJoe


Wednesday, October 17, 2018

Crude Oil Impulses Lower

Market Outlook: Probable Long Term Top Identified
Market Indexes: Major U.S. Equity Indexes closed lower; NDX higher
SPX Candle: Higher High, Higher Low, Lower Close - Possible Hanging-Man Candle 
FED Posture: Quantitative Tightening (QT)

On October 11, 2018, in a post you can find at this LINK. I stated it was very possible we had a daily top in Crude Oil. Today, unlike the S&P500, the WTI November Crude Oil chart, made a clear, impulse wave down on the two-hourly chart which appears below.

CL November Futures - Daily - Clear Non-Overlapping Impulse

The wave began with the contracting diagonal lower - same as in the S&P500 Cash Index. After a sharp looking second wave, which retraced about 60%, this predicted a longer and stronger third wave down on the low of the MACD indicator shown. Then, there was a very sideways looking fourth wave, which can be either a failed double combination or a triangle with a very, very short (e) wave. Regardless, after attacking the upper parallel Elliott trend channel, without overlapping the first wave, prices then broke down as expected for a fifth wave.

This is what we were expecting in the S&P500. So far, we haven't gotten it. Of course, Crude Oil doesn't have "quarterly earning report news" to possibly interfere with the creation of an impulse in terms of timing.

The jury is still out on the S&P500. More on it tomorrow.
Have a good start to your evening.
TraderJoe


Tuesday, October 16, 2018

Higher High Day & Invalidated Triangle

Market Outlook: Probable Long Term Top Identified
Market Indexes: Major U.S. Equity Indexes closed higher
SPX Candle: Higher High, Higher Low, Higher Close - Trend Candle 
FED Posture: Quantitative Tightening (QT)

One of the clear reasons that we caution that triangles and diagonals are patterns that must prove themselves is in relationship to a day like today. Overnight, the ES 2-hr triangle had the potential to complete and complete properly. In the last wave, the potential (e) wave, the pattern was invalidated, and a short squeeze was on.

That leaves us with only three-waves down on the daily chart. Sad, but true. Let's eliminate from consideration everything on the daily chart, except this down wave, and what comes after wave 5.

S&P500 Cash Index - Daily - Only Three Waves Down


The Elliott Wave Oscillator (EWO) remains much lower.

It should be clear that so far, there are only three waves down. Could a fourth and fifth wave form? Yes.  But given the length of today's rise, a straight-forward downward impulse is now tougher to do.

Could price find resistance at the back test of the channel? Yes. 

Could the first three waves down be the start of a downward diagonal? Yes. 

Could they only be a second wave of a larger move upward? Given only a 62% retrace to the low, yes, but harder at this time to see how. Therefore, it is lower probability. (See note below!)

This is just one of those situations where one has to wait for more information, and to see what happens, if and when price back tests the channel and interacts with the EMA-13 and EMA-34.

Have a good start to your evening.
TraderJoe 

(P.S. Revision after the close. I measured this down wave, it is much, much larger in the cash market than Minor 2, at the election low. Therefore, by degree labeling, it would likely be incorrect to put a 2, or (ii) at the October low.)


Monday, October 15, 2018

No Higher High Day, Yet

Market Outlook: Probable Long Term Top Identified
Market Indexes: Major U.S. Equity Indexes closed lower; DJUtil, DJTrans, RUT higher
SPX Candle: Lower High, Higher Low, Lower Close - Inside Candle 
FED Posture: Quantitative Tightening (QT)

From the Friday and weekend posts, you will have read we are expecting a consolidation at lower levels. So far, we are getting that, and it tilts the odds in the downward direction - at least temporarily. Below is a continued chart on the ES E-Mini S&P500 Futures, so you can see that, as of now, nothing has changed.


ES E-Mini S&P500 Futures - 2 Hr - Potential Running Triangle


As of this writing, a potential running triangle remains in tact. Today it found upward resistance on the upper edge of the declining Elliott parallel trend channel, and was attacking it as we delineate in The Eight Fold Path Methodology.

The triangle remains a potential. It must prove itself in every detail. There is already one way to count such a triangle as complete. Just slide the (c) wave over to the 12 Oct high, and slide the (d) wave over to the 12 Oct low. That would leave today's high as the (e) wave - which breaks no rules or guidelines. The reason it is labeled as above is that this looks better in the cash market. So, the (d) wave could still break down a bit, and then an (e) wave upward take over.

Kindly remember three details of potential running triangles. First, the upward (e) wave must overlap wave iii wave. If the (e) wave ended today, it does this already. If it ends, tomorrow, such an overlap would be expected. Second, running triangles, with their lower (b) waves are bearish structures - at least temporarily. Running triangles with their higher b waves are bullish in bull markets. Running triangles with lower b waves are bearish in bear markets. IF this triangle completes successfully it will be giving us a very big clue. (This is not trading or investment advice - just a description of how running triangles operate in various markets, as best I understand it). Third, and finally, the usual technical analysis target for a triangle is the widest width of the triangle added to the breakout point, or breakdown point in this case. If this occurs, it would target at least a new low from the current triangle width.

So, stay tuned. Let's be patient, flexible and calm, and lets see if a triangle forms properly, and if it does, then does a clean lower low form for a fifth wave down?

Have a good evening, and a good start to the week.
TraderJoe

Saturday, October 13, 2018

Elliott Wave Video

As I haven't done one of these in a while, I thought I'd post a video now to review some milestones on quite a long journey. The journey isn't over. I still have more to learn and to discover. But, I thought you might enjoy this now. After you click on the video you can enlarge it to full screen by clicking on the [  ] full-screen button.


Further, I hope this video will encourage a 'new generation' of Elliott analysts to dig into the specifics of wave counting, and help make it more scientific, and less vague.

Have a very good weekend, and leave a comment or a question if you liked the video. Most importantly, tell your friends to help spread the word, and support the blog.

Have a good weekend.
TraderJoe

Friday, October 12, 2018

Inside Day

Market Outlook: Probable Long Term Top Identified
Market Indexes: Major U.S. Equity Indexes closed higher
SPX Candle: Lower High, Higher Low, Higher Close - Inside Candle 
FED Posture: Quantitative Tightening (QT)

Yesterday, we suggested readers and wave counters might look for an inside day - a day of consolidation. That is what we got. Here it is, using the daily ES E-mini S&P Futures just to insure all prices are included.


ES E-mini S&P500 Futures - Daily - Inside Consolidation Day

Here is a continued count on the down wave, using the two-hourly futures, the chart starts on the left with the Leading Contracting Diagonal we identified in near-real time for you on the S&P500 Cash 15-minute chart. Then, it continues with a complex wave 2 correction as w-x--y, where only the y wave is a triangle (allowed). Next, there is the long and strong third wave, 3, in five sub-waves, and now a consolidation, likely for wave 4.


ES E-min S&P500 Futures - 2 HR Chart - Downward Count

So far, prices are still channeling well. The next expectation of an impulse lower is for prices to attack the upper channel boundary, and possibly push it out a bit. Right now, the internal structure of wave 4 favors a triangle, as this might help equalize the size of the wave with the size of wave 2, which is quite small. It is hard to be more definitive about which wave of the potential triangle we are in because it's hard to determine yet, if one leg is more than a simple zigzag. IF we are making a running triangle - then just as running triangles were bullish on the way up - they are bearish on the way down. Again, a triangle is a structure that must prove itself, so it needs to form properly in every detail.

Again, under no circumstances can wave 4 up, overlap wave 1, down, and have the wave remain an impulse.

Let's see how it goes. Have a very good start to your evening and to your weekend!
TraderJoe

Thursday, October 11, 2018

Lower Low Day & Overlap

Market Outlook: Probable Long Term Top Identified
Market Indexes: Major U.S. Equity Indexes closed significantly lower
SPX Candle: Lower High, Lower Low, Lower Close - Trend Candle 
FED Posture: Quantitative Tightening (QT)

If you have not seen this morning's update on Crude Oil, you can view it below this post. In the equity markets, today was a lower low day, some consolidation, and a further lower low. From the standpoint of an impulse wave, the overlap means that the impulse ended with the earlier description we discussed yesterday. We'll show that count on the daily chart, below.


S&P500 Cash Index - Daily - Terminal Count

Nothing breaks the rules in this count, but from Minor 4, there are only 105 candles, not the required 120 - 140 needed to follow The Eight Fold Path Method. So, we conclude this wave just doesn't follow it.

Although there are other ways to count the index to a new all-time high, they would both be diagonal counts. One would be a contracting diagonal, with this as wave ((ii)), lower. And one would be an expanding diagonal, with this as wave ((iv)) lower. And, they both would rely on prices first breaking 2,900 on the upside.

Because of that and the fact that there is already a clear diagonal on the daily chart, above, the odds favor further downside (this is not trading or investment advice). Also, there can be no suggestion of a turn higher until there are candles on the chart that have higher high days. Right now, the candles have lower lows.

So far, the downward wave looks best counted as three waves down. Let's see if there is a consolidation for a fourth wave, and a fifth wave lower. If so, that would likely rule out one upward diagonal scenarios. In the case of the expanding diagonal, in no case could the current minute ((ii)) wave be exceeded lower. In the case of the contracting diagonal, of course, in no case could the Minor 4 be exceeded lower.

I will not be writing about diagonals again until or unless prices close above 2,900. They are possible, but they fight the odds at this point.

Have a good rest of the day and a great start to your evening.
TraderJoe