Sunday, February 25, 2018

German DAX - Then and Now

On January 11th of this year, and over a month ago, this chart of the German DAX was published on this blog. (You can see the original posting at this LINK.)

THEN:

German DAX - Weekly - Posted Jan 11, 2018

Although there was some slight down movement at the time, prices had not broken to a lower weekly low yet. Clearly by the lines drawn on the chart, a prediction was made that there would be a lower weekly low, and a larger wave (4) which would attack the lower channel line and likely terminate in the area of a prior wave 4.

Here is  the updated chart.

NOW:

German DAX - Weekly - 02/25/2018

So far, wave (3) is slightly above the channel to show the portion of the wave with the greatest momentum, as typical, and the decline has appeared to stop at the prior wave 4. That being the case, Elliott suggests we redraw the channel slightly so that is is now touching waves (2) and waves (4) at the bottom edge.

Any weekly higher highs will suggest the fifth wave (5) is in progress. And the first target for the move will be the mid-point of the channel (as always, not trading or investment advice). Should price exceed the mid-channel, then look for the current upper channel line.

And, if price exceeds the current upper channel line, then, it, the upper channel line, will be re-drawn so that so that it is parallel to the lower channel line but touches on (3) rather than (1).

As with all Elliott wave scenarios, this one is probabilistic too. There is some chance, likely a small one, that wave (4) could better define itself with a lower low. And there is some chance, also likely a small one that wave (b) is the high in a wedge-shaped wave. There is also a not-so-small chance that wave (4) could go on to form a triangle with the current wave (4) only being wave (a) of the triangle, and the prior interior (a) &(b) waves being demoted by one degree to a & b.

But at this time, the above wave channel has the right look, and therefore has  the greatest odds of playing out in one fourth & fifth wave combination or another. The Fourth Wave Conundrum occurs at every degree of trend, and there is nothing one can do about it due simply to the large number of ways that fourth and fifth waves can form. Yes, we must remember the fifth wave could impulse, but it could also form a grinding diagonal, as well.

There is also no requirement that the fifth wave 'must' make a new high. If we are at the end of a longer wave cycle - like a SuperCycle - wave (5) could certainly truncate, if it wishes, and stop short of the all time high. So, as usual, one must take it a step at a time and not get overly-enthusiastic on one path or the other.

Cheers and enjoy the weekend.
TraderJoe

Friday, February 23, 2018

Depends on the Futures Again

Market Outlook: Now Getting Higher Volatility
Market Indexes: Major U.S. Equity Indexes closed higher
SPX Candle: Higher High, Higher Low, Higher Close - Trend Candle
FED Posture: Quantitative Tightening (QT)

Yesterday, we showed you a chart of a potential contracting diagonal wave, and said an awful lot depended on today's gap direction. Prices gapped higher at the open, broke the upper diagonal trend line, back-tested that same trend line and headed higher. I said I was looking to count an impulse downward in the live chat room, if the gap direction was lower, and that did not occur. I continued to try to count an impulse lower to be sure one couldn't be counted, and by mid-afternoon, it couldn't be. 

To be sure, I was looking for a larger downward structure than a 23.6% wave. It may simply not occur that way.

S&P500 Cash Index - Potential Diagonal or Triple Zigzag Lower

I also said in the previous post that the potential diagonal was malformed. Wave (v) was too long in time for wave (iii) or vice-versa, and the Elliott Wave Oscillator made a lower low at (v) than (iii) - which is not the usual signature of the EWO on a true diagonal.

So, since every potential diagonal which is formed by the 3:3:3:3:3 sequence of waves must also be a triple zigzag by very definition (each wave in a diagonal must be a zigzag), then, IF this diagonal invalidates, the downward sequence must only have been w-x-y-x-z the triple zigzag - contracting in shape, and probably a wave (b).

Given the whippy and choppy price action, such a structure could well be inside a Minor 4th wave triangle. But, that's if the poorly formed diagonal does invalidate. As Ira Epstein says, "it ain't over 'till it's over". There is a question mark on the last wave because it is not over the (a) wave yet, and there is not yet a daily reversal candle-stick pattern.

Looking at the daily ES E-Mini S&P500 Index futures, here is how the (a), and (b) waves would fit into a triangle sequence, if the diagonal clearly invalidates.

ES E-Mini S&P500 Index Futures - Daily - Potential Triangle

Notice that the Bollinger Bands are now beginning to crash in on price, and that the Slow Stochastic is above 70, and already in over-bought territory. Granted, the price bias is up by virtue of the close above the 18-day SMA, and I believe the daily swing-line is now up, as well.

So, perhaps we have the makings of a triangle. Looking at the NQ futures (I will leave that exercise to you), price has already retraced more than 78% from the high to low. So, it is possible the NQ might make a barrier triangle, if the ES makes a contracting one.

It's hard to see. It's the worst time to try to predict waves as this is currently The Fourth Wave Conundrum as best as I can tell. I am letting the counting, the rules, and the invalidation levels tell me the story as best they can. My opinion is neutral.

And I am flexible and patient, and I hope you are too. 

Have a very good start to your evening.
TraderJoe

Thursday, February 22, 2018

Volatility Continues - 8

Market Outlook: Now Getting Higher Volatility
Market Indexes: Major U.S. Equity Indexes closed mixed to higher
SPX Candle: Lower High, Lower Low, Higher Close - Trend Candle
FED Posture: Quantitative Tightening (QT)

Today was a lower low day, and a lower high day. First, here is the daily chart. Today's candle has a lower low but a slightly higher close to help make a good show for television.

S&P500 Cash Index - Daily

Stocks as measured by the S&P500 Index had closed yesterday at 2,702. With the futures higher overnight, stocks gapped up to open at 2,710 and kept on climbing to a perfect 62% retrace of yesterday's candle in three waves at the 2,731 level. At 12:30 pm we called the end to the truncation of a contracting ending diagonal live and in real time in the chat room, and that likely meant the end to upward price movement.

Prices zigzagged lower into late afternoon, closed the opening gap again, made a new lower daily low at 2,698, and rebounded to close at the 2,704 level.

Tomorrow's gap direction and follow-through or reversal will be critical. IF we gap lower, and follow-through we can count a portion of an impulse lower. IF we gap up and follow-through, we can count a leading contracting diagonal lower. 

For educational purposes only we'll show you the potential contracting diagonal, and point out it's flaws. We are showing the impulse in the chat room.

S&P500 Cash - 15 Minute - Potential Diagonal


We have always counted the down wave to a as a contracting leading diagonal itself. It may be an 'a' wave or a 'i' wave, lower. The problems with this larger diagonal are that: 1) wave (v) takes up more time than does wave (iii); 2) the EWO on wave (v) is lower than on wave (iii); and 3) it is very hard to count wave (v) as a three-wave zigzag, although it can be done with an internal triangle. Finally, while not a flaw we have no evidence that downward price movement is over. There is not yet a higher daily high candle.

So, the diagonal would predict a retrace towards wave (iv). But, the flaws suggest that if tomorrow gaps down and keeps going that the middle of a third wave is a better option. A break of the upper declining trend line suggests the opposite - that the larger diagonal is in play. Again, we are counting the impulse in the chat room.

The slightly larger hourly picture is that price has only retraced 23.6% of the wave from 9 Feb to 16 Feb, and a larger retrace (at least) downward is expected.

Have a very good evening and remain flexible, patient and calm. It was just another day when they tried to convince you in the morning that stock prices were going to rise all day and they didn't. The sharp ones among you will note what time of the day the last several rallies have failed.

Have a very good start to your evening.
TraderJoe


Wednesday, February 21, 2018

Volatility Continues - 7

Market Outlook: Now Getting Higher Volatility
Market Indexes: Major U.S. Equity Indexes were lower; DJTA, RUT higher
SPX Candle: Higher High, Lower Low, Lower Close - Outside Reversal Candle
FED Posture: Quantitative Tightening (QT)

In a session worthy of the volatility, prices gapped higher at the open today, and stayed higher through the mid-afternoon, making a higher high than yesterday's candle. Prices turned lower in the afternoon, and then began breaking to levels that created a lower low day. So, we had a higher high, a lower low and a lower close. That is the very definition of an outside reversal day down.

To be consistent here is the chart of the S&P500 cash index, daily, showing the turn around and at least temporary failure at the moving averages.


S&P500 Cash Index - Daily - Outside Day Down

The market apparently knows these moving averages are there.

Today's turnaround lower might have caused consternation to the perennially bullish, or those not comfortable counting waves intra-day. However, we were able to produce a chart like this one in the live chat room as the higher high was made.

S&P500 Cash Index - 5 Minute Chart - One Day

Today's gap up was in wave 3, shown above. Then, the S&P500 began an upward-to-sideways drift than initially looked like a contracting ending diagonal at (b). But, when the (e) wave overlapped wave 3 - just barely, but it is there - and a higher high than (b) was made, we called it a rather common "running triangle".  There is a very clear "thrust" out of the triangle, that we counted in five clear waves. Wave ii remained above wave (e), and there is no overlap problem with wave iv.

Since triangles almost always precede the last wave set in a sequence, it seemed like a turn was due. It was, and prices broke lower in quite an impulsive manner. In short, the "thrust" out of the triangle was the "short squeeze" to try burn those short in the market, and make the longs feel that an immediate new high was imminent - as some websites would lead one to believe. 

Then, the turn-around and lower daily low showed those who were watching what will be in store for us at some point - like it it or not. Today's cash price range was 47 points from high to low.

With the futures still lower tonight, it is likely the decline is not done. So stay patient, calm and flexible. You couldn't have done well today unless you were all of those.

Have a good start to your evening.
TraderJoe

Tuesday, February 20, 2018

Volatility Continues - 6

Market Outlook: Now Getting Higher Volatility
Market Indexes: Major U.S. Equity Indexes were lower; NDX, higher
SPX Candle: Lower High, Lower Low, Lower Close - Trend Candle
FED Posture: Quantitative Tightening (QT)

Over the weekend, some financial rumblings in Europe (FTSE, for example) had some of these stock indexes lower. As a result U.S. futures, although initially higher, were lower for much of the holiday weekend, and opened lower.

The market as measured by the S&P500 Index had closed Friday at 2,732. With the futures lower, the cash market opened down -10 points to 2,722 and continued trading down to 2,720. Within the first half-hour, there was a feeble rally attempt to try to close the opening gap, but it failed, and stocks headed lower to 2,718 by mid-morning, the initial low of the day. From that point, there was a better rally that did close the opening gap, and then price headed to a high of 2,738 by noon.

From there, stocks sold off again into mid-afternoon reaching a lower low at 2,707 before rebounding to close at 2,716. Lots of froth and chop for everyone.

Because of the lower close, it served as confirmation of the doji candlestick from Friday, as below.

S&P500 Cash Index - Confirming Lower Close

Today price played ping-pong with the 34-day and 13-day EMA's, with it's opening and closing within those limits.

It is likely the five-wave up count from Friday is over. As most Elliott analysts know, after a five-wave up move there should 'at least' be a three-wave downward corrective movement. That appears to be getting under way. It could be the minuet (b) wave of the larger triangle minute ((b)) wave upward, or it could fall apart into something much more, lower. 

The advance-decline line and up - down volume statistics were only about 1 : 2 in favor of the losing column. So, at least as of yet, it does not seem like a full on impulse downward - but it needs to be watched carefully. Any higher high than Friday's high would be more suggestive of the Minor 4 triangle or an immediate fifth wave impulse. But, so far, that is not in evidence.

So, take it easy. watch it carefully, and have a very good start to your evening.
TraderJoe

Friday, February 16, 2018

Volatility Continues - 5

Market Outlook: Now Getting Higher Volatility
Market Indexes: Major U.S. Equity Indexes were mixed to higher; NDX, DJTrans lower
SPX Candle: Higher High, Higher Low, Higher Close - Gravestone Doji Candle
FED Posture: Quantitative Tightening (QT)

Yesterday, we said for the non-overlapping impulse pattern upward from the Feb 09 low, to remain as counted, then it's wave v should not become longer than it's wave iii, That's because it's wave iii was shorter than it's wave i. This pattern in a wedge is known as an Extended First Wave Impulse (or First Extension Impulse) and one of it's key characteristics is that the retrace after the first wave is much less than 50 - 62%; in fact, in this case it is even much less than 38%, with wave ii at about 24%.

S&P500 Cash Index - 15 Minute - First Extension Impulse


Other key characteristics are: 1) as we showed yesterday, the EMA-34 on this time frame weaves through the pattern for form and balance, and each of the larger numbered waves is on an opposite side of it, 2) wave iv does not overlap wave i, allowing the impulse count, 3) Wave iv is a flat and wave ii is a zigzag - actually a truncated zigzag, which provides alternation, and 4) note the characteristic signature of the Elliott Wave Oscillator in a First Extension wave. The momentum is highest in that wave, and then diverges on waves iii and and waves iv.

I'm not sure how many of you have seen a truncated zigzag before - except perhaps in a book. Here is one in near real time. The zigzag starts with five-waves-down to ((A)), and then has three waves up to ((B)), which does not go over the top or to the 90% level, and then a quick fives waves down that ends abruptly, and in the cash market ends before the low of ((A)) is exceeded.

This truncation or failure stop, is a sign the market has much more power to spend the upside. The subsequent day's waves proved that out - choppy as they may be.

About 12:30 ET today prices started to just break down out of the wedge, and notice the measurement from the Fibonacci ruler, that wave v remained shorter than wave iii.

In terms of the hourly picture, this upward wave just cracked the 62% Fibonacci retrace level on the hourly chart we showed yesterday. That's when the break of wedge occurred. Someone was listening! Now the key question is how much of a downward retrace is made if a larger retrace begins on Monday? Will it be 38%, 62%, 78% or will it break the low? There is clearly, no way to know for sure.

One thing to watch out for: like any doji candlestick pattern, a confirming lower daily close is needed to "activate" the pattern the pattern to the down side. Will it happen? We'll see. As always, remain flexible, patient and attentive to what messages the market is sending.

For now have a very good start to your weekend.
TraderJoe


Thursday, February 15, 2018

Volatility Continues - 4

Market Outlook: Now Getting Higher Volatility
Market Indexes: Major U.S. Equity Indexes were higher
SPX Candle: Higher High, Higher Low, Higher Close - Trend Candle
FED Posture: Quantitative Tightening (QT)

Two days ago we said any down wave yesterday could be a B wave or a second wave lower, it was. Then, we counted five waves up for you on the (YM) Dow E-Mini Futures contract. Today, the market gapped up, turned lower to close the gap, and then made new highs over yesterday's highs. It did this all without overlapping previous waves on cash or on the futures. So far, we have a count of a non-overlapping impulse up from Feb 09. Here it is on the chart of S&P500 Cash Index - 15 Minutes


S&P500 Cash Index - 15-Minute Chart - Impulse Up


Because the first three-wave sequence down to yesterday's low was much less than 38%, it was 24%, and the whole wave is in a wedge shape, it appears the first wave is the extended wave in the sequence x(i). Wave (iii) would be the clear impulse we counted up for you yesterday, and wave (iv) would be a flat that formed by closing today's gap lower. So, at this point there is good alternation and every numbered wave is on an opposite side of the EMA-34 for form and balance. The appears to be some divergence at the high. The question is if that will hold tomorrow.

Since, at this point, wave (iii) is shorter than wave (i), then a wave (v) 'should' remain shorter than wave (iii), that is, unless wave (iii) is still extending. Without clear overlaps it is a tough one to gauge. 

So, this impulse "wave-in-a-wedge" can either be an A wave up or a C wave up. If it were truly a C wave one would have hoped it formed a diagonal. It has not. Therefore, it can be an A wave up in the larger Minor 4th wave triangle, or other count (see below). If it's a C wave, it would end a running flat for minute wave ((ii)) upward.

So, just to be clear, here on the hourly chart is the triangle option. It is a valid one at this point in time. It would be expected that the ((b)) wave up crest around the 78% level, but anywhere over 62 and less than 85% is fine. The degree labels were changed from the above 15-minute chart to agree with each of the scenarios below.

Figure 1. S&P500 Cash - Hourly - Triangle Option for Minor 4

The wave locations are just place-holders only, so you can see the points of the triangle, but the degrees of the waves are correct, it is five minute waves ((a)) through ((e)) to Minor 4.

The arch rival and nemesis of this count, is the Impulse & Flat count, which is shown below as an alternate until there is more proof of it.


Figure 2. S&P500 Cash - Hourly - Impulse & Flat Option for Minute ((ii))

The purpose behind this count would be to contain Minute wave ((ii)) to the 62% retracement level and allow it to end in the vicinity of a prior (iv)th wave. One of the reasons this count works is that the down wave would have consumed 42 hourly candles, while the whole up wave is now more than 54 candles, and so would be corrective to it. The next reason the count would work is that the minuet (b) wave is well within the 1.382 exterior retrace of wave (a). This is very typical of a (b) wave.

Further, the FLAT for wave ((ii)) would indicate strong downside momentum, if it should occur this way. 

And, there is even a third option, and that the current five waves up, is only the minuet (a) wave with a minuet (b) down, and a minuet (c) up yet to go to make a minute ((ii)) zigzag. It is shown depicted in the chart below. Again, it is an alternate until there is more evidence for it.


Figure 3. S&P500 Cash - Hourly - Impulse and Zigzag Option

It should be very clear that any of these options, above is reasonable. This is the true reason that alternates exist in wave counting - because the very same wave sequences can add up to different implications. And, other than there being no sign of a pull-back or correction yet, there simply is not much evidence to go on. Yes, a top that diverges with the advance-decline line can still be made. The triangle would most likely fit that bill.

Is a zigzag down from the high, like in Figure 1, and a straight shot back up to the high, possible? Yes, it is. But, at this time, there is even less wave sequence evidence for it. Is, a zigzag sequence, like in Figure 1, and then a truncation high, possible? Yes, but then, we are back to a FLAT for the minor wave 2 sequence, for the wave four structure to alternate with it.

Do you see why there is a Fourth Wave Conundrum? I hope so. I have tried to explain in pictures as well as possible for an end-of-the-day post. Anyone who tells you that their system of wave-lengths or some such nonsense provides wave counts that don't ever change just hasn't truly met Mr. Market. It is true, in all of the above pictures, the lengths of the waves doesn't change. So what? And, keep in mind, in the latest five wave sequence up, we said it is possible, that the the internal wave iii could be extending (but it is counter to the extended first wave indication). Just keep it in mind.

Have a very good start to your evening.
TraderJoe

Wednesday, February 14, 2018

Volatility Continues - 3

Market Outlook: Now Getting Higher Volatility
Market Indexes: Major U.S. Equity Indexes were higher
SPX Candle: Higher High, Higher Low, Higher Close - Trend Candle
FED Posture: Quantitative Tightening (QT)

We said if the market opened lower this morning, it might be a good location for a B wave or a second wave down. That's how it turned out. The E-mini ES S&P500 futures had been higher over night, and traded as high as 2,677 last night, then dropped 50 points to 2,627 on the CPI report this morning, and stopped dead in it's tracks there. So, the market opened lower. 

The market as measured by the S&P500 cash index closed yesterday at 2,663 and opened down -12 points to 2,651, and traded down to 2,649 in the first fifteen minutes. Then, a few things caught our eyes. As the S&P500 made a new high today over yesterday's high, the Dow initially did not. We also noted that the Russell 2000 has exceeded 7 Feb high, and invalidated the smaller potential minute ((iv)) triangle count of a possible fourth wave lower of five to Minor A or Minor 1, lower. None of the other cash indexes or futures have done this yet, but it serves as a real "watch out" for lower counts at this time.  We also noted that the S&P500 cash index closed today over the 10-day simple moving average, and did not find much resistance at it.

Because the Dow was struggling with it's new highs, we decided to count the Dow futures today in chat room. Here is that chart, and count. Remember double parenthesis ((1)) means "circle-1" below.


Dow E-Mini YM Futures - Fifteen Minutes - Clear Impulse Up

On this count we note the high of the overnight futures at B, and then there is an Expanding Ending Diagonal C wave down, with it's characteristic "killer" fifth wave, or ((v)). 

The C wave down ends the larger ((B)) or ((2)) wave, and then the clear impulse up gets underway. In the impulse up, the wave ((4)) is at the 38% retrace, and there is no overlap between ((4)) and ((1)). Because wave ((3)) was less than 1.27 x ((1)) we even called for the possibility of a fifth wave extension, and you can see by the lower degree waves (1) - (5) that this is what occurred. 

Also notice, that each of these smaller degree waves is actually (sic) smaller than the larger degree waves. There is no wave within ((5)) which is larger than ((1)), even (3) is smaller in points than ((1)), and wave (4) is only about 80% the length of wave ((4)). So, it's degree matches, as well.

Looking at volume, you can see the up (green) volume is  the largest within wave ((3)), and again in wave (3), so that fits as well. So, what does this all mean for the longer term?

There are still two alternates which are still very, very much alive.  In the first instance, prices stay in the redefined channel, and wave Minor 4 makes a triangle, as below.


S&P500 Cash Index Weekly - Minor 4 Possibility

In this case, again, the purpose of a Minor 4 triangle is to better equalize the net distance traveled between Wave 2, and Wave 4. Because a triangle always provides alternation, this is seen as acceptable with the sharp wave 2. Here again, I am showing you the points traveled by wave 1, ((i)) and ((iii)) of Minor 3 so that you can clearly see that they fit into degree sequence. Minute wave ((i)) of Minor 3 is just smaller than wave Minor 1, minuet wave (i) is definitely smaller than Minor wave 1, and smaller than the minute wave ((i)) within Minor 1. And minute wave ((iii)) is also much smaller than wave Minor 1. Wave minute ((ii)) is also smaller than Minor wave 2, and both wave minuet  (ii)'s are smaller than minute wave ((ii)). So, they all fit.

Now, in order for Minor 4 to be smaller than Primary ((4)) at the lower left in February 2016, the it should most likely form as a triangle. That would be typical of the way a bull market can end. This count might allow the EWO to come back near the zero line, so it can't be dismissed, but it will take weeks and possibly months to complete. Given the length in time of Minor wave 3, however, it seems reasonable.

The alternate to this count is that the bull market ended at 3, as Wave Intermediate (5) in the  EWI-style count which I have shown you, and corrected their degree labeling on.  Then, the wave marked 4 is actually Minor Wave 1, down, in five waves, that we were able to count.

One sign that it is the latter count would be that a prior fourth wave location holds, or a 62 - 78% retrace in the upward direction holds, and momentum picks up to the down side. Again, I have no preference over which count it is.

Right now, flexibility, caution and patience are your weapons of survival. Use them! And have a Valentine's Day filled with love and joy. After all, that is much more important!

TraderJoe 

Tuesday, February 13, 2018

Volatility Continues - 2

Market Outlook: Now Getting Higher Volatility
Market Indexes: Major U.S. Equity Indexes were higher
SPX Candle: Lower High, Higher Low, Higher Close - Inside Candle
FED Posture: Quantitative Tightening (QT)

Not much new to report today. Stocks as measured by the S&P500 closed yesterday at 2,656. The overnight futures were lower, so stocks gapped down lower trading down -19 points to 2,637, and then, beginning around 09:40 ET, stopped the decline, and turned around higher to closed the gap in more whippy trade. By the close stocks did not make a new daily high, but reached 2,669 before turning slightly lower to close at 2,663; up about +6.94 points on the day.

None of yesterday's scenarios is ruled out by today's inside day. IF tomorrow opens lower again, it might be a good candidate to suggest a B wave down or a 2nd wave down is in progress. It should be noted that volume is falling off today - might be the slow volume that occurs in a triangle.

Have a good evening,
TraderJoe

Monday, February 12, 2018

Volatility Continues

Market Outlook: Now Getting Higher Volatility
Market Indexes: Major U.S. Equity Indexes were higher
SPX Candle: Higher High, Higher Low, Higher Close - Trend Candle
FED Posture: Quantitative Tightening (QT)

From the weekend post, we were expecting some modest up movement. That did occur today. The potential count of a downward diagonal on the Dow which we showed last Friday) did not invalidate on the Dow. But it did invalidate on the S&P500, and it's Elliott Wave Oscillator signature on the Dow is not correct. So, we consider that count dead.

To be objective, the only count we see that allows the market to revisit the highs and make a minor wave 5, is that we are currently in a Minor Wave 4 triangle. Here is the reason for this based on charts we posted today in the live chat room. It is something that likely few others noticed.


S&P500 Cash Weekly - 2018 Exceeds 2015-16

The whole down turn so far in 2018 exceeds in points the number of points of the down turn in 2015-2016 which is Primary ((4)), as it is currently measured. As you know from the very definition of the term degree, you simply can not have a smaller degree wave, say Minor 4, exceed the larger degree Primary ((4))th wave in points. It violates the definition of the term degree.

This also must rule out an Intermediate wave (2) of a larger contracting diagonal. Because neither can an Intermediate Wave be larger in point size than the Primary Fourth wave.

The only way I know of for the market to potentially correct this situation is for Minor wave 4 to become a triangle. As I understand it, because triangles are measured from wave 3 to the triangle's wave (e), then it is possible this wave could have measurements smaller than 2015 - 2016, but only if a contracting triangle is formed, and if it starts as a clear zigzag. If it doesn't do this, then the upward count is over and ended at the highs as far as I can tell.

Again, a triangle must start with a zigzag downward. If this wave turns into a full-on impulse, downward, then the upward triangle is dead, and we are likely headed much lower. As of today, the odds stand at about 45:55, upward triangle versus downward impulse. Here is why.
  1. There are still two (actually three) ways to count a downward impulse 
  2. There is one way to count an upward triangle
The two ways to count a downward impulse, are first, Impulse down, A, up. That count is shown below.


S&P500 Cash Index - Hourly - Downward Impulse Completed, A Up

In this case, then wave (5) = 0.618 x net [ (1) through (3) ]. There is nothing wrong from a 'rules' standpoint with a wave like this. The only concern is that wave (4) is quite large and disproportionate compared to wave (2).

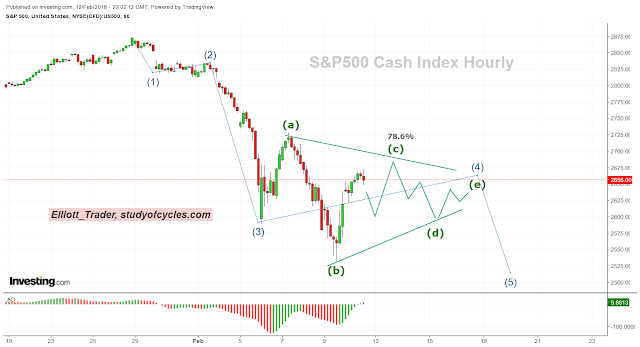
The second way to count a downward impulse, is as an impulse with a wave four "running triangle" still in progress. That count would look like this. For this count, it would be best if wave (c) held  the 78.6% level of the retrace on wave (a).


S&P500 Cash - Hourly Running Triangle (4)th Wave Incomplete


The very purpose of this "running triangle", is to better equalize the net distances traveled by waves (4) and waves (2), and to keep the downward movement alive with it's lower (b) wave. Further, now that price has hit the lower weekly trend line, this would be a move that breaks that trend line and perhaps generates the real bearishness needed to start a 62% retrace.

So, those are the two most likely ways for downward travel to immediately continue.

Yet, for the upward triangle, instead, then the move would have to be counted something like this.


S&P500 Cash Index - Three Waves Down in a Minor 4 Triangle

In this case, one would have to count downward, A-B-C, where C = 0.618 x A; still a somewhat common relationship between the waves.

And, yes, this does make that third potential downward count. If A = 1, then there could be an upward FLAT forming wave 2 instead of a zigzag. And, perhaps that FLAT would end at the fourth wave of one lower degree. 

Due to the extreme uncertainty in counting at this moment, from a wave-labeling perspective, it might be best to let a few waves "shake out" and see where they land.

Have a good start to your evening.
TraderJoe