Wednesday, July 31, 2019

Five Waves Down to Minimum Retrace

The S&P500, the SPY and the ES completed five waves down, as suggested by the dotted declining trend lines in yesterday's post. For emphasis, this count is shown below.

SPY - 15 min - Five Waves Down as a Diagonal

In making the five-waves-down, the 'minimum' objective for the move lower was obtained. See chart below. Now it is a question of whether the small-degree diagonal, above, is an ending or a leading one.

ES E-Mini S&P500 Futures - 4 Hr - Five Waves Down to Minimum Target


The downward overlap on minuet (i) - from previous posts - was the first target for a down wave. You can see by the overlap that the target has been obtained. IF the diagonal is an ending one, then the down move is over as minuet (c) of minute ((b)). IF the diagonal is a leading one, then only the sub-minuet wave i, of minuet (c) is completed today. The secondary target is the approximate 2,900 level where the weekly up trend line is located, along with the 100-day SMA.

Any lower lows suggest the diagonal is leading. To invalidate a leading diagonal a new all-time high would be required. From strictly a time perspective, the waves would look and measure much more proportionately if there was indeed additional downside movement.

Remember, tomorrow is the first day of the new month, with potential inflows, and then Friday is the Payroll Employment Report.

Have an excellent start to your evening.
TraderJoe

Tuesday, July 30, 2019

FED Next

Yesterday it was offered that if a third wave down was to start it would likely happen in the overnight or before noon. It did. Then, there were three waves up, which included an overlap.

SPY - 15 Minutes - Lower Low and Overlap

Because there are several patterns that can resolve themselves, including the possibility of an internal triangle (shown in blue), I am neutral until after the FED results. There tends to be a bit of volatility on FED days, and it would be best to see which pattern that volatility best fits with.

There is no reason lower lows couldn't be made, and if I look back to the low on 25 Jul there is also no reason that an even larger triangle could be a play, and that could even result in new highs. I have no particular vested interest in which occurs. So, caution, patience and flexibility are the continual by-words at the moment.

Have a good start to your evening,
TraderJoe

Monday, July 29, 2019

Four Busy Days

First, relative to the wave count, if there is to be a third wave down, it should likely start in the overnight tonight, or no later than noon tomorrow. So, you might like to monitor that.

SPY - 15 Minutes - Possible Start of Minuet (c)

It was very interesting coming into today that the overnight gap was not a higher one. That initially seems to reinforce the above short term count of the minuet (b) wave up. There appeared to be three waves up after the opening drop - right to the the 62% retrace level on SP500 cash - and so it is possible this represents a second wave up 

Prices did fall off from that level into the end of the session, and if they continue we may get a third wave down. If so, it should be a 1.618 length wave, or more. If a lower low occurs but it is not a 1.618 wave, a diagonal 'might' be suspected based on the position of the futures.

The best alternate I can think of at the moment is that today represented another 'x' wave down (shown in red). There is no rule-based reason why the minuet (b) wave could not become a triple zigzag, but triples are pretty rare, and it would be pretty poor form, since the minuet ((a)) wave diagonal represents a triple zigzag in the ES. So, a further triple zigzag for a (b) wave would be very poor alternation. Therefore, the alternate is only that, and would require prices to go over the high first.

This week of course is a full slate of earnings, another torrent of economic reports, and the report-out of the Federal Reserve decision on Wednesday. But beyond that, Wednesday is the end of the month which often (not always) brings some sloppiness from "window-dressing" activities, and then Thursday is the "first of the month" with potential inflows from company bonuses, pension fund and 401k reinvestments, dividend reinvestment plans, etc. Because this is a mid-week change in the month - and not the end of the quarter - the impact might be a little more subdued but is still to be watched for.

Have a good start to your evening and to your week,
TraderJoe


Friday, July 26, 2019

Still in Minuet (b)

Yesterday's post outlined a "five-down" count. We said that if new lows didn't result, the expanding diagonal could have been "ending" and not leading. Today made marginal new highs. The expanding diagonal was ending.

All that likely means is the minuet (b) wave upward is likely extending in time (mostly) and somewhat in price. Here is the updated chart.

ES E-Mini S&P500 Futures - 4 Hr - Longer Minuet (b)

So, the 'invisible' WonderWave from the ECB presser was a flat for the x wave label shown above, and the five-down diagonal was the 'c' wave of that flat. (Remember in the overnight, prices went down, then up, then down big.)

The result is there is a new "three-touch" trend line which is to be respected from a wave counting perspective until it is broken lower. If and when it breaks lower, it will likely signal the onset of the minuet (c) wave of minute ((b)) wave lower.

The reason we have a high degree of confidence in this count is that all of those that were counting a diagonal to Minor 5 of Intermediate (5) at the mid-July high, and there were several, now have extra waves to deal with. The count above does not share that problem. That is very, very encouraging.

Here was my short term wave count over the last two days of observing the ES E-Mini S&P500 futures. 

ES E-Mini S&P Futures - 15 Minutes - Extension of (b)

At the end of the futures session (5 PM ET), there was about a six-point give-back. One internal trend line was broken, and the market may have established that it has taken out the previous fourth wave in less time than it took to form. But further, if a downward wave travels below 3,018 it would likely become the largest downward wave on the chart, and potentially signal a degree change.

Ask yourself if anyone can provide commentary with such specificity and so few words?

Have a great start to your evening and to your weekend.
TraderJoe

Thursday, July 25, 2019

Invisible Wave

I have been commenting recently how little cash and futures are having similar patterns lately. I have seen this before so it is no major surprise, but several days in a row really makes one scratch the head and give pause.

The futures trade around the clock - much like commodities do - and this morning, there was a (not) WonderWave from the ECB Press Conference on the left hand side of the chart.

ES E-Mini S&P500 Futures - 5 min - Intraday

You won't see any of this wave in the cash market. Cash opens with a gap down. The WonderWave was created when Mario Draghi 'promised' to do whatever is needed. The WonderWave disappeared when he provided virtually no details. Markets reversed hard, in their fastest turn in a while.

At the end of the day, I had some other chores to do and couldn't stay with the close. But, in looking over the intraday chart in the after-hours, I couldn't help but wonder if "five-down" was, in fact, made as an expanding diagonal.

Although the wave fits the price measurements with ((5)) greater than ((3)), ((3)) greater than ((1)), and ((4)) greater than ((2)) and overlapping wave ((1)), the interesting thing is it may also fit the same expanding time measurements.

But, even though the pattern is still apparently there, I would like to see more downside follow-through including taking out the b wave low that was noted yesterday. Otherwise, the pattern could be ending instead of leading.

Cash would not count like this yet.

Have a good start to your evening.
TraderJoe

Wednesday, July 24, 2019

Mixed Results

Today, the Dow was down while some other indexes made new all-time highs. As a result and considering all degree labels as best as possible this is the best count on the ES E-Mini S&P futures from the June 2nd low.

ES E-Mini S&P500 Futures - 4 Hr - Leading Diagonal Minute ((a)) and Now ((b))

The degree labels of interest are the down waves in mid-July. Each one is shorter than the down wave to the end of June. So, there are three waves down to a minuet (a) wave, and three waves up, so far, to the minuet (b) wave.

It was correct to call yesterday's up wave a five-wave diagonal move in the futures. It did turn out to be a leading diagonal instead of an ending diagonal. Nothing to be done about that .. that is the pure equivalency of various alternates: the same exact pattern can have two fundamentally opposite meanings in Elliott Wave theory - even if the wave itself is counted properly, which it was.

We showed the above count for the NQ (NASDAQ 100 futures) in the weekend video on July 14th. Today's higher high makes that count the more likely one for the ES, too. It is getting virtually pointless to count the cash market because the futures are making extremes that cash is not. But, even the futures are compressed at times like never seen. It would be nice to see a real, clear impulse wave. Maybe soon. Yes, the expectation from the above chart is that there would be a minuet (c) wave lower, to a minute ((b)) wave. However, there is no claim that such a wave is underway until the sub-minuette b wave of minuet (b) is exceeded lower.

Today's new high was made on another divergence of the oscillator.

Have a very good start to your evening.
TraderJoe

Tuesday, July 23, 2019

More Time

The upward wave in the ES hourly futures, shown below, now takes more time (at 90 bars) regardless of where the downward a/i wave (max 64 bars) started. Therefore, the upward wave should be corrective to the downward wave.

ES E-Mini S&P Futures - Hourly - Upward Correction Takes More Bars

Overall, the count would be a/i, down, and  b/ii, up, with a c/iii down to follow, where b/ii, up, is a flat wave. Cash S&P did not make the lower low at .b, like the futures did, but it darn well did make the 90% level lower. Hence, a flat correction is allowed by the rules.

We do not know that the upward correction is finished. But, there is the clear potential makings of a very rare ending expanding diagonal. If the goal of the upward .c wave was to get above the upward .a wave, to avoid a truncation, it did not do it by futures settlement time. It could easily do so in the after-hours, however. None-the-less, we thought it helpful to readers to show what this pattern is like in near real time.

If this is an overall minute ((b)) wave down, then it is no wonder than the count is so explosive and choppy all at the same time. B waves are among the hardest to count and one never knows if they will be simple zigzags or triangles or some other "three". So, we do the best we can.

IF (again, IF) the diagonal winds up to be an ending expanding diagonal, then the start of it must be exceeded lower in less time than the diagonal took to build.

Have a great start to your evening.
TraderJoe

Saturday, July 20, 2019

In Perspective

The chart below shows why downward movement was expected at this time and is occurring in relative perspective to the overall double-zigzag, upward, in U.S. equities.

S&P500 Cash Index - Daily - Targets

The 'minimum target is that this likely minuet c wave down of the minute (b) wave, down, overlaps the prior minute (a) wave, which would likely also overlap the prior April high. However, a more likely target is to travel down to the 2,900 level to contact the daily up-sloping trend line, and, perhaps even make a breach of it lower to generate some really bearish opinions before heading higher.

The alternation would be that within minor W, the minute waves formed a zigzag, and within minor Y, the minute waves formed a flat.

Have an excellent start to the weekend.
TraderJoe

Thursday, July 18, 2019

Five Down and Flat

Same exact count as yesterday in the S&P500 cash index chart below. This morning we noted the marginal lower low and said a flat wave could form. It looks and measures, so far, like it has.

S&P500 Cash Index - 15 Minutes - Five Down and Flat Wave

Because wave a, upward, is longer in price than wave ii or wave iv, it can not be a sub-wave of a larger down wave. Therefore, it must be the first wave of a new upward flat wave. That is what we mean by "turning a degree". However, b, which is a downward wave, is shorter than wave v which preserves degree labeling.

So far, in the up wave, there are only three waves up, showing. A common expectation of an expanded flat correction - which is the most common among corrections - is c = 2.62 x a. We already know that the wave has made it back to the territory of the prior fourth wave which is 'often', not always, a stopping point for a larger B wave in a (larger) zigzag. This is one of the reasons to try to get the count from the top correct and not include the truncation.

We're not sure we are correct - only that, so far, measurements, degree labeling, and adherence to the 0 - 2 guideline seem to indicate so. If wave c wishes to, in order to waste more time, it may become more of an ending diagonal wave to use more time without taking up much more price.

Have a good start to your evening.
TraderJoe


Wednesday, July 17, 2019

The 'Few More Waves' Seem to Indicate 'At Least' An Interim Top

Few listen. Few care. Today during the trading day I posted a link to this ES 30-minute chart, which I had drawn up with the specific intention, again, to see if anyone is listening with regard to degree labeling. 


People that saw this chart should have been screaming that the supposed a wave of ((4)) was larger than the whole previous wave ((2)). That is a clear and unmistakable degree violation. One is saying a smaller degree wave is larger than it's larger degree counterpart. But, there are other degree violations too. Wave ((4)) - smaller degree wave than i, is longer in time than all of i! That is just as much as degree violation in time, as the former one was in price!

Perhaps one person was on the right trail when they asked if the up wave was over. But, they did not cite the potential reasons why. My point is that people 'should' have really beaten up that chart. What did I get? Silence.

Here is the correct count.

SP500 Cash Index - 15 Minutes - Correct Count

Clearly you can see the diagonal downward did not overlap the prior wave i and is still probably in the fourth wave position. Clearly, you can see that it did not take out the fifth wave of iii in less time than that fifth wave took to build. 

Clearly you can see the only wave that took out it's prior wave in less time, was the new location of i down.

So, what we most likely have is a truncation top. And, if the top truncated that means it also can not be a leading diagonal wave. Ponder on that one. "If the top truncated, it can not be a leading diagonal wave up to that point."

I'll let you sit with that one overnight.
TraderJoe

Tuesday, July 16, 2019

Three Waves Down

From the weekend video, we said sudden set-backs could be expected at any time. Today resulted in only three waves down.

SPY - 15 Min - Three Waves Down

Yesterday, we counted out a potential diagonal lower in real time. Today, that diagonal was confirmed as a leading diagonal. Absent more information we have three waves down from the high, down to a c = 1.618 x a, and then an upward overlap.

As a result more information is still needed. If it's a complete correction it seems very short in time. Three waves could also go on to form a triangle or a diagonal. As a result more waves are needed for the market to show us what it might have in mind.

Have a good evening.
TraderJoe

Monday, July 15, 2019

Mixed Market

The NASDAQ 100 (NQ) futures made a marginal new higher high today. For this reason we need to show the clear invalidation level of the potential 5:3:5:3:5 Diagonal in the NQ futures. The invalidation would be because the fifth wave is not allowed to be longer than the third wave in price.

NASDAQ 100 - NQ Futures - Invalidation Level

So, even with the divergence on the Elliott Wave Oscillator on a four-hour chart, beyond this level (about 8,045 - given the accuracy level of this particular tool) a 5-3-5-3-5 diagonal would invalidate, and a different count must be in play for this index. Because each of the waves is shorter in time and in price, it could be that an impulse would explode upward in a third wave, but that seems to run directly into the upper daily Bollinger Bands. Not impossible, but the presence of the upper band raises a caution.

Kindly remember, different indexes can do different things at times. Just look at the Russell for an example. It's still time to remain patient, calm and flexible until there is more information.

Have a good start to your evening and your week.
TraderJoe

Sunday, July 14, 2019

New Weekend Video Update

Here is an automated Elliott Wave Video Report prepared for any idle hours you have over the weekend. To be respectful of your time and mine, the video is kept to about 7 minutes.


The video may best be viewed in full-screen mode.
TraderJoe

Thursday, July 11, 2019

Powell Re-spaketh

On the second day of Fed Chair Powell's testimony, this time before the Senate Banking Committee, there was no change in the overall count. 

SP500 Cash Index - 2 Hr - In C Wave Up

Today, we spent most of the time trying to count this next impulse up, and, in particular, counting the long "triangle-shaped" fourth wave as below.

SP500 Cash Index - 15-min - Finishing Fourth Wave

It was surmised that because the ((A)) wave of the fourth wave was so deep, and rather quick that a triangle might form. It was also noted where the 0 - ii trend line (from 2 / b) is on this chart, and that the trend line broke. This means we are not likely in a continuing third wave, and are just waiting for the fourth wave to wrap up. The ((C)) wave of a potential triangle made another 78.6% retrace on the ((B)) wave - which was shown live during the day, and then a potential ((D)) wave took off upward back towards the highs.

This wave absolutely does not have to form a triangle. If the market is unusually strong, then the fourth wave could have ended as a truncated flat at the ((C)) wave low. Still, the wave is taking so much time, that the ((E)) wave of a triangle should be allowed to form before a fifth wave higher. In other words the triangle has a 'high likelihood' of forming properly. Now, it's just a question of if it does. 

The pundits are already out on T.V. claiming Dow 33,000. That gets my sentiment antenna up, making me say I am "neutral only - and counting towards a top". I will have more to say about that on the weekend.

For now, have a good start to your evening.
TraderJoe

Wednesday, July 10, 2019

Powell Spaketh

Stocks rose on dovish comments from FED chair Powell testimony in front of the House Financial Services Committee. There is now a new 0 - 2 trend line until there isn't.

S&P500 Cash Index - 2 Hr - New 0 to 2 Trend Line

This A, B count in SP500 also recognizes that there was downward overlap in the SPY at B, as well. The current 1 / a, 2 / b is in recognition that the C wave up 'could' be starting a diagonal, but there are insufficient waves to make that claim yet.

Have a good start to your evening.
TraderJoe

Tuesday, July 9, 2019

Corrective Wave Down

So far, a corrective wave down has played out as anticipated and held above the ES 2,952 level - which would separate a "second" wave, lower, from a larger "B" wave lower. As of the cash close today, the downward wave is best counted as a double zigzag because of the unmistakable contracting diagonal we counted out live yesterday. 

SP500 Cash Index - 15 Minutes - Double ZZ

If the diagonal wave to "a" is not counted as part of a zigzag, it results either in degree violations or lack of alternation (take your pick - I want neither). But, also note that since (y) is slightly longer in both time and price than (w), then the wave could be the start of an expanding diagonal lower. And that is shown as the alternate count (i), (ii), (iii).. in red, so far.

For the diagonal to occur, however, wave (iv) must become longer in price than wave (ii), but still stay below the high of wave (ii). And those are some pretty finely structured criteria. But, the reason for mentioning it is that it could be a larger "a" wave down in a larger "B" wave lower.

Of course trading above (ii) would invalidate that alternate.

That's all for today, except we are happy to say we were ready for the price spike at the end of the day as we had earlier counted out this five-minute contracting diagonal on the Dow.


It was just a question of whether prices went under the low of the morning or over the high of the diagonal, first. They exceeded the high first - making the structure a contracting leading diagonal shown to you in near-real-time.

Have a great start to the evening.
TraderJoe

Monday, July 8, 2019

Dow Hourly

Without the overlap noted in the futures, the DOW cash index may best be counted as "five waves up" to the minute ((a)) wave, of the Y wave of Intermediate (B), as follows.

DJIA Cash Index - Hourly - Minute ((a)), Up?

Reviewing the Elliott Wave Oscillator, this is the case where the first wave is the "extended wave in the sequence", and makes the highest high for the EWO. This wave is designated as x (i). Then, each subsequent shorter wave makes a lower high on the EWO. 

I watched that Dow triangle form on a different time scale (much as  the S&P500's triangle) and it fits in this location just fine as a fourth wave triangle. In this case, the triangle's a wave is likely a flat. One leg of a triangle is allowed to be some corrective structure other than a zigzag, and this is thought to be the case for length purposes in minuet wave (iii).

If the ES futures break below 2,952 as noted previously, then this is probably the best way to count the S&P500 cash index, as well. As noted previously, there is a discrepancy in contract months on the ES futures as to whether there is overlap or not. There is not such overlap in the Dow (YM) futures.

Have a good start to your evening, and to your week.
TraderJoe

Saturday, July 6, 2019

Weekend Video Update

Here is an automated Elliott Wave Video Report prepared for any idle hours you have over the weekend.


The video may best be viewed in full-screen mode.
TraderJoe

Thursday, July 4, 2019

Holiday Video Report

Here is an automated Elliott Wave Video Report prepared for any idle hours you have over the holiday if you are in the U.S. If you are not in this country, then all the best wishes for a good week and weekend.


The video may best be viewed in full-screen mode.
TraderJoe

Tuesday, July 2, 2019

Nearing the High

Yesterday, our post included the possibility of a fourth wave triangle to better equalize the time spent in a fourth wave with the time spent in a second wave. Today's trading broke outside the channel and did create a triangle as shown on the continuing chart, below.

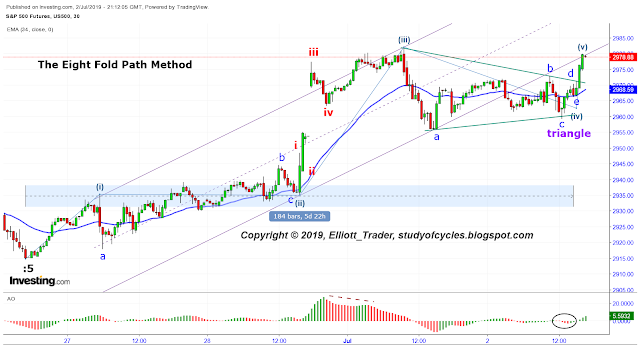
ES E-Mini S&P500 Futures - 30 Minutes - Triangle & Thrust

We counted out this triangle live and in almost real time for readers here. It is not our intent to do that often, but we wanted you to see how The Eight Fold Path Method can help predict the path of a potential impulse wave. Besides better equalizing the time between waves two & four, the triangle also helps provide alternation. Notice that the running wave (ii) has its b wave over the high of wave (i). The triangle with it's lower b wave than wave (iii) is the reason that a triangle was a good alternate for the fourth wave.

A further purpose of the triangle is to take up more time than wave (iii). And this it does, as well.

You will also note that as a cross-check, the EMA-34 shows that every significant numbered wave in the impulse - as well as the significant lettered waves in the triangle - are on an opposite side of the average which provides excellent form and balance. Notice, too, that the triangle brings the final reading of the Elliott Wave Oscillator for the fourth wave much closer to the zero mark than does that first a wave of the triangle.

At the end of the day (actually after the close of the cash session), the futures popped, and are likely providing that fifth wave. As such, wave (v) is bumping up against the underside of that channel. Does the market know that channel is there? Prices keep on being drawn to it at (i), (ii), (iii), a, b and (v). The triangle was largely expected as 'consolidation' after the first-of-the-month, and first-of-the-quarter inflows, news on trade talks and the lighter holiday volume.

At the end of the day, wave (v) is well beyond a 78% retracement - the minimum needed to claim a truncation - so even if we never see higher prices, the wave will be counted as a fifth wave.

There is another brief alternate, and that is that prices form another type of triangle from the same set of waves - and that is a "barrier triangle". This is not required, but it could happen. For that to occur, then the cash price should attempt to bang into a horizontal line drawn from wave (iii) a couple of times before popping the high. This could happen, we'll watch for it.

Have a good start to your evening.
TraderJoe

Monday, July 1, 2019

Potential Impulse ES Only

Here is a repeat of the intraday chart we showed (in the comments section today by link) on the ES E-Mini S&P500 Futures in the half hour time frame.

ES E-Mini S&P500 Futures - 30 Minutes - Potential Impulse

While the Dow Jones Industrial Average does not have this structure, and, in fact, overlapped the waves on June the 28th, with about 140 candles on the chart for the 'wave of interest', the ES futures did grab a hold of the lower channel line and rescued the plausibility of an impulse count in a channel. It is not for certain, yet, though.

Wave iii of (iii) is on the maximum of the Elliott Wave Oscillator, and wave v of (iii) is on a divergence. Wave (iv) is a sharp to potentially alternate with the very sideways wave (ii). It is possible to chew up more time, if needed, that wave (iv) could become a triangle. Further, a wave iii likely has traveled beyond the upper channel boundary to show the location of maximum momentum.

Because of how deep this wave (iv) is already, I would not want to see prices trade below 2,955 or today's low before making a new high to call the structure an impulse. If an impulse is not properly formed, then we may just have another three-wave-structure to find a home for in the wave count. But we'll provide the impulse count a good shot at it.

Have a good start to your holiday-shortened week!
TraderJoe