Wednesday, September 30, 2020

Minute Wave ((a)), Up

We were looking for a fifth wave up today. That occurred. There are now enough waves to call a minute wave ((a)), up, after the Minor A wave down. Here are the five waves for minute ((a)) on the ES hourly chart.

ES Futures - Hourly - Minute ((a)), Up
 

Today in the comments for the prior post we showed one way to consider the up wave as completed. But because there were no critical downward overlaps, it is possible that the wave is still in progress, and a higher high overnight or tomorrow could also occur and be a part of the same wave. The end of the day was very volatile and may have represented the end-of-the-quarter window dressing.

Tomorrow is the first day of the new month and it is possible to see some new inflows from mutual funds, pension plans, company bonus plans, dividend reinvestment plans and the like. If tomorrow does not bring in such inflows, and the hourly channel breaks substantially lower, then the likelihood would be that were are in the minute ((b)) wave, down, of the Minor B wave, up.

Have a good start to your evening,

TraderJoe


Tuesday, September 29, 2020

Chop-fest in a Channel

Based on the prior posts, we said yesterday we were expecting five-waves-down in the form of a flat wave. Today, that did occur as five non-overlapping waves downward, shown below.


As a result, the minimum target expectation of a flat was met as prices traded below the prior a wave low, shown. The waves were choppy and tricky. Following the five-waves-down, prices traded sideways-to-upward, and remained in the downward channel shown.

Given the Presidential debates tonight, one might watch for a break up out of the channel or a break down through it. There is still room for a larger fourth wave lower on the half-hourly chart if the market wishes to continue lower, but it is not required. Interestingly, cash has met its lower channel line; futures have not.

In no case may the current upward wave trade above the b wave terminus and still be a downward wave. Further, if the current upward wave becomes longer in price or time than micro wave ((2)), it suggests that the market is no longer impulsing downward.

Have a good start to the evening.

TraderJoe

Monday, September 28, 2020

Move-Up Monday

After finding support at the 3,200 price level, the lower daily Bollinger Band, and the 100-day SImple Moving Average (SMA), shown below, price suggested in Friday's post  that the diagonal wave formed in the downward direction was completed, and that there was a break of the upper diagonal trend line. Today's upward gap and price subsequent follow-through made a wave that was larger than minute ((iv)) and larger than minute ((ii)) of the Minor A wave down. Therefore, degree analysis also confirms the beginning of a Minor B wave up.

ES Futures - Daily - Minor B

Now that Minor B has begun, the Elliott Wave analysis of it should consider the following factors: the daily slow stochastic - which was embedded - has not yet fully worked off its oversold condition. When the daily slow stochastic loses its embedded status, price and the 18-day SMA often try to come together. Today price missed the 18-day SMA by about 2 - 3 points as of the settle. One should note that the upper daily Bollinger Band is folding down under the prior high as of this time.


With about 105 candles on the chart, The Eight-Fold-Path-Method (see featured post) suggests that a fourth wave (iv) could form as a flat wave down into the area of the prior wave iv. There is a gap in the futures from Sunday night. Often, these fill more a bit more quickly that the ones in cash. Since wave (iii) is  the extended wave in the sequence, with greater than a 1.618 extension, then wave (iv) should not overlap wave (i) without having implications for the larger count.

It is possible this up wave - if it completes as an impulse - is forming the minute ((a)) wave of the Minor B wave. If overlap on wave (i) occurs before a new high, we will deal with it at that time.

Have a good start to your evening and to your week.

TraderJoe

Friday, September 25, 2020

Float-Up Friday

Bottom line: the diagonal that looks and counts the best on the 4-Hr chart is the one in the chart below. Each of the sub-waves of the minute waves is shown. They are shown as simple a,b,c instead of the required minuet (a), (b), (c) just for chart clarity.


The lead-off wave on the left is an a-b-c where the c wave is itself an ending diagonal. There is really nice divergence with the Elliott Wave Oscillator (EWO) on each of the subsequent lower lows waves, the pattern converges in both price and time, and price has now, today, pierced the upper declining diagonal trend line.

In piercing the upper trend line, the upward Minor B wave now is already a Fibonacci 23.6% x the Minor A wave. This is actually already sufficient for a Minor B wave, but it certainly can grow longer if it likes.

Today, we counted the upward wave from Minor A as a potential double zigzag, but it went a tad farther than expected, the (y) = (w) at 100% level. Therefore, while we won't know until we see Monday's trading, it is possible to make a larger impulse wave, up, particularly if price hits the 3,320 level in the futures which would be a 1.618 extension, as in the chart below.


We note that on the half-hour time frame, the Elliott Wave Oscillator is still green, rising, and has a higher high. Further, there will be no downward count until the Minor A wave is breached lower again - whenever that might occur.

Have a good start to the evening and to the weekend.

TraderJoe


Thursday, September 24, 2020

Diagonal

Today's lower low confirmed that a diagonal wave likely has or is taking place. You can read the prior post's comments to see how this has developed. Here again is the ES 4-Hr chart.


A lower low tomorrow that meets the criteria of ((v)) less than ((iii)) would pretty much cement the nature of the diagonal as the 3-3-3-3-3 variety. Today, we counted only "three-up" from the low, and then five-down from the high. So, the lower low is likely (not imperative).

The blue curve on the chart is the EMA-34, the green dots are the EMA-13. Today we said we might expect some resistance at the EMA-13, and that is what occurred in real time. You can see the tail at that level.

If the lower low forms and meets the criteria, we will diagram the three-wave internal structure at that time, and provide a better perspective on the daily chart.

Have a very good start to the evening.

TraderJoe

Wednesday, September 23, 2020

Direction Correct - Triangle or Diagonal

Based on yesterday's post, we we expecting a downward wave today, as the minuet (b) wave of the possible running triangle shown in yesterday's post. Therefore, we were fully prepared for downward movement today. Last night, the futures added to the gains of yesterday, and the additional wave now makes the up move amorphous. Is it a three-wave sequence or a five-wave sequence? This is exceptionally difficult to discern.

Let me be clear, as of this writing, nothing has invalidated in the potential running triangle count. But, the most recent up wave being either corrective or impulse, and today's very deep wave must force real consideration of this count, as well.

ES Futures - 4 Hr - Alternate Diagonal

This five wave declining and contracting diagonal still needs to be proven-out with a lower low wave that remains shorter than wave minute ((iii)). So, too, does a running triangle need to be proven out. A lower low in futures and cash would invalidate the running triangle count.

This post is being written 10-minutes before today's close. Let's see how it goes. We may or may not get an answer today. If not, tomorrow is equally acceptable. The level to watch is 3,217.75 in the Dec futures.

TraderJoe

Tuesday, September 22, 2020

Hourly Cash Fills a Down Gap - Suggests Triangle or Flat

Hourly cash today filled a downward gap, shown on the chart below, with a five-wave-up sequence. And, even though the potential fourth wave location in yesterday's downward channel count did not technically invalidate, this suggested that a triangle or flat is being made as per the revised chart, below.

SP500 Cash Index - 1 Hr - Triangle or Flat

Today there were five waves up. This occurred after the down wave traveled to 1.618 x the minute ((a)) wave, upward, on a divergence with the Elliott Wave Oscillator (EWO). The ((b)) wave downward counts best as a three-wave sequence. The 1.618 Fibonacci level can suggest either the triangle, first, or the flat. It would be less common for a triangle to directly follow a diagonal. But, it is also fairly rare for flats to have 1.618 ((b)) waves. Thus, the odds are roughly equal for the two patterns.

IF a Flat is made, then the ((c)) wave up will be in five waves. And, it might, or it might not exceed the level of the minute ((a)) wave. As a "running flat" or "truncated flat", it might stop short.

The new minuet (a) wave up, has already upwardly overlapped the Minor A wave down. In both cash and futures, the minute ((b)) wave is shorter in both price and time than the Minor A wave down. These are very difficult and compressed waves for beginners to be learning on, as there are few good impulse sequences. This is obviously by FED design; they are trying to make sure it is difficult to profit from any downward movement.

Have a good start to your evening.

TraderJoe

Monday, September 21, 2020

Waves In Channels

This is the count so far. The waves are in two different channels, and they are not all that impulsive looking yet. They could turn into something more, so keep in mind that A,B,C ~ 1,2,3 until it is proven that it does not.

ES Futures - 2 Hr - Channel

Watch the potential invalidation of minute wave ((iv)), and the channel boundaries. The advance decline stats today were 443 : 2,643 which is much more on the impulsive side.

Have a good start to the evening.

TraderJoe

Friday, September 18, 2020

Next Wave Lower Confirmed

In yesterday's post, we showed a plausible way that the next wave lower could complete as a five-wave sequence. Today, that expectation was met, as shown by the first chart of the S&P500 Cash Index.

SP500 Cash Index - 15 Minute - Next Wave Down

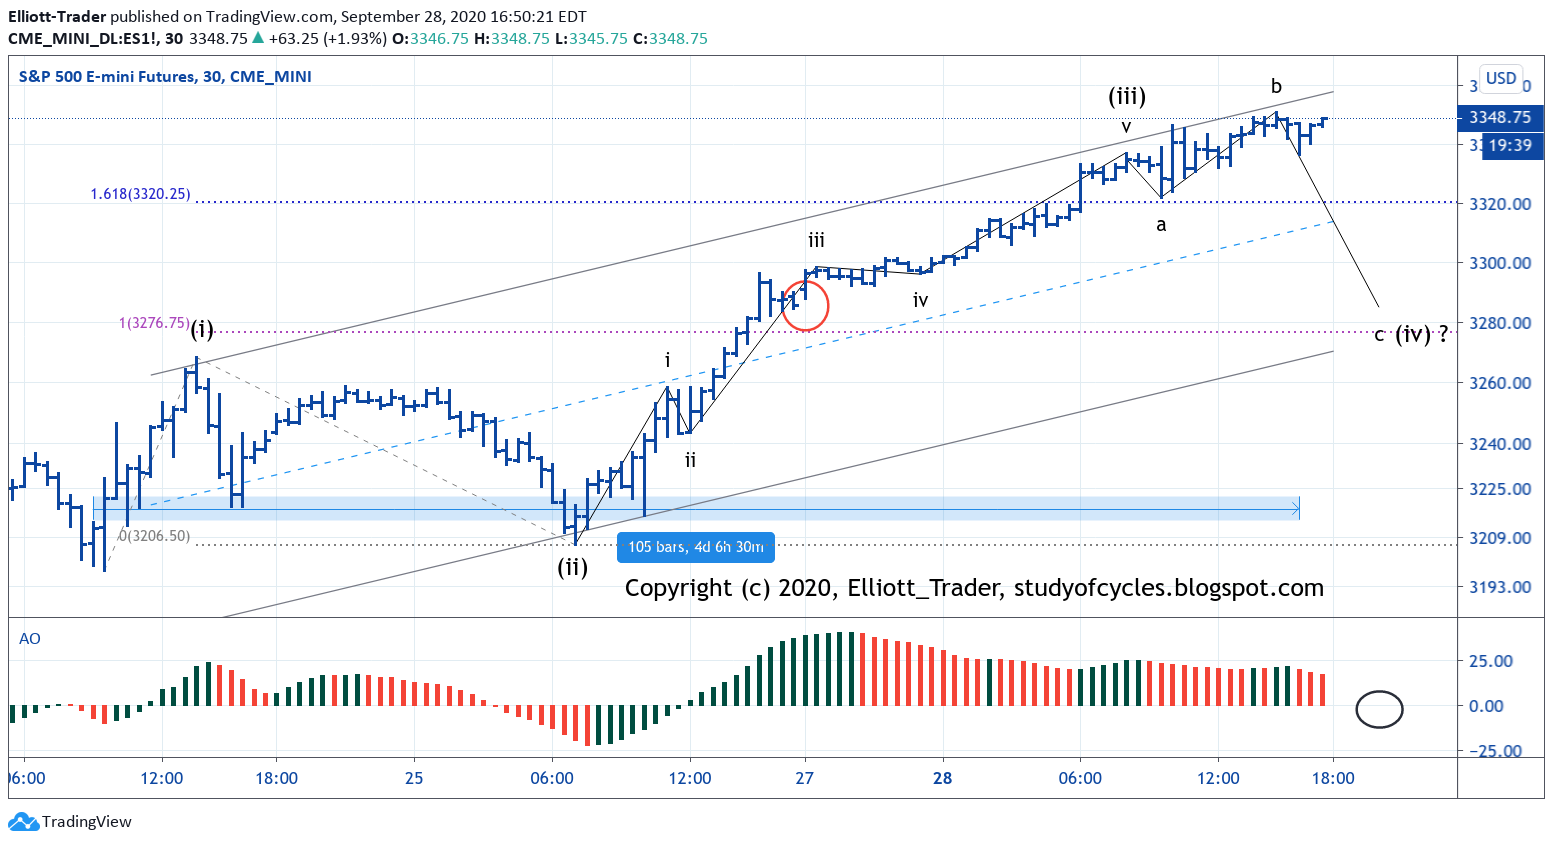
After the third wave, iii, at the 1.618 location then the long draw-out sideways triangle chewed up a lot of time until the vth wave broke lower out of the barrier triangle. The purpose of that triangle was to better equalize the net distance traveled in waves ii and wave iv. In doing so, the upwards diagonal (c) wave that completed on 16 Sep was confirmed as an ending diagonal. The start of the diagonal in the cash and futures was undercut today in less time than it took to build the diagonal.

So, on the daily ES futures chart, here is the picture as of the settlement.

ES Futures - Daily - Swing Line Down

The swing line has turned down, and the daily bias is down as price settled under the 18-day SMA. And, while the lower daily Bollinger Band is just starting to bend lower, the daily slow stochastic is in over-sold territory. It has not even started to embed. As of this time on the S&P500, there is no overlap on the June high as there is on the Dow.

The nature of these waves remains unlabeled at this time, as technically there are only three waves lower. It could be a-b-c, complete. But, it could just as easily become more than that, as an Intermediate (X) wave lower is expected as least to exceed the Minor B wave lower in price. So, we could have three waves down as part of a FLAT Intermediate (X) wave, down. We could have Minor A, down, Minor B up, and minute ((i)) of C down. Or, we could have minute ((i)) down, minute ((ii)), up, and minuet (i) down, today. Time will tell.

The issue is that an (X) wave sequence could be almost any one of the corrective forms. And we note today, that declines exceeded advances by only a 1:2 margin. This is not a very impulsive reading, and it certainly doesn't seem like a "kick-off" wave. Therefore, we are very, very patient with this structure. Look how long we had to be patient with the upwards diagonal to 16 Sep, and look how long we had to be patient with today's fourth wave triangle.

That's what it takes some time. Get some good rest over the weekend.

Have a good start to the evening.

TraderJoe


Thursday, September 17, 2020

Plausible Next Wave Lower

Last night's high held up. ES futures prices fell apart in the after-hours. While cash gapped lower, and made a slight new low, the futures never beat their low, and created what might be a barrier triangle near the low. This is the follow-up to the potential diagonal chart in the SPY cash index showed in the prior post.


SPY Cash - 15 Minutes - Potential Triangle


The downward wave iii in cash is 1.618 x wave i.

The potential barrier triangle in the lower right might be the fourth wave, taking a lot of time and moving price sideways. A lower low for cash and futures might allow the downward wave to take out the start of the diagonal in less time than the diagonal took to build. But, it remains to be proven.

If proven, it could be the right shoulder of a head & shoulders top.

Have a good start to your evening.

TraderJoe

Wednesday, September 16, 2020

Simple, Not Easy

Below is the count we posted in the comments today of the expected potential diagonal in the 15-minute cash SPY/SPX. There is a way to count 'five-up' in the futures, too, but it does not 'look' as quite as nice as this does. We said the first up wave in cash this morning did not make it over the high, and was likely an 'a' wave of iii. The second high did exceed the prior high and can be the 'c' wave of iii. The high during the FED news conference can be seen as the vth wave high.

SPY Cash - 15-Minute - Potential Diagonal

So now, the task become simple - but not necessarily easy. The high must be monitored to be sure it is not exceeded. (Otherwise such a pattern could be a 'leading' wave and not an 'ending' one.) And, the low of the diagonal, the start of the diagonal, needs to be monitored to see if it is taken out in less time than the diagonal took to form. Since the low of wave ii has already been exceeded lower, the next milestones are the ((B)) wave of i, and then, starting to fill the gap.

So far, all the right shapes and time expectations are met. And it is a reasonable sign that price back-tested the underside of the lower diagonal trend line and failed. (It could back-test again if it wishes). It is also a good sign - as we wrote about in the comments that each peak occurred on a successive lower high of the RSI indicator on this time-frame.

We will monitor the high with you. If it should be exceeded, then price may try to head more to the 62% retracement on the ES 2-Hr chart. But, for now, we just count what we see,

Have a good start to the evening,

TraderJoe

Tuesday, September 15, 2020

Wedge Shape

Because of the initial wedge shape, and the divergence on the RSI, readers of this blog were asked in the early morning to be on 'overlap watch' and look for the potential of a downward overlap.

ES Futures - 30 Minutes - Count Detail

That overlap occurred late in the afternoon. The count detail is shown above. I'm still counting the (c) wave upward.

Have a good start to the evening.

TraderJoe

Monday, September 14, 2020

Only A Little Less Stuck

In Friday's post we suggested watching the falling parallel trend channel on the hourly or 2-hr chart. Today, as you can see from the chart below, price got a little above that channel.

ES Futures - 2 Hr - Above Down Channel

So, with a wave that is now almost as long in time as the suggested downward wave, there is the making of an (a),(b),(c) corrective wave sequence upward. Today could be some or all of the (c) wave upward. The upward wave (c) could extend if it likes. It would be good to see a more reasonable Fibonacci retracement level, and a little more time taken to the move. Yes, it is possible the (c) wave might morph into a diagonal wave, too.

GOLD is still in it's triangle on the 4-Hr chart. Wednesday is the FED decision. Of course the only thing they're not thinking about .. is thinking about it.

Have a good start to your evening.

TraderJoe

Friday, September 11, 2020

Stuck in the middle with You - 2

The ES daily futures made a lower low than yesterday, as was anticipated from yesterday's intraday chart. But, they did not make a new low for the move downward.

ES Futures - Daily - Lower

The result was a fairly narrow range bar with a slightly lower settlement price. The bias remains down as the day settled under the 18-day SMA, however, the daily slow stochastic is in the over-sold range.

From a wave count perspective, price is currently in this downward channel as shown on this hourly chart of the ES futures. Price again fell to the round-number support at the 3,000 level, and then bounced.

ES Futures - 1 Hr - Mid Channel

The location of price currently in the channel shows how little urgency there is at the moment to the down trend. We remain sort-of 'stuck in the middle'. If price breaks significantly above the channel, a larger B wave or 2nd wave would be counted. If price significantly breaks below the channel, a larger C wave or 3rd wave would be counted.

The NQ futures did tick below their low of two days ago. So, the swing line may have also turned negative for that index. 

Have a good start to your evening and to your weekend.

TraderJoe

Thursday, September 10, 2020

Stuck in the middle with You

Yesterday we saw the likelihood of a battle brewing at the 18-day SMA. Today prices again approached the "line in the sand", missed it by three points, and were rejected lower. In doing so, first, the five-wave up scenario from yesterday was completed with a marginal new high.

ES Futures - Daily - Rejection near 18-day SMA

The daily slow stochastic is still over-sold, and it is possible for price to tag the lower Bollinger Band, again, but not certain. Here is the ES 30-minute chart to show two things: first price did first nick out the higher high to complete the impulse, upward.

ES Futures - 30 Minutes - Impulse Up Completed


The second thing is to show that after making the marginal higher high, price then headed quickly lower - quickly relative to the time taken in the up wave. On the down side of the chart above, price has exceeded the 62% retracement level, but has not taken out the 78.6% retracement level just yet. Here is a chart of the ES futures 5-minutes to show the current possible structure of the down wave.

ES Futures - 5 min - Possible Impulse

At the moment, we say we are "stuck in the middle" because there is no confirmation of prices below the 30-minute low of 3,295. And, on the 5-minute chart, there is no confirmation of a full impulse lower - although it is certainly possible that one could complete overnight and into tomorrow morning.

In the above chart, the RSI, on a very short term basis, definitely has the classic signature of "the third of a third" wave, with the lowest reading below the 30 level (colored circle).

So, we need to see if a fourth wave ((4)) forms without busting the pattern, and if there is any alternation to the pattern. So far, it looks OK, but it needs to hold through the overnight. Readers will note this impulse would be counted with a failed second wave that would indicate a lot of weakness in the market if the impulse plays out. If it doesn't, it is possible to consider an expanding diagonal wave lower.

GOLD appears to be in the (d) wave of its triangle, with five waves up for 'a', then 'b' down' and it could make five more waves up to tag the upper triangle trend line.

Have an excellent start to your evening.

TraderJoe

Wednesday, September 9, 2020

Battle Brewing?

Regardless of the overall daily wave count - which is still on track from yesterday - today's internal wave count suggests there may be a battle about to begin for control of the 18-day SMA.

ES Futures - Daily - Nearing 'Line in the Sand'

Today, prices went down and hit the lower daily Bollinger Band, where the daily slow stochastic indicated they were over-sold, then they rebounded strongly toward the 18-day SMA, the line in the sand.

The internal count on the day is as per the chart in this LINK. If a fifth wave higher is made tomorrow, then it would likely come into contact with the 18-day SMA at some point. Then, the question becomes whether another up wave will follow it for a deeper correction or not. The issue is whether we have made an impulse down, and a flat, up (probably in the NQ), or just a stunted - but legal - diagonal down in the ES, and will make three-waves up for a second wave.

The good news is there is at least a little volatility to work with compared to the narrow-range everyday up bars of the last few months. Have a good start to the evening.

TraderJoe


Tuesday, September 8, 2020

NQ Turns the Degree

Today, with a slightly lower low we began counting the possibility of a contracting diagonal lower in the ES futures. Although the ES has not formally invalidated the fourth wave possibility, the NADASQ 100 (NQ) futures likely have.

NQ Futures - Daily - Zigzag

The NQ's downward wave is the longest on the board since the 23 March up trend began. The NQ futures have the cleanest count - which we have detailed before. Tonight, in the after-hours the NQ futures are down even more.

Given the above count, this following count on the ES futures (not entirely my initial count) seems the best with C = 0.618 x A as the Fibonacci ratio. Rest-assured a zigzag was the only count contemplated, given the wave structure, it was just a question of how it completed.

ES Futures - Daily - Zigzag

This being the case, a tentative channel is drawn around the relevant waves. An Intermediate (X) wave might be expected to hit the lower channel and bounce off. However, as we have written about previously, since many many market indexes are past the 90% level for a flat-type wave, it is possible the (X) wave goes all the way back down to the low. We'll take it a step at a time.

Have a good start to the evening.

TraderJoe

Friday, September 4, 2020

Clear Wave Markers - 2

On the daily chart of the ES futures, yesterday's fourth wave marker locations were not violated. 

ES Futures - Daily - Not Invalidated

As the intraday chart of the SPX, below, shows there are currently only three-waves down within about 160 candles. The (c) wave is shorter than the (a) wave and occurred on a divergence with the Elliott Wave Oscillator (EWO).


Around mid-day we showed the above chart and suggested to watch to see if the down channel was breached. It was - substantially. And price is now trading in an up channel. The NQ counts cleanly as a potential expanding diagonal upward (see chart HERE). The ES does not yet count like anything, but might still be working on it. The NQ's diagonal might be an "a" wave or a "i" wave up. That would require an eventual higher high before a lower daily low.

Depending on the overnight and weekend news and price movement, there may be some more clues to the type of patterns that will be formed. If we've seen the bottom of a fourth wave, then a triangle is certainly a possibility, or so is just a quick trip over the high.

This additional chart was added after the close to show the 0.382 Fibonacci relationship, the bounce off of the lower channel, and that wave minute iv is currently shorter than the largest wave in Minor B.


Also significant are the very, very clear five wave progression within wave minute iii, each of which follows degree labeling guidelines in that each of these waves is shorter in price and time than minute i, and that there is not yet any overlap with wave minute i.

Time will tell. Patience, flexibility and calm remain the guide words. Have a good start to the evening and to the weekend.

TraderJoe

Thursday, September 3, 2020

Clear Wave Markers

Here is the daily chart of ES Futures after a more than 120 point loss (more intraday). In some legitimate questions some readers asked if I was sure this was a wave four based on the point loss.

ES Futures - Daily - Likely Minute iv


Again, the question avoids thinking in terms of probabilities. Today's move could be only three waves down. The tail end of the move was lower but not too impulsive. Price hit the 18-day SMA and backed off a bit. Such a move could complete wave iv in it's entirety, which seems unlikely due to the short number of days. Equally, or perhaps more likely, such a move might start a triangle which could last a number of days and precede the final move up.

A couple of things are clear. Wave minute iv may not close down over minute i, or it would likely invalidate a further impulse. Further, in consideration of degree labeling, wave iv should not become longer than the longest part of wave Minor B, the 15 June low.

The daily slow stochastic lost its embedded reading and touched the 18-day objective all in the same day. The only day that the embedded reading can be re-established is tomorrow - which is the payroll employment report. Depending on the data, things could get whippy or continue lower.

Have a good start to the evening.

TraderJoe

Wednesday, September 2, 2020

EWO Green and Locally Higher

There is no doubt this is a grinding, sometimes stalling, sometimes impulsing wave up. It feels like a third wave. It is, to me, in the sense that C waves are in the third wave position. The daily Elliott Wave Oscillator is still green and printing locally higher bars. Overall the EWO still has a daily divergence.

ES Futures - Daily - Zigzag

That being the situation a case can still be made for being in the minute iii wave of the Minor C wave, as above. There is not a significant daily reversal (yet), the slow stochastic is still embedded, and price remains over the 18-day SMA. However, price today closed over the upper daily Bollinger Band, and that should perk one's antennas up at the least. I can't imagine what the put-call ratio is yet today, but I'll have a look at it tonight.

Daily price is in the channel above (overall in part of a wedge). But, there are no downward overlaps yet. Price is nearing the level of C = 0.618 x A, one of the common measurements for a zigzag wave.

We showed how both the NDX and ES can have a near completed count in this area on intraday charts in the comments. Those completions, or near completions, can be for minute wave iii of Minor C. There are ways they can squeak out new highs within limits, so the overnight needs to monitored a bit to look for overlaps.

Have an excellent start to the evening,

TraderJoe

Tuesday, September 1, 2020

Mind Your N's and Q's?

Today was the first of the month, and saw the expected inflows we discussed yesterday. We showed the hourly triangle on the ES futures. Today, price broke out of and made the new high confirming the triangle behavior.

For those wondering if new highs can yet be made, it would seem like they can. Although the NQ's stands for the Nasdaq 100 Futures, if we look at the NDX cash channel, it is possible that it could still make an expanded flat down to hit the lower channel line for a fourth wave, and then make a fifth wave up, as per the chart below.

NDX Cash Index - 15-min - Channel Count

The futures might be faking-us-out in to thinking there is an ending diagonal top, when it is only a (B) wave, up. The top is not likely an ending diagonal on the cash index, as the wave ((1)) up, on the lower left looks like a leading diagonal. Therefore, wave ((5)) should be an impulse. If the fourth wave were an expanded flat, it would alternate well with a sharp second wave.

This might correspond with a larger wave two in the ES futures to back-test the upper hourly triangle trend line, as right now the move out of the triangle looks a tad short of target.

Well, let's see how it goes. Have a good start to your evening.

TraderJoe