After finding support at the 3,200 price level, the lower daily Bollinger Band, and the 100-day SImple Moving Average (SMA), shown below, price suggested in Friday's post that the diagonal wave formed in the downward direction was completed, and that there was a break of the upper diagonal trend line. Today's upward gap and price subsequent follow-through made a wave that was larger than minute ((iv)) and larger than minute ((ii)) of the Minor A wave down. Therefore, degree analysis also confirms the beginning of a Minor B wave up.
 |
| ES Futures - Daily - Minor B |
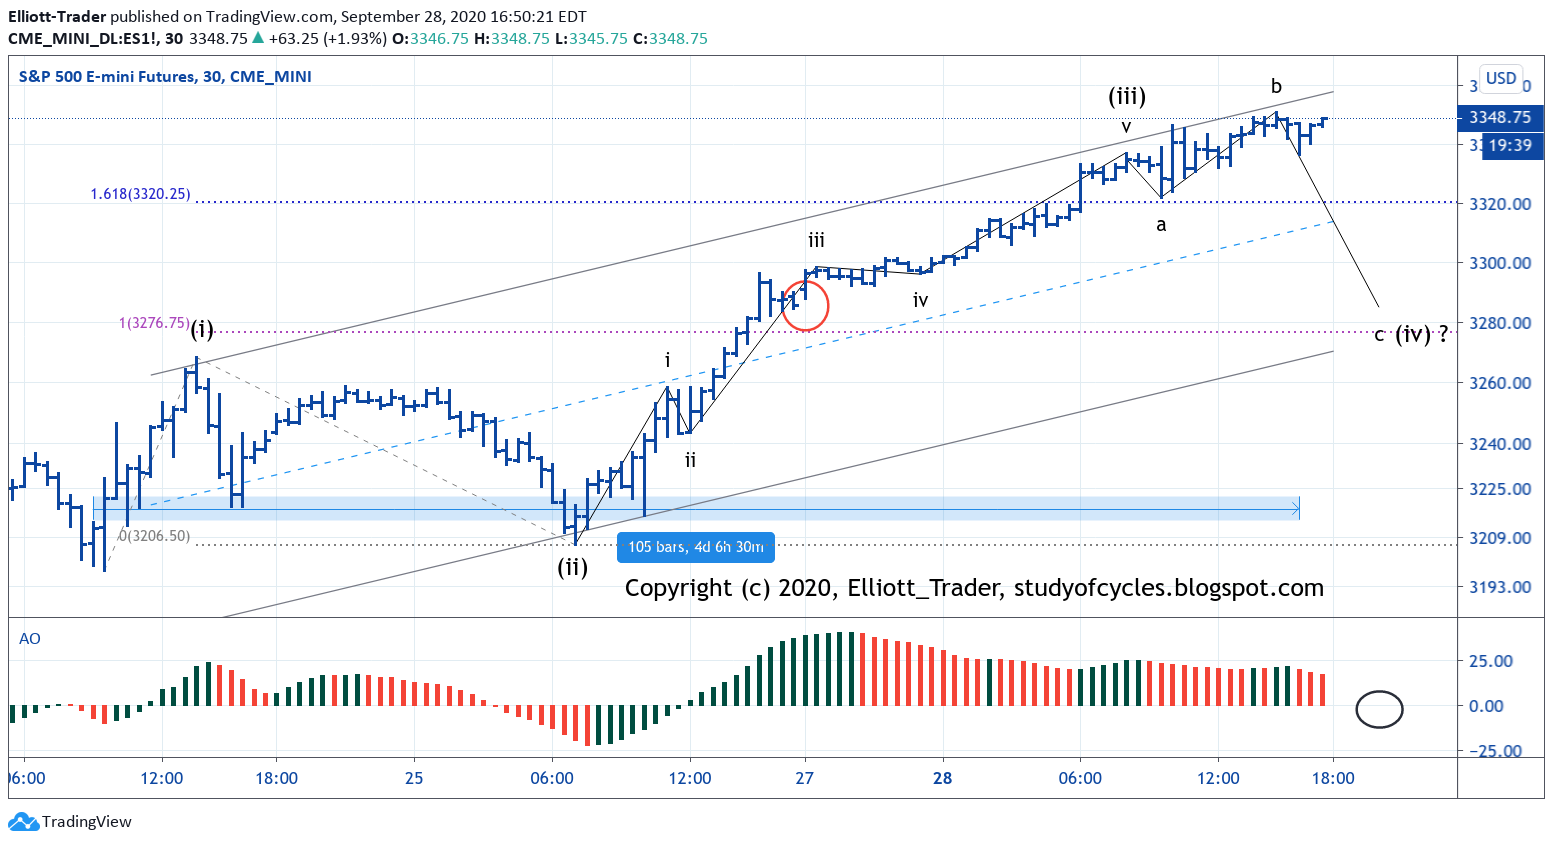
With about 105 candles on the chart, The Eight-Fold-Path-Method (see featured post) suggests that a fourth wave (iv) could form as a flat wave down into the area of the prior wave iv. There is a gap in the futures from Sunday night. Often, these fill more a bit more quickly that the ones in cash. Since wave (iii) is the extended wave in the sequence, with greater than a 1.618 extension, then wave (iv) should not overlap wave (i) without having implications for the larger count.
It is possible this up wave - if it completes as an impulse - is forming the minute ((a)) wave of the Minor B wave. If overlap on wave (i) occurs before a new high, we will deal with it at that time.
Have a good start to your evening and to your week.
TraderJoe
Thank you ET.
ReplyDeleteJust an interesting news:
Effective October 12, 2020: Overnight limits will expand from +/- 5% price limit to +/- 7% limit plus 3.5% dynamic circuit breaker.
https://www.cmegroup.com/trading/equity-index/faq-sp-500-price-limits.html
Preparing for ((C)) ?
Joe, In recent posts you've started to refer to pivot points. During the cash session the ES and the SPX move prety much in tandem. However, because of the ES overnight session different pivot point ranges are generated for the two indexes. For Tuesday, the point ranges are much wider for the futures than the cash. Do you find one set of pivot points more relevant than the other?
ReplyDeletePivot points on SPX are calculations on a calculation and, to me, don't represent real trading. Pivot points on ES are calculations on real time trades, and seem more relevant. If, as a matter of preference one trades the SPY, instead of ES, the pivot points there might be more relevant as they represent real trades, as well, but then you have the complications of the SPY going ex-div on a date to deal with also, relative to the pre-calculated pivot points the day before.
DeleteES 30-min, the bare 'minimum' objective of a flat has been obtained, by trading below the prior 'a' wave. The 'b' wave is shorter in time and price than wave (iii). The retrace can go deeper if it wants to contact the channel. The Elliott Wave Oscillator has met it's objective, but could go as low as - 16 to -20.
ReplyDeletehttps://www.tradingview.com/x/0lxK2MzB/
TJ
ES new low of day (LOD).
DeleteA new post is started for the next day.
ReplyDelete