Market Indexes: All Major U.S. Equity Indexes were higher
SPX Candle: Higher High, Higher Low, Higher Close - Trend Candle
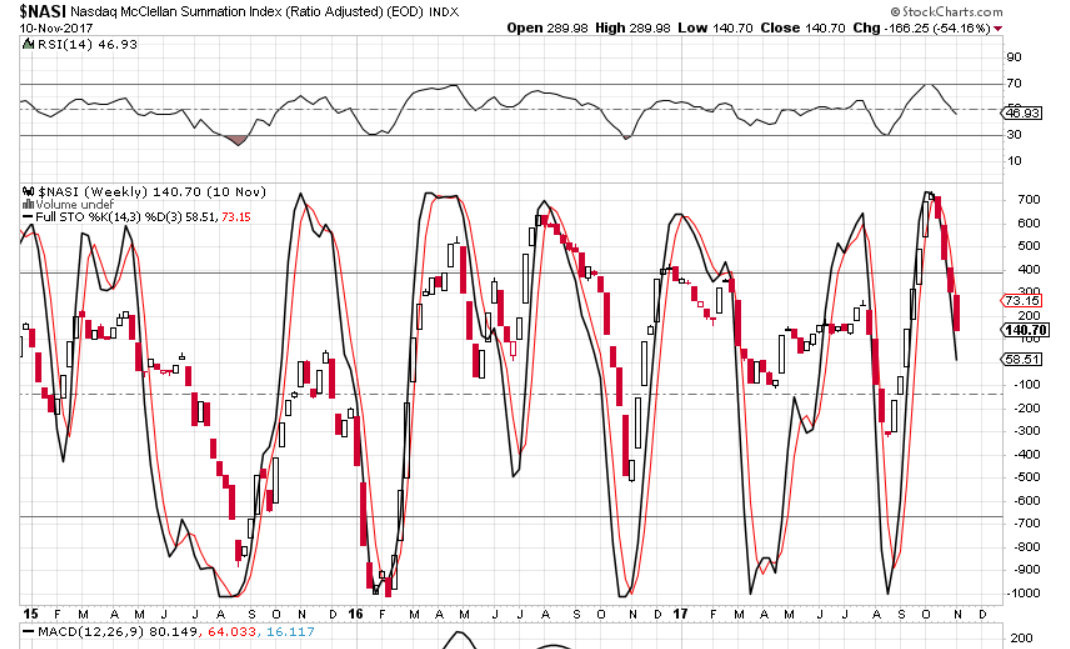
FED Posture: Quantitative Tightening (QT)
From yesterday's post, we were clearly expecting a fourth wave and higher waves overall, and we asked you to keep at least one eyed peeled on the pesky legislators in the U.S. The market, as measured by the S&P500 index closed yesterday at 2,626. Overnight there appeared signs of more agreement on a Senate vote, and the futures were higher overnight. The cash market gapped up +7 points to open at 2,633 and, when Senator John McCain voiced his support for the Senate tax plan the market shot up to 2,658.
When the gap up occurred on the open, the presence of a rare "running fourth wave" was quickly surmised, and we will show that on that futures chart below.
 |
| ES E-Mini S&P500 Index - 2 Hour Futures - Rarely Running Flat wave (4) |
Here in this two-hourly chart, the whole wave from the end of the triangle ((e)) wave is being shown. We did this because the Fibonacci ratios on cash were making no sense, and then quickly it became apparent that wave ((3)) was headed for the 1.618 Fibonacci extension, which we called, and it made in real time (and then some!). For the rest of the day, prices traded down under that 1.618 level.
The running fourth wave was valid in both cash and futures as it's y wave crossed back under the high of wave (3), insuring it was corrective to it. The reason it is a running flat, is that in a regular flat the y wave would have closed under the w wave. It this case after a more than 1.618 wave x, it's y wave closed much higher than the w wave.
So, now we have the waves in a clear channel, and it should be clear with the new higher high on the Elliott Wave Oscillator (EWO) that a higher high is still possible. We can, of course, go into a fourth wave at any time. On a lower time scale, there 'could' still be one higher high within this wave ((3)), up. Time will tell. I would not expect wave ((4)), whenever it starts, to be done until the EWO comes back down to within about +10% of the zero line.
How high can this market go? Well, when we find the end of a wave ((4)), we'll have to add the distance of wave ((1)) to it, as an initial target. For now, we have to monitor the shorter term charts in the live chat room.
Please note that after the cash close, the futures made a lower low than cash did.
That's it for tonight. Again, keep your eye on the U.S. legislative process, as they try to pass a tax reform that balloons our deficit, gives money away to the corporations, penalizes the poor by removing their health care rebates, and continues to steal money from middle income retirees by keeping interest rates artificially low on the one hand, while they tell us this is good for us on the other hand. It's so good many wealthy businessmen don't want anything to do with it!
Well, have a good start to your evening. Write your legislators if you care. I have.
TraderJoe