Market Indexes: DJIA, SPX, NDX Higher; RUT slightly lower
SPX Candle: Outside Candle Higher
Fed Posture: Quantitative Tightening (QT)
The futures were first higher overnight, then lower in the morning. The cash S&P index had closed Friday at 2,582. They gapped down about six points this morning to open at 2,576, and traded down to 2,574 before quickly reversing to chop their way higher, filling the opening gap, to close at 2,584 or up about 2 points. While they did whip around (as might be expected in a diagonal or triangle) the overall point gain on the close was very modest. In the process of closing higher, the cash market did close Friday's gap down, but not Thursday's. The chart is below.
 |
| S&P500 Cash Index - Daily - Potential Red Wedge Still in Tact |
While the cash market did make an "outside day higher", the ES E-Mini S&P500 Futures did not. But, as of the settle anyway, the futures did, for the first day, lose their embedded slow stochastic reading if it holds into the close of trading. The only day the futures could get it back would be tomorrow.
The red wedge in the cash market has not been invalidated. We provided the invalidation levels in a previous post. But, we want to be clear, as of this time ...
There are two other plausible or possible counts - other than an ending contracting diagonal - right now, 1) an overall triangle dating from the 23-October high, and 2) a downward expanding diagonal from the high. This is precisely The Fourth Wave Conundrum that happens at every degree of trend, and we will have to take our clues from gap direction. Nothing says upward price movement is over yet, and careful monitoring of the over-night is temporarily needed. (For the triangle - just start a line down from the highs).
Again, the DJIA has already invalidated any further contracting upward diagonal - as it's fourth wave would be too long for it's second wave - and it's MACD is not looking very healthy. You might like to review that one. The Dow has not invalidated a larger triangle.
Also, the summation index on the Nasdaq is not looking very healthy, as per this weekly chart.
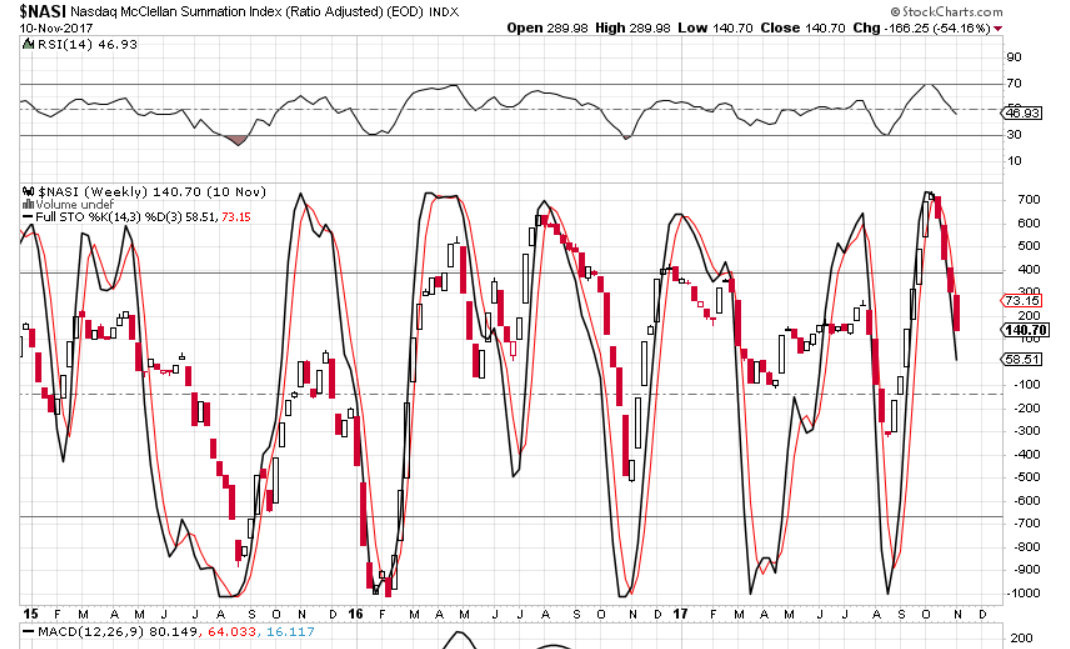 |
| NASDAQ Summation Index Weekly |
The slow stochastic looks rather ominous here. And while it could hitch up, it tends to be rather smooth in it's movements.
It's just another reason why patience and flexibility are needed at this time.
Have a good start to your evening.
TraderJoe
No comments:
Post a Comment