Tuesday, June 30, 2020

Warning Line Crossed - 2

Yesterday, we clearly indicated that a warning line for a downward ((i)), ((ii)), (i), (ii) had been crossed, invalidating the second (i), (ii). (See yesterday's S&P500 cash chart). Today saw additional gains.

On the daily chart, below, these overall factors can be cited. There is still a declining tops line in place from the June high.

ES Futures - Daily - Declining Tops

Although there are still declining tops, the swing line turned neutral - as best I can tell - with a lower low but a higher high. Price, meanwhile traveled back to the 18-day SMA, or "the line in the sand" at the 3,100 level, where the "battle is being fought", and then fell off a bit.

There are two clear down fractals, and two clear up fractals - breaking any of those might help define things a bit. The daily slow stochastic is dead sideways.

As we said before, the Minor B wave can take almost any corrective form: zigzag, multiple zigzag, flat, combination or triangle. Is it 'possible' this is a triangle? It certainly is possible, but there must be many more overlaps of A for that to occur properly.

Yes, it's difficult to deal with a sideways market. Today is the last day of the month and of the quarter. Tomorrow may see the usual inflows from mutual funds, 401k's, pension plans, company bonuses and dividend roll-overs. We'll see.

Have a good start to the evening.
TraderJoe

Monday, June 29, 2020

Warning Line Crossed

In my weekend post - while most web-sites were counting the crash about to come, this site was more concerned about 'properly' counting a nested ((i)), ((ii)), (i), (ii) and provided a trend line that should not be crossed if that was going to be the count.

Both in the futures and in cash, that line was crossed - more markedly in cash that in the futures, but still in both. You can see that the dotted red line in the chart below, was not only crossed, upwards, it provided support for an up turn later in the day.

SP500 Cash Index - 5 Min - Diagonal

The chart above is of the S&P500 cash index, because the futures in this case are less plain. But here you can see that about the only way to count a down structure out of these waves is as 'one diagonal'. The diagonal is inside of the green lines with the lower lows of (i), (iii) and (v), and the overlap of (iv) with (i). This could be minute ((i)) in the cash index, and in the futures or it could be the end of a down wave because it is a diagonal.

Again, it does not look like we've had a ((i)), ((ii)), (i), (ii) - just wave ((i)), down, at this point, and working on wave ((ii)), up.

Clearly, we are not crashing, yet, as so many suggest, although we may at some point. If you look at the daily chart of the futures, all we did was back-test the most recent up trend line from the lows. Readers of this blog should draw that line for themselves, and see where it comes in.

Have a good start to the evening.
TraderJoe

Friday, June 26, 2020

When Not

A lot of people on the internet want to tell you what their Elliott Wave count is, or what all six of them for the same symbol are. As I noted in the comments for the previous days' posts, we have the potential to make a 1.618 wave down. Yes, you will see that in the ES 2-hr chart, below.

But, instead of focusing on the count, per se, I want to focus on how you will know that the count below is not working. 

ES Futures - 2 Hr - Possible 1.618 Wave

Notice the red dotted line that goes from Minor B to wave black minute ((ii)), or circle-ii. Wave black minute ((ii)) is a 50% pull-back. And, by itself, because it is much more than 38.2%, that retrace wave is deep enough to support a 1.618 wave downward. However, we want to look for post-pattern behavior that confirms that a 1.618 wave should unfold. 

The first evidence of that will be that wave blue minuet (ii) should stay below the red dotted line. If it does, that would mean it meets our expectations that the market is in fact weak enough to make a 1.618 wave lower. In other words, all of wave black minute ((iii)), circle-iii, is below a line from 0 - ((ii)). The 'zero point' in this case is red wave Minor B.

If this does not occur it would be a major red flag and warning that the downward count is not progressing as expected. 

Yes, everyone else on the internet will tell you what their wave count is for the next 99 years or more. I prefer to concentrate on clues that can tell you that a current count is working as expected, or it is not.

Hopefully, the reminder will be a bit more helpful to you.

Have a good start to the evening and to the weekend.
TraderJoe

Thursday, June 25, 2020

Simplest Answer - 2

Overall, because five-waves-down were counted using degree labeling yesterday, we were expecting an upward retrace day today. Yesterday, we gave clear directions on various levels of invalidation of a potential upward contracting diagonal, which was fine until the overnight trading. The pattern did invalidate in the overnight and formed a flat instead, which we picked up on when we looked at it this morning. That also provided another lower low day. We provided the 3,065 level as a first target for an expanded flat, if the failed flat we woke up to repaired itself. It did. First, here is the daily chart. See the comments from the prior post if you have questions.

ES Futures - Daily - Minute ((ii))

The first target of 3,065 was met and exceeded. Today likely represented part or all of the minute ((ii)) wave of the downward Minor C wave of the potential Intermediate (X) wave.

Next here is the intraday chart.

ES Futures - 30 Minutes - Flat Wave

There are two ways this upward wave could reach the prior wave (iv). It could gap up in the overnight, or it could form a very messy expanding diagonal. The later option depends more on a gap down and overlaps. We'll address that if we see it.

If the wave completely falls apart in the overnight, and trades below 3,010 then the upward wave may have finished as a complex w-x-y wave that you see in red. The wave has done everything it needs to do, upward, but it could easily do more.

Because the wave has already retraced more than 50% of the downward wave, it can easily support an extended 1.618 x minute ((i)) wave for a minute ((iii))'rd wave lower.

This is still time to stay flexible, calm and patient and maybe check in a couple of times to see how things are going in the over-night.

Have a great start to your evening.
TraderJoe

Wednesday, June 24, 2020

Lower Low Day

Many Elliott wave sites / videos called for higher highs today. Yet, we labeled yesterday as the likely high of the Minor B wave (red in the daily chart below), with an expectation of downward movement from the hourly chart shown in yesterday's post. That occurred with the low of today breaking below yesterday's low and the low of the day prior.

ES Futures - Daily - Lower Low Day

Today may be counted as five waves down with an extended fifth wave. It could be a first sub-wave of the Minor C wave down, as it was shorter than Minor A downward. We are watching the overnight for signs of a retracing wave. The retracing wave can be, but does not have to be 50 - 62% - or more - if we are still in a first extended wave, provided, by degree labeling, that a first extended wave does not become longer than wave A.

Here is the intraday labeling from the last two days. In today's down wave wave iii is just slightly longer than wave i, and there is very good alternation with no overlap.

ES Futures - 15 Minutes - Impulse

This impulse shows the case where, when wave iii & i are nearly equal, but wave iii is definitely longer, then the fifth wave can be the extended wave in the sequence.

Have a very good start to your evening.
TraderJoe

Tuesday, June 23, 2020

Simplest Answer

The simplest answer has the red Minor B wave ending in a slight truncation at today's high. The ES hourly chart is shown, below, with all of the correct degree labels applied. For clarity only the ending "c" wave labels are not shown.

Once again we note that 60+ point S&P futures swings did not even show up in the cash market. This was the 'flub' created after White House trade advisor Peter Navarro initially stated that the U.S.-China trade deal was over, requiring his following refutation of that. This wave shows up as the blue minute (b) wave last night.

ES Futures - Hourly  - Minor B Completed?

This upward wave can count as a rare triple-combination to a Minor B wave top. There were two diagonals in this wave, one downward to black minute ((x)), and one upward to blue (a). And, there was one triangle in black minute ((y)) as a blue (b) wave.

Whether there is post pattern behavior that supports this count, or not, remains to be seen. The reason this is the simplest answer is the number of price overlaps that have been created.

A slightly less simple answer would be that, since the latest upward parallel is not broken lower, yet, then the current blue (b) might extend as a flat to make a new blue (b) where the red (b)? is located as an alternate, and a new high might follow but is not required. All the waves needed are here already.

This is currently a very ugly count. Sometimes B waves are intractable like this wave is. Let's see how it goes.

Have a good start to the evening.
TraderJoe

Monday, June 22, 2020

Degree Labeling Might Again Help - 2

It is clear the big crash did not get started downward this morning, even though the futures gapped lower. Still it is likely some larger downward price movement will occur relatively soon. After you read this post, you will see what is being thought of. Still, in considering degree labeling over the weekend, I could find one way for prices in the S&P500 to go 'over the top' as they have in the NDX. That proposed chart for the daily ES futures is below.

ES Futures - Daily - Possibility for Double Zigzag

So, if you are a reader of this blog, you have noticed we said the downward wave to what is now shown as red A is larger in price than the prior black B. This likely means the wave is not a minute wave, and should be of the same degree - or larger - than the Minor B wave. But, what if red A is a Minor A wave? Then, we would have had three-waves-up to the red wave labeled Minor B and the expected downward movement would be the red Minor C wave, down, to make an Intermediate (X) wave. That might allow prices to go over the top, again, in an Intermediate (Y) wave, and that might successfully conclude a Primary ((B)) wave.

Such a Primary ((B)) wave would then be longer in price and time than its smaller degree Intermediate (C) wave down to the March 23rd low, and it might allow the Primary ((B)) wave to attain the 90% or greater needed for the ((B)) wave of a flat - awaiting Primary ((C)) down.

Food for thought.

Have a good start to the day.
TraderJoe

Saturday, June 20, 2020

Degree Labeling Might Again Help

On Saturday, June 13th I posted this hypothetical view of the possible path of the ES futures contract. The intent was to show a clear 'five-waves-down' in the Minute ((c)) wave, of the Minor B wave, lower.

ES Futures - Daily - From June 11th

Since that time I have been suggesting flexibility as we gather evidence to see whether this path is viable, or whether the Minor B wave stopped at the June 15th low. Well, on Friday, we may have gotten the evidence we need in the form of degree labeling considerations.

In order to understand this, let's assume the opposite, and see if it creates any degree violations. We'll do this on the next chart. Let's go ahead and place Minor B at the June 15th low.

ES Futures - 1 Hr - Degree Violation

So, if Minor B is at the lower left, then the five waves up to Minute ((i)) can be counted without serious issue. But, note that it is 29 bars long. Now, we could count the next moves as minuet (w), (x) and (y) to a second wave, ((ii)) in the lower right, that might hold the 62% retrace level.

But, you'll see we run into a problem if we do that. Minuet wave (x), which is an upward wave is claimed to be of a smaller degree than minute ((i)), but yet it is longer in time than all of minute ((i)) - the next largest degree wave in the same direction. That would be a degree violation.

So, this suggests that the June 15th low is only minuet (i) and the June 19th high is only minuet wave (ii), as in the charts, below.

ES Futures - Daily - Hypothetical in Progress

This suggests that minute wave (ii), up, was indeed a failure wave, and the hypothetical scenario is playing out. Here is the substructure of the recent up waves again in a two-hour chart - just for clarity.

ES Futures - 2 Hr - No Degree Violation

So, now you can see in this chart that even though wave y is longer in time than wave w, they are now of the same degree, and, thus, there is no degree violation.

This now should mean that a minuet wave (iii) will exceed the low of minuet wave (i) over the course of the next week. Of course, we could not reason such until the waves actually became 'longer in time' on Thursday night and Friday morning.

This is the second post this weekend, and you might like to read the first one if you have not already.

Have a great rest of the weekend.
TraderJoe


Friday, June 19, 2020

Flexibility Required - 3

Price movement was whippy for the futures session. Overnight, the futures were much higher, right until the cash session open. They were were sold from that point, and the selling continued for the remainder of the day with a large mid-way internal failure swing. The cash session was not all that great, but in the after hours until settlement, they really began just "throwing them away", with the futures losing nearly 20 points in 15 minutes time. All this occurred with the cash market closed. Interesting, huh? The hourly chart of the futures is below.

ES Futures - 1 Hr - Truncation Averted

Today's price action created an outside day lower. Price settled below the 18-day SMA so the price bias is, at least for now, changed to lower. The selling into the settlement finally allowed the 16 June down wave to be exceeded. If this is a correction, then that movement averted a truncation in the correction.

The chart above shows the major Fibonacci levels of a correction. So, depending on Sunday's overnight session into Monday, flexibility is still needed to see if a correction holds or not. Price might be trying to seek the daily up trend line from the lows. Readers of this blog should plot that up trend line to see how far price is away from it now.

This has really been a range-bound and volatile several days - the likes of which you may seldom come across. Last night's price movement made a pretty clear "three waves up in a channel" - including the triangle we pointed out yesterday - and this would be an odd way to end an entire movement. In Elliott wave terms, this pattern, so far, can be called a "double-three" or a "double-combination". And, if this is a correction, and if the correction extends lower - say to the 50 - 78% Fibonacci retracement zones - then it is possible to form the combination called a "flat-x-zigzag". They are fairly rare, but I have seen them. So, caution, calm and a lot of flexibility are required to avoid being whipsawed.

Have a good start to your evening and to your weekend.
TraderJoe

Thursday, June 18, 2020

Flexibility Required - 2

Here is today's chart. Earlier in the day, I said there 'could be' a triangle forming inside the larger diagonal wave shown in yesterday's post. The objective of the larger diagonal is to make a lower c wave than a, to avoid a truncation. Notice how flat the MACD is right now? That is often one sign of a triangle in progress.

ES Futures - 30 Minutes - Possible Internal Triangle

As of the futures settlement, nothing has occurred  to invalidate the internal triangle count shown with the dotted lines. If a true triangle is formed, it might signal 'last waves of the diagonal dead ahead'.

If the lower c wave than a wave is made, that would mean the market has the typical strength of a downward correction. If invalidation occurs at the orange dotted line before a new low is made below a, and the truncation is allowed to persist, that would typically indicate the market has more than usual upward strength. As you can see already, this c wave has occurred at - is occurring at - a much more shallow angle of descent than the a wave. This already is supposed to mean the market has more upward strength because the upward pull of the market is bending the downward c wave to the right. This is not what the crash enthusiasts wanted to see. Their third wave should be headed straight down right now, instead of the market still flip-flopping around the 3,100 level...

And we may get a good swift kick in the pants yet. The last wave of a diagonal is itself always a .c wave of (v), and they can be doubly dramatic for that reason. But not so far ...

Such a  wave might be on tap for an overnight session, depending on the news, company announcements, etc.

If and only if the a wave low is broken could the alternate count - shown in red - begin to be considered. Right now, it is on the chart for completeness. But, it is the market that has to prove the case that the red count is even viable, let alone increasing in odds. As of this writing such a count is not even viable unless the larger diagonal completes properly.

P.S. If invalidation occurs a perfectly countable diagonal ended with the wave at (iii), and we will recognize the truncation.

Have a very good start to the night.
TraderJoe


Wednesday, June 17, 2020

Flexibility Required - I'll try to show Why

The market - as measured by the ES futures - started the day flip-flopping around the zero line in what seemed like meaningless movement until a couple of patterns caught my eye.  Looking at the ES 30-minute chart, below, the first thing to notice is that the high on June 17th is within 90% of high on June 16th.

ES Futures - 30 Min - 90% Retrace Wave

So, if the wave count down to noon yesterday is only three-waves, and the wave count up to today's high is only three-waves, then that means price could be making a flat wave. (You certainly would not be out of line to also consider a triangle. I have, at times.)

The other item that caught my eye was the expanding shape downward from today's high. Here it is in the chart below.

ES Futures - 30 Min - Expanding Shape Downwards

That being the case, live & in real time, I decided to test the hypothesis that we might be making a lower wave after the mid-morning to mid-afternoon rally. I showed readers of this blog in real-time, and as fast as I could post it, this potential contracting diagonal c wave, which ended the afternoon rally. You can view the chart as this LINK.

I stated that if we had, in fact, made an ending diagonal wave c wave, then the start of the diagonal should be taken out in less time than the diagonal took to form. And, with interim charts, that wave was tracked lower - see the comments from the prior post if interested - and, in fact, both the start of the smaller c wave diagonal and the prior low were exceeded lower. So, at this point, the evidence suggests there could be the larger expanding diagonal lower - which is still forming.

And things could get bumpy here. It we do make only a true flat wave, then it could be a second wave of a move higher. The purpose of the flat would be to burn time while moving prices a bit lower to more deeply retrace the up waves from Sunday/Monday.

Yes, the alternate of a flat is that the 90% wave is the end of a move upward. It would have ended in a truncation. That is certainly possible, and will be watched for. But, at the present time, if the move down turns into a valid expanding diagonal, then we know it could either be an ending diagonal or a leading one.

This is how the market creates uncertainty. As a result, it is not a time for opinions. It is not a time for worry about the FED. It is a time to track things carefully and cautiously, until the lengths of the waves becomes more telling.

Have a very good start to your evening.
TraderJoe

Tuesday, June 16, 2020

Higher High Day

ES futures were higher overnight, and closed mid-range above the key 18-day SMA and 34-day EMAs. So, the daily bias is up. The daily chart is below. Nothing has changed, so far.

ES Futures - Daily - Higher High Day

As long as higher highs are made - and prices remain in the channel - the up trend may continue. It is interesting the last daily high at minute ((x)) did not diverge on the MACD.

Bears are aware the up move to today's high may currently be counted as an expanded flat after the spike down four day's ago. The up wave, c, is almost precisely 2.618 x the a wave of that move, added to the b wave. That would be a legitimate way for the market to move lower - see the chart at this LINK.

The difficulty is that the market did little in the middle of the day to satisfy the beginnings of a dramatic third wave lower. Price would need to get under the 3,060 level before making a new high for the expanded flat idea to really activate a down count. That has not happened yet. Contrariwise, if price goes over the 2.618 extension, that would tend to rule it out, as expanded flats rarely get longer than that.

I have no issue if the market moves higher or lower here, as both are completely legitimate. There are some times when one simply must be neutral and look for clues.

Have a good start to the evening.
TraderJoe

Monday, June 15, 2020

Overlap and Scurry Higher - Watch the Retrace

As expected, the ES futures on the daily chart did come down in the overnight to overlap the Minor A wave upward. The overlap is shown on the chart below.

ES Futures - Daily - Overlap of Minor A

The cash S&P500 and SPY did not overlap by the time their sessions started. Once the cash market opened prices began a steady rise that 'can' now be counted in five waves higher.  The chart of that rise is shown below.

ES Futures - 5 Minutes - Intraday Wave

The intraday wave has definitely qualified to have 'five-waves-up', including a third wave which is more than a 1.618 extension. I do have a question as to whether the wave is finished or is forming an overnight running triangle (on the eve of Chair Powell presenting testimony to Congress tomorrow).  This might allow a larger wave iv in time to touch the right hand channel boundary.

So, the key question is very, very simple - please don't miss the simplicity of it: Will the entire wave be retraced or not? If the whole wave is retraced, then downside counts will immediately need to be looked at. If the whole wave is not retraced, then this wave could be the first wave of a five-wave "C" wave higher. I have no preference which occurs. I'll be watching the key locations intently.

Have a good start to the evening,
TraderJoe


Saturday, June 13, 2020

Simply Hypothetical

With all due apologies to Robert Palmer's smash hit, "Simply Irresistible", this post presents a Simply Hypothetical path the market might take in the near term. One line in the song should ring true with the recent level of speculation we pointed out with the lowest put-call ratio of 0.37 in years.

"..She's so fine, there's no telling where the money went."

As we know this week, those speculators were treated with a dose of reality and some may be asking where the money went. This first hypothetical path was shown in the comments section to the prior post.

ES Futures - Daily - Hypothetical

The post suggests that perhaps just a better parallel is being made for a continued rise higher as a "running flat B wave", with a C wave up yet to follow. One reason for looking at this option is that if one were to count A,B,C to the recent high, then the very instructions for forming a zigzag can not be followed. These instructions - shown on the chart - are printed in the very book which is the foundation for a very large Elliott Wave service which is even now not following their own instructions. Are they right, or are they wrong? Only time will tell.

From a degree labeling standpoint, we know this up wave is already 'larger in time' than the most recent Intermediate wave decline to the March 23rd low. The question is whether it will also become larger in price to unquestionably be another Primary wave up as shown in my longer term chart posted HERE. (As I  said before, I reserve the right to upgrade A,B,C to (A), (B), (C) - should it be required after further wave examination).

Again, the only requirement for a "running flat B wave" is that it overlap the A wave - at least in the futures. We're not there yet, but came close on Friday.

I said this is a first hypothetical path because there are other paths the market could take for which there just is insufficient evidence at this time - such as a triangle B wave. The evidence for the above count would be four-fold: 1) the breadth of the advance since the March 23rd low, 2) the $NYAD line having recently made a new high, 3) the NDX having made a new high, and 4) the current locations of the lower daily Bollinger Bands and the 100-day SMA.

So far, the market seems to be following this script. There was a first wave down, and then - instead of breaking loose lower on an overnight gap down on Friday - the market backed off a bit again, and may be making a second wave higher.

Have a good start to the weekend.
TraderJoe

Thursday, June 11, 2020

Stuffed

On May 28th (in the post at this LINK) my commentary read, "My market outlook is reverting again to 'negative', and, yes, I might be a few days early. (This is a wave-counting outlook only, and is not to be taken as trading or investment advice.)". As expected, I was a few days early.

The reason I made the call is that it is possible to do two things at once. It is possible to both hold a negative market outlook, and to continue counting waves to failure. Then, I showed you my intraday screen with "what to do while not counting waves". Intraday today, prices are lower than where I turned negative.

On June 8th, I showed a chart of the lowest put-to-call ratio I had ever seen. Then on June 9th I wrote,

"So, if we are making a fourth wave, prices 'could' go over the top again. The key is to see whether a channel count is more-or-less respected for the wave overall, and if the Elliott Wave Oscillator gets back down near the zero line to be followed by an additional wave higher.

If the whole thing breaks down, then the odds build of only a three-wave move up."

On the four-hour chart, which you can see in the prior post, today we got the answer of likely only three waves up. The a-b-c count. There is no fifth wave that in any way resembles the length of a first wave or third wave up. In basketball terms, the market's "jump-shot was stuffed." The Elliott Wave Oscillator did show the way lower, but fourth wave boundaries according to The Eight Fold Path Method were not honored: end of discussion.

Many of you wrote in to say that this potential minute ((b)) wave count was preposterous. With the market closing in on the 3,000 level, does it still look so preposterous?


All that is required to occur for a "running B Wave" is for price to cross back over the Minor A wave - at least in the futures. Price is not there yet, but the lower daily Bollinger Band and 100-day SMA indicate that it could get there, and they "might" offer some support to price. Still, nothing in this post is to be interpreted as that downward movement 'has' to stop there. It is a good option, nothing more. Prices certainly could go lower, depending on sentiment.

Readers of this blog are encouraged to plot the Daily Bollinger Bands (18,2) and the 100-day SMA to see where they are located.

As shown, the alternative to this count is that we have made a durable and lasting top today. That remains to be proven. I just want to emphasize that this post is being made with only part of the day's data. I reserve the right, after looking at subsequent market data to upgrade these labels to Intermediate (A), and Intermediate (B) if a running flat does occur.

Have a very good start to the evening.
TraderJoe

Wednesday, June 10, 2020

FED Day - No Help

In today's whippy action created by the Federal Reserve Statement and Press Conference (I didn't watch - let me guess, "more free money"?) nothing was resolved in the wave count.

ES Futures - 4 Hr - Whip

The Elliott Wave Oscillator (EWO) could still do with some further downward movement to get closer to the +10% to -40% range of the prior peak. And price in a fourth wave would be expected to challenge the lower channel line, but has not done so, yet. There are 116 candles on the chart - narrowing in on the recommended 120 to 160.

Have an excellent start to the evening.
TraderJoe

Tuesday, June 9, 2020

CPCE - Interim Post

Commensurate with the chart shown last night of one of the most historic lows in the put-call ratio, stocks made a cash gap lower to likely start a pullback of some kind. I said for a Minor C wave up, a fourth wave lower and a fifth wave up were needed. There is no guarantee these will occur.

ES Futures - 4 Hr - Pullback

With 108 candles now on the chart, and on further inspection of this wave - given where the 0 - 2 trend line is located, I wonder if Mr. Market slipped us a leading diagonal that no one (including me until now) caught hold of ? And I try to pay attention to these things. See the brown lines slanting upwards.

So, if we are making a fourth wave, prices 'could' go over the top again. The key is to see whether a channel count is more-or-less respected for the wave overall, and if the Elliott Wave Oscillator gets back down near the zero line to be followed by an additional wave higher.

If the whole thing breaks down, then the odds build of only a three-wave move up.

Have a good start to the day.
TraderJoe

Monday, June 8, 2020

HH Day

Overnight the intraday screen was not in the same set-up as in the previous two examples. The ES 30-min chart gapped higher, and made a tick new high which did become a valid up fractal. Then, it traded mostly sideways to down, eventually filling the gap - see the black circle in the price chart. The intraday slow stochastic did not become embedded until after the cash market was open for a few hours. As it did, today's up fractals were broken higher.

ES Futures - 30 Min - HH Day

It is possible today's structure made a barrier triangle or a flat and a series of smaller i, ii's. Regardless, today became a higher higher (HH) day, and the prior (c) = 0.62 x (a) Fibonacci relationship shown on the four-hour chart was broken. This ups the odds of being in the Minor C wave. Today made a more typical pattern for the intraday slow stochastic. There were no instances of having more than two consecutive closes over the upper band. Still, the grind resulted in higher prices.

The ES 90% retrace level is at 3,270, and today prices traded slightly over 3,231, which was the R1 daily pivot (classic calculation).

I had to wait until 6 pm to get the data for this chart, but it bears paying close attention to. There are very few lower numbers in the series, and it should be treated with some respect.

Put/Call Ratio - Daily - Near Historic Lows


Have a good start to the evening.
TraderJoe

Saturday, June 6, 2020

Trillions

There is a Showtime channel series called "Billions", starring Damian Lewis and Paul Giamatti, but apparently the show only deals with chump change. As we know, the latest stimulus packages from Congress and the U.S. central bank are now each sized in the trillions of dollars. Given that as the case, here is the longer term chart of the cash S&P 500 Index. We know the NASDAQ 100 and NDX have 'gone over the top'. We know the S&P500 has gone up past 78.6%, and may - even eventually - be on the way to 90% or more.

S&P500 Cash Index - Monthly - Degree Labels

We don't know for a 'fact' the S&P500 cash index will get to 90% or 'over the top', but it certainly can. So, why is this analyst is so 'flexible, calm & patient", and not so adamant as a certain very large Elliott Wave service is that a large market turn downwards is immediately underway? After all, who wants to be incorrect, right?

I maintain that the five-wave, non-overlapping, impulse count to the high in October, 2018 is, and was, completely and entirely correct. That conclusion is based on applying correctly sized degree labels to the chart above. These degrees have not changed since the inception of the chart. The degrees are shown as Primary, Intermediate and Minor from bottom left, and progressing up the chart to the SuperCycle. I will not engage in the practice of back-labeling long-standing waves as many Elliott analysts do at every turn.

What I am doing today is providing you with the labels at the top of 2018. It is my contention that the SuperCycle ended at that location. Since that time, we have had three Minor waves down to Intermediate (A) in December 2018, three Minor Waves up to Intermediate (B) in February 2020, and five Minor Waves down to Intermediate (C) in March 2020. This last wave down was counted as a diagonal, and could have been leading or ending. It still could be either, but at this time there isn't a good sign of a significant down turn.  So, IF this up wave makes 90% or more, it will be, yet again, be a flat wave. Why?

The three Intermediate waves down (A), (B), (C) likely make up a Primary wave lower. This is because of their total time duration, speed of the last drop, price extent, and economic impact. This is most probably Primary wave ((A)), lower. This degree designation makes sense with "the fastest drop ..", etc. comments heard on T.V. I have not seen anyone else provide this degree designation - although I don't follow every one on the internet. I can tell you it is independently derived - even if someone else comes up with it.

As such, from what I can tell, the entire era of easy impulse wave labeling has ended. We are now going to make a series of Primary waves designed to get the Cycle wave down considerably lower. The sequence should be Primary ((A)), Primary ((B)), Primary ((C)) to Cycle A, lower. The next easier to label impulse wave may not occur until that Primary ((C)) wave lower.

And, if we are in Primary ((B)), up, the market can go almost where it will, again. This is The Fourth Wave Conundrum at Cycle Degree now, and larger, and the conundrum happens at every degree of trend.

Many people said they wish I would concentrate on the longer term. I was not willing to do that until this point in time. The reason is simple, if prices 'go over the top again' it will confirm that the drop in stocks from 1929 to 1932 was SuperCycle [II]. And it would confirm that SuperCycle [II] was a SHARP wave, and that SuperCycle [IV] will be a FLAT or compound wave.

Yes, there is still a chance that the S&P500 because of the composition of it's stocks will not 'go over the top', and that the diagonal is leading. But, those probabilities are dropping every day, and the majority of diagonals are 'ending' anyway, which lowers the odds to begin with.

So, I remain flexible, patient and calm. I do maintain that it is only proper degree labeling that can result in fewer times Elliott Wave charts need relabeling, and only proper degree labeling that can help answer "where are we in the Elliott Wave count?" with any level of confidence.

You will note a lot of analysts are trying now to pair the 2011 decline with the 2020 decline and have both be of the same degree - calling 2011 Cycle II, and 2020 Cycle IV. The problem with that scenario is they both present as FLAT waves, so there is no alternation. Oh, and it requires relabeling past waves which got us to the orthodox Elliott Wave top in 2018 just fine.

Sunday Morning

I added to this post on Sunday morning to outline a couple of ways a Primary ((B)) wave 'could' evolve in the SPX, if and only if, prices eventually at least get to the 90% level. Remember, a Primary ((B)) wave must be composed of at least three Intermediate Waves (A), (B), (C), or (W), (X), (Y). The first of these options, with the Minor B wave "running flat" would take more time

SPX & ES - Ways to Evolve Primary ((B))


Have a nice rest of the weekend. I'm interested in your comments. P.S. This is the second post this weekend, and you may wish to review the first one, also.

TraderJoe

Friday, June 5, 2020

One Fibonacci Relationship

Try as I might, I can find only one, good simple Fibonacci relationship in the current wave structure on the ES 4-Hr chart.

ES Futures - 4 Hr - Three Waves

That relationship is shown as (c) = 0.618 x (a) to a very, very close approximation.  Yes, this would still be in a minute ((b)) wave count, upward, overall. Perhaps it will be a running b wave.

First, let me state very clearly that I am showing an alternate count of 1,2,3 which would be in Minor C. Don't worry. If Minor C occurs, I will downgrade those labels to minute wave status. Right now, I just want clear numerals on the chart. But, for Minor C, there should at least be a good fourth and fifth waves higher. They are not in evidence. They could be later. They are not now.

The rationale for this count is as follows: 1) as we were counting upward from the end of the flat, I remember waiting for 'days and days'  for the fourth wave, iv, of (a) to complete. There were first three-waves down, but the wave refused & refused to make the new high. Then the new high occurred, and it ground on and on. The wave iv of (a) location shown is the only one that looks like a fourth wave on the EWO. 2) There is a large sideways correction in the middle of the chart. I was able to count it as a triangle in the futures, and just a shorter triangle in cash - as you know. A triangle at this location is very, very unusual except in corrective waves. 3) Today's price spike on the employment report drove the Elliott Wave Oscillator (EWO) almost to a new high, but not quite. It may go there yet. 4) There are only 93 candles on the chart which is less than ideal compared to the desired 120 - 160 for making a decision via The Eight Fold Path methodology. But a 2-Hr chart puts 186 candles on the chart, and that is roughly equally bad. 5) If there is actually no triangle in the middle, then the best I can see is a sideways second wave.

Even though price gains are large, something just seems very 'weird' about this wave. It is very, very hard for most people to count, and that is often the very hallmark of a "b" wave. By far and away the largest gains are coming in the overnight session. That is not necessarily odd, but a gap on a cash chart used to be something of a rarity. Something to notice, and perhaps retrace into. But, there are now so many of them. If U.S. institutions are not doing the buying, is it possible some foreign interest has been told to buy U.S. equities - perhaps as repayment for creating the Covid-19 problem? I'll never know. I'm the last one they tell. Something is going on. Why all the massive evening gaps?

Have a good start to the evening.
TraderJoe

What to do when not Counting Waves - 2

Here is the Intra-day screen which follows from the post below, at the time of the futures settlement. This follows from the post below - which was done before the cash market opened.

ES Futures - 30 Minutes - End Of Session

As you can see, after six consecutive candles upward, the odds were just too low of more consecutive candles closing outside of the Bollinger Bands. During two portions of the overnight session the slow stochastic was fully embedded. After candles started trading inside of  the bands, the intraday slow stochastic lost it's embedded status and towards the end of the session price and the 18-SMA tried to come together. On the daily chart, price broke through the upper daily band at 3,192 and settled below it at 3,187, with a half-hour left to the end of the electronic session yet.

Maybe this weekend there will be more.

>> This morning -

We had a similar set-up going into the overnight session last night. (Refer to this POST for more detail.) There were two clean fractal breaks higher, shown as ^ , with price over the intraday 18-SMA (ES 30-min) AND while daily price was over the 18-day SMA. This morning's employment report rocketed the futures higher, up over the intraday Bollinger Band.

ES Futures - 30 Min - Employment Report

It is interesting that the wave ((2)) shown never will even show up in the cash market. Obviously, just being over the 18-day SMA is not a 'sole criterion' for, then, prices, once over the 18-day, would never move under it. I do have a 'big' question over whether such a move will be a fifth wave in it's entirety or form a larger ending pattern like a triangle or diagonal in the cash market session.

It is now time to watch the upper 18-day Bollinger Band, as well, and see what the cash session brings.

Have a good start to the day.
TraderJoe

Thursday, June 4, 2020

No Crash Today - What Will Tomorrow Bring?

A lot of blog readers and commenters have been suggesting this was a 'C' wave up to a terminal count. Yes, that is still possible. I noted that count with the red ALT:B many, many days ago at this LINK.

But, if it was, today should have been a relatively easy to count, 'crash day' downwards. But, is that what happened? It is true the NQ futures did make an outside reversal day down. But, it's daily slow stochastic is still embedded. The ES futures did not reverse - and just kept an inside day, and the Dow closed positive on the day. None of the other daily slow stochastic indicators has dropped below the 80 level from what I can see.

Was there price movement lower? Yes. But, now it is really a question of whether we go over the top again or not. The best case I can make for a lower count is this one - a leading expanding diagonal in the ES 15-minute futures.

ES Futures - 15 Minutes - 'Potential' L-D

But, this is only a 'potential' pattern. Is is not even completed and could likely need another wave lower to be longer in time and price than wave ((3)). That is not in evidence yet. So, we 'must' carry an ALT: iv at today's low.

As I pointed out in the prior post's comments, blue .b is shorter in price and time than the gray a wave, and is therefore a valid sub-wave.

Have a good start to the evening.
TraderJoe

Wednesday, June 3, 2020

What to Do While Not Counting Waves?

Most Elliott wave counts of importance take place on the Weekly, Daily and 4-hr time frames. Shorter waves may be countable or provide information on overlaps, but for some day-traders that can be a lot of time to wait trying to see if a wave count completes, and a reversal begins. What to do with the intervening time?

A while ago I published a Paraphrase of Ira Epstein's Guidelines for Trading at this 
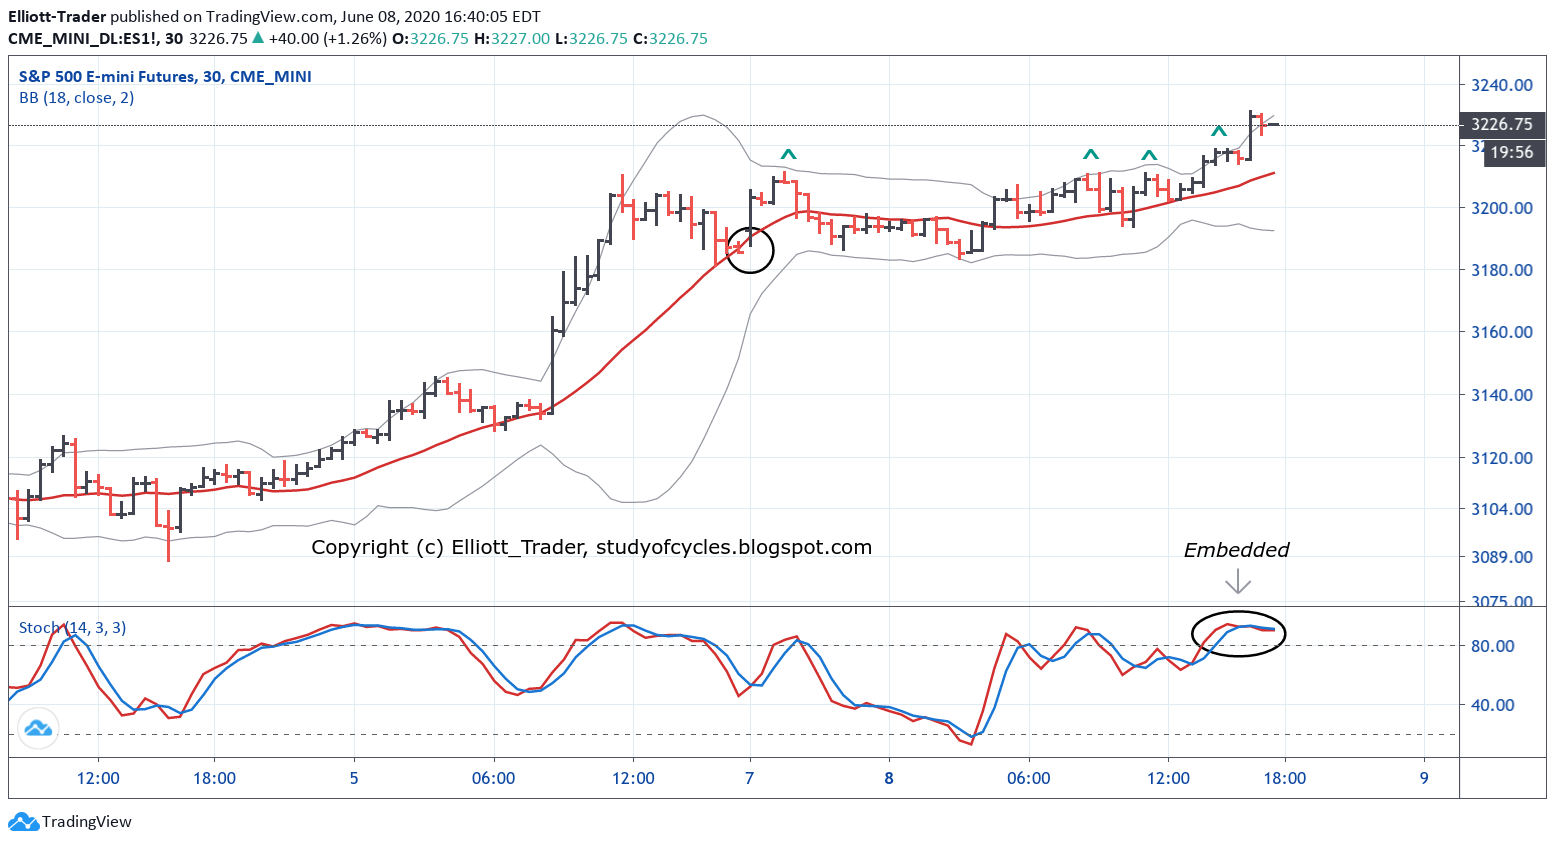
LINK. One of the key guidelines is that "The 18-day SMA is the Line in the Sand". No short trades are taken above it and no long trades are taken below it. Now, have a look at today's intraday chart (ES 30-minutes) which I was following for my own account.

ES Futures - 30 Minutes - IntraDay

What do you notice? It looks remarkably similar to one of the same daily charts. It should, it has an 18-period SMA, and Bollinger Bands (18,2), and the Slow Stochastic Indicator on the chart.

First, what if a person were to screen the entire upcoming day by first realizing whether prices were over or under the daily 18-day SMA? In other words, if daily prices are above the 18-day SMA, then only long trades could be considered intraday. If prices are below the 18-day SMA, then only short trades could be considered.

That being the case, starting at the lower left look for the first two-bar fractal that breaks upward. That 'could be' an entry.. ummm.. IF you are awake, If you decide, etc. (Remember, nothing here is trading or investment advice. You are responsible for your own trading decisions).

Now, notice how the slow stochastic goes "embedded" while price is "riding" the upper Bollinger Band. This is the strongest technical signal. That being the case, this methodology would suggest at no point would a person consider being short - both for the daily chart, and the intraday chart.

But, then, as Ira suggests, notice how there are four consecutive closes above the upper daily Bollinger Band. The chances of being above the band at random at any time are only 5%. And, you subtract 1% for each further consecutive close. So, what does that get us? 1) 5%, 2) 4%, 3) 3%, and 4) 2%. Yes, after that fourth candle, there is only a 2% chance the next bar will close outside the band.  And, it doesn't.  In fact, there are a series of candles lower down to the lower band.

The guidelines indicate one should not "buy new" over the upper band, but one can "let profits run" - until the slow stochastic again closes under the 18-period SMA.

If one exits sometime after 07:00, then one still does not go short because the price is still above the 18-day on the daily chart. But one would look for fractals to break upwards after price recycled down to the lower Bollinger Band which is typically at the 50 to 62% retracement zone. Again price gets above the 18-period on the intraday chart, the slow stochastic goes embedded and price never gets to the lower band again - a sign of strength.

Then, before noon, there are fully six closes over the upper intraday Bollinger Band. These occur while the slow stochastic is embedded, and price is "riding the band". But, the six consecutive closes means that  there is a near 0% probability of the next bar being outside of the band, and again, it isn't. Prices sneak inside the bands for next seven candles, until the last candle of the day which again tags the upper band. The slow stochastic then loses the 80% level as prices fall off, with the expectation that price returns to the 18-period SMA on the intraday chart.

Does this sound familiar? It should. It's why I keep trying to separate "trading" from wave counting. But it is based on some simple ideas. First, why did I chose a 30-minute time period? Everyone will say, because you can divide the 24 hours of the day by 30 evenly, and you can evenly divide the cash session into 30 minute periods too. Yes, but that is not the complete answer.

The complete answer is that Bollinger Bands are based on "two standard deviations from the mean". And I once learned in statistics class that it is only accurate to calculate a standard deviation once you have 25 observations or more (like to calculate the standard deviation of the heights of dogs, you need at least 25 height measurements).

Well, 24 / 2 = 48, meaning that 48 half-hourly bars should allow for a very, very accurate calculation of standard deviation for a day's trading. The other realization is that if the Elliott Wave is truly fractal in nature, then if the daily Bollinger Bands are good guides on the daily chart, then some subset of them should also be good guides on the intraday chart.

But, next, how effective would it be if one only looked for new long trades when one is over the 18-day SMA, and not over the daily Bollinger Band? And how effective would it be, if one only looked for new short trades when one is under that 18-day "line in the sand"? Are you this disciplined? Or, are you looking to "top-tick" the wave count? From that paraphrase of the trading guidelines, at least one broker (Ira) suggests it might be better to see if the wind is at your back first.

And, how effective might it be if one only took trades as above, in combination with the same direction as shown in the 30-minute chart?

I don't know. I don't know what you will decide to do with this information and this example. I only offer it for your consideration. It is not to be considered as trading or investment advice. I don't know your skill level. I don't know your financial situation, I don't know how familiar you are with fractals. I don't know know how much of an appreciation for standard deviation you have. So, your decisions have to be your own.

To be more complete, I add the daily (classic calculation) floor trader's pivot points to see where there may be targets, but I don't know if you have access to them, or an appreciation of them. Many do. Some don't.

So, that's what I do when not counting waves. How about you?

P.S. This is the second post today. The shorter term wave count of minute ((b)) is on the prior post.

Have a great rest of the evening.
TraderJoe