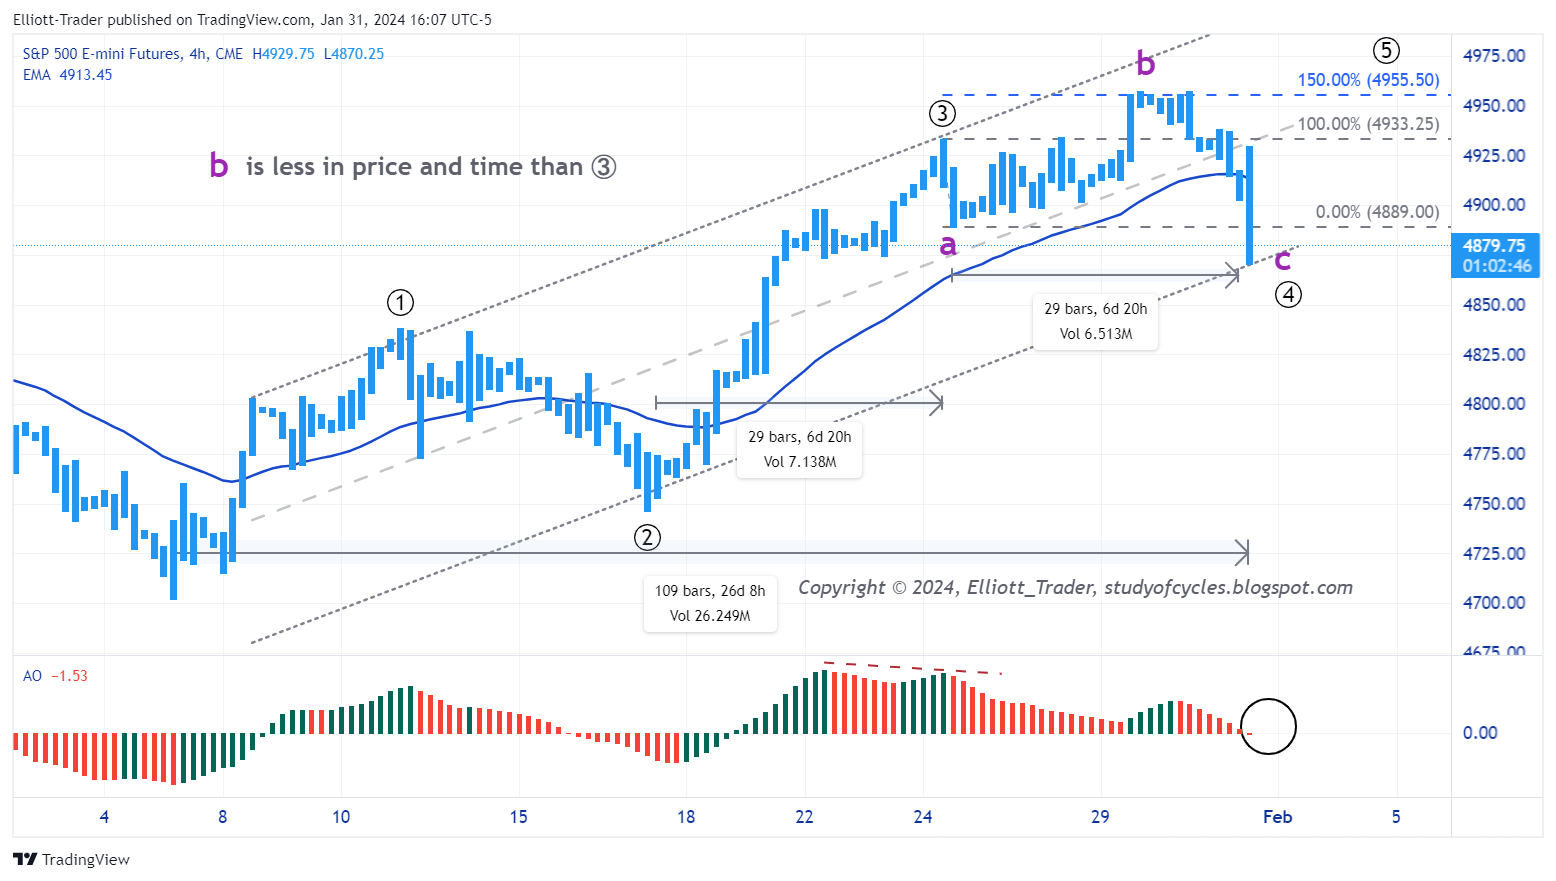
Unlike much of the U.S. - which is experiencing a warmer than normal winter - the Elliott Wave Oscillator (or Awesome Oscillator) went below zero on the four-hour chart of the ES futures with about 109 candles on the chart. Further price movement lower is possible either in the overnight, or in the cash session tomorrow.
There is (or is near) contact with the lower channel line, and the expanded flat would alternate well with the second wave. The analyst needs to, of course, be on the alert for any downward overlap, but so far, a fifth wave, up - should it occur - might fit the bill to end the wave within current limits of 4,995. We need to see how other countries/areas (Europe, Asia) react to the Fed's news today.
On a daily basis, the slow stochastic remains embedded at this time so there might still be some Smart Money interest in an up wave. Time will tell.
Here is a reminder of the daily ES count - with the extended first wave - that seems to be the best fit at this time.
If correct, we are into the smaller degree waves now. The alternate for the count is shown in red below the prices. If the black count is correct, then price must not exceed 4,995 in this wave. If the red count is correct, it would likely.
On a short-term basis there is the possibility of a 15-min expanding triangle in the SPX cash chart (which at this time can be seen at this LINK). So that means another high (or a failure wave up) is possible. Perhaps this will occur into the FED's FOMC decision tomorrow.
Note the RSI is presently diverging from the peak wave. We need to see if that continues. From a timing standpoint there are 63 bars in this chart. Note that 13 trading weeks is 13 x 5 = 65 days. So, we are in the vicinity of a Fibonacci 13-week turn date, too.
The SPY cash 2-Hr chart is below. On a shorter-term basis - as we wrote previously - we are tracking a seeming sideways wave as a flat or triangle. As you can see a channel has been added to the chart.
Suspiciously, two gaps open are located above the 38.2% retrace level, and it is possible that one or both could fill in the upcoming week. The 50% retrace level is also shown, and this would be about a maximum for a fourth wave.
Yes, there are still ways price can go over the high again (such as a compound Flat wave), but for now we are watching to see if the local lows are exceeded first.
And moving price sideways. The movement started with a violent wave down as contracting triangles usually do. Today, prices were whippy and best seem to count like this on the ES 1-Hr chart.
The current ES 8-Hr chart is below. Today, prices made an outside bearish engulfing candle at the 1.272 extension of the prior wave up. We have been looking for a wave to finish wave minute-v, circle-v. The chart shows a plausible count in the event there is overlap that disqualifies an impulse.
ES Futures - 8 Hr - Plausible if Impulse Overlaps
So far there only look like three-waves-up, labeled as a,b,c of (i). IFF a diagonal wave forms, it could have 62% or greater retrace waves. Again, this is only a plausible count if an impulse does not form. It is way too early to actually call a diagonal. And there are still ways that - if today was a third wave - that a fourth wave could form and still follow the rules. Such a way would be by forming a triangle to avoid overlap.
So, as usual, patience, calm and flexibility are called for until a count that follows the rules materializes. And, more specifically, while there is one eight-hour reversal candle, all such candle patterns need to be confirmed - in this case with a significant lower low closing candle.
It took a while but in the after-hours the ES futures made a higher high and is likely into a fifth wave up.
Given the length of the third wave, the fifth wave can travel a while. Sometimes it works to now revise the upper parallel trend line so that it is anchored on the third wave terminus.
Every so often readers ask about trading in association with Elliott Wave counting - and not just the pure discipline of Elliott Wave counting. To that end, previously I developed a paraphrase of Ira Epstein's publicly available guidelines for trading (link below this article). As you probably know by now, Ira says never to go naked short above the 18-day SMA, and never to go naked long below the 18-day SMA, along with a number of other guidelines regarding Bollinger Bands and the daily slow stochastic. But is there something more formal or related to Elliott Wave Counting in particular?
For those really & sincerely interested in this topic I will include a real-time, real-life example after the video below. But the video below is one of the best videos overall on trading with Elliott Wave done by a man with serious trading credibility - Master Trader Bill Williams. If you will watch this video through and through, you will get an appreciation for trading that very, very few have. The video is a bit more than an hour, and you should watch it when you have the time, and the mood to really digest it.
I have watched this video about eight times now. And it includes a much better description of markets, market psychology, and trading technique than you will find in any of the standard EW textbooks. IF you make a study of the video and evaluate it critically you will find some gems and, yet, some topics are glossed over. In order to deal with some of the topics that are glossed over, I will show you this current real-time trading example. The chart is daily WTI Crude Oil futures (CL).
The chart includes most of Bill Williams key indicators. It has on the bottom in the indicator panels the Elliott Wave Oscillator (or Awesome Oscillator, known as EWO or AO) and the Bill Williams Accelerator - which is the 5-period simple moving average of the EWO/AO which is known as the AC. The chart pane shows the "Balance Line" in blue which is the chaos price attractor. I use the EMA-34 and find it superior as it doubles as a wave-counting tool.
Further, you will see the Bill Williams up (green triangle) and down (red triangle) fractal indicators. The basic idea is one buys fractals above the balance line, and one sells fractals below the balance line once they are "hit" or traded though. These are Bill Williams "blind-chicken trades" in the video. So, if you have watched the video, you can follow the progression of fractal-hits and sells as CL progressed lower. I won't go through the progression. If you are serious, you should reproduce this chart, do this as an exercise, keep track of the profit and loss, etc. What I will do is comment on some of the items Bill glosses over a bit.
Regarding the Williams Trading System
You must be well-capitalized! Look - after a while Bill got rich beyond what some of us can dream of. He was well-capitalized. When he says that you take the fractal hit, and then "you must trust the market like a religion", or "you must be ok with it", what he is really saying is that you must have enough trading capital to be comfortable in the trade and not care which way the market goes.
Look at that first fractal hit below the balance line at the red arrow. After just three daily bars it is immediately retraced by about 62%. And the retrace lasts almost 10-days. So, either you must have the capital to withstand the retrace OR your initial position must be small enough to withstand the time and price in the retrace. Alternatively, you can use a rule to wait until AFTER the retrace following the initial fractal hit to give the retrace time to work out & then initiate the position. Said another way, "Patience can be part of your trading capital!"
Watch the Fibonacci ratios like a hawk! Bill doesn't address the Fibonacci ratios in the video. I tried to in The Eight-Fold-Path Method. Notice how wave (iii) in daily CL hits rather precisely at 1.618. The Fibos might be used as a profit-taking target or a warning to 'lighten up' - depending on your preference, profit built up in the trade and/or trading style. Notice how the potential triangle comes back very precisely to the 100% Fib (Fibonacci ping-pong?).
This can lose money. Bill says this in the video. If you get in a range-bound market, you run the risk of getting whipped until you recognize it is sideways price action. So, look at the above chart. Notice the potential triangle! Notice how there are fractal hits above the balance line - which, if taken - would cause losses. This is where the Principle of Equivalence comes in, and why I developed it. We all know triangles can bust. If you haven't had one bust on you, you haven't been trading long enough. So, we don't assume and try to follow the fractal breaks. We count waves and see if there are zigzags or impulses inside that structure. We try to see whether it will bust up or bust lower, and, if lower, we follow the fractals lower.
Premature reversing. In the video Bill says, "when we see the momentum slowing down, we start entering orders to go in the opposite direction". In the above chart, this would be like entering orders to go long inside the triangle, or inside the fifth wave down. OK. Remember, he is well-capitalized. For the small trader this can be a mine-field. I recently saw a video done by Jeffery Kennedy of EWI where he called a fifth wave after a triangle, and you know what? Even given this expert wave-counter, the fifth wave kept extending, and extending, and extending. Do you want to be in this situation?
Volume & candles. The Bill Williams indicator that is not included in the chart above is what he refers to as squats, greens, fades & fakes. You are encouraged to investigate this more on your own, but the basics is this is how price reacts to volume. Personally, I find plotting volume near the ends of waves, and looking for simple candle formations and confirmations of highs or lows to be a bit more useful. You'll have to make your own decision which you like better.
We don't read any current news. OK. This conflicts directly with Ira Epstein's guidelines that he doesn't trade through major news reports (like Payroll Reports, FED interest rate announcements, etc.). So, here again this indicates that Bill had enough capitalto sit through market-moving reports. Just sitting idle through a FED announcement today can cost one dearly if they get it wrong.
Intraday Filtering. IF you are a day trader, you may want to further modify Bill's system so that if you are trading a one-hour chart, say, you do not take any trades that conflict with the location of the larger 18-day SMA. Remember, the smaller the timeframe, the fewer "traders there are in the market at that moment" to make decisions or form fractals that are meaningful or significant. Yes, the market is fractal, but every fractal does not mean the same thing or carry the same weight of opinion.
In Summary. Bill's video and method are exceptionally helpful in understanding an Elliott Wave trading method. But there are some items that are poorly explained. One of the biggest is your position sizing and your level of trading capital. In the above example, it helps to look at your level of capitalization like this: you should not compare your trading capital level to mine. You should recognize - for the example in the above chart - that your competitor is not me. Your competitors for CL are Goldman Sachs, BlackRock, EWI and OPEC! Do you have enough capital, including patience, to compete with them, or can you keep your position sizes small enough that you can handle the adverse market movements with ease?! It is the position sizing & capitalization that allows Williams to trade in that calm, relaxed manner that he prefers. What do you prefer?
Nothing in this analysis is to be taken as trading or investment advice. It is being documented in one sense to have another quick reference for the future.
Have an excellent rest of the weekend.
TraderJoe
P.S. Here is the link for the paraphrase of Ira Epstein's Guidelines for Trading (LINK).
For weeks we have been saying that if that market is to complete a Primary ⑤ top as a contracting ending diagonal in the S&P500, then wave Intermediate (3) 'must' make a newer all-time higher high to express its motive character. That happened today with the SPX closing above its prior all-time high. Thus, the SPX joined the ES futures, the Dow and the NDX cash which had done so previously. Today, Friday, had the highest close of the week - convenient for a close-only chart (even though the intraday levels were exceeded, too). Here is the weekly chart of the SP500 cash index.
One target for wave (3) is shown at 0.618 x wave (1). Even though the higher high was made, a diagonal is not a guarantee. Other things could happen, such as the popular (B) wave count.
So, the SPX so far did this to follow the 'rules' of a diagonal. But you know why the market really did this, right?
Um, it's a Presidential Election year, and this is Primary season. You don't think this somehow has something to do with it? I do. You don't think the current (or any) administration would like to claim this higher stock market as an accomplishment? The machine influence on the market is too distinct to miss. Corrections are short & shallow, currently. Complacency is running rampant, and it could get worse. But, as long as you and I know the reasons we might be able to pick our way around some of the traps.
Until then, have an excellent start to the evening and the weekend.
Based on the overview of the viable paths on the daily chart (which we provided back at this LINK), these are currently the two best paths forward. The first is the pure impulse. The waves look incomplete at this time. Prices should first try to fill out the channel and remain above today's low.
ES Futures - 8 Hr - Impulse Pattern
The second path moves minute-iii, circle-iii, to the next peak over to the right, and then looks for that plausible triangle before a last-gasp wave upward of the C wave. It would look like this.
ES Futures - 8 Hr - Potential Barrier Triangle Pattern
The waves are choppy enough to consider a triangle, but if the internal (b) wave is really a "five" and not a "three" (as in the first chart), then a triangle may not be the correct structure. As always, the triangle is a potential only until all of the waves form correctly. For reasons of alternation, I don't think a diagonal will work here until/unless wave minuet (v) of minute-v, circle-v should that occur.
Both counts should be considered equivalent by The Principle of Equivalence until they are not.
Here's a reminder of the current daily count, and the invalidation levels that apply. If the extended wave-i, (circle-i) count is correct, there is both a high and a low-level invalidation level forming a band of about 300 points.
Any daily higher highs will likely also diverge on the MACD and the RSI.
The Dow's higher all-time-high and The Eight-Fold-Path Method allow one to use Fibonacci ratios to project possible targets for the current up wave. I need to be clear, having made a higher all-time high, the Dow no longer needs to make a higher high. But Fibonacci ratios says it easily can and provides a target zone for this wave. From the perspective of The Eight-Fold-Path Method there are about 100 candles on the two-weekly chart, as below. So, the contracting diagonal count with a diverging Intermediate wave (3) is a highly probable wave count - especially if the S&P500 should make a new all-time high, too. The wave may finish in the 120 candle - 160 candle range.
DJIA Cash - 2 Week - Contracting Diagonal
From the Fibonacci perspective the simplest target is provided by the C wave of (3) at C = A around 38,469. This provides the lower end of the orange target zone. But we also note that there is a near-exact confluence of Fib levels at C = 1.272 x A, and (3) = 0.618 x (1). And that provides the upper end of the current range near 40,115 with a significant degree of probability. Higher than that is possible but then the diagonal might lose its shape and would have to be evaluated at that time.
For now, we keep the analysis simple and follow the method. We don't know how long a fourth wave, (4) and a fifth wave (5) could take in time but given the degree of the move it could be a while. Further, we must note in an ending contracting diagonal it is expected - but not required - that wave (5) make a further all-time high. Usually, they do. But the market could also fail that wave as a sign of a major top, too. So, stay tuned and let's see how it goes.
Have an excellent rest of the weekend and/or holiday if you are celebrating it,
Today's action suggests one can't argue with what looks like five-waves-up on the ES hourly chart. The daily chart is below, showing where this wave (i) might fit in the sequence.
The invalidation levels are shown on the chart. Wave (ii) should not go below 4,702, and minute-five, or circle-v, should not go above 4,984 to remain shorter than the third wave in this extended first wave count.
Recall, the CPI reports come out before the market open tomorrow.
Today's up wave was (eventually) a 'wonder to behold' and fits in a third wave position as either a third wave of a fifth wave, or a "c" wave - perhaps of a triangle. We had warned that upside was still possible depending on what the Smart Money did when they got back from vacation weeks. So, now, there is this new channel on the daily chart of the SPY until there isn't.
In the above count a fifth wave must remain shorter than a third wave, since the third wave is shorter than the first. There are no downward candle signals as of the cash close. Today's up wave didn't even make any hourly down fractals after 4 AM. It was a grind, grind, grind, grind & pop wave. The result was the daily ES futures closed over their 18-day SMA again. So, the bias has turned positive with the daily slow stochastic still in over-sold territory.
Each of these four scenarios is a viable Elliott Wave count at the moment, due to the topping process we are in. Look them over carefully.
SPY Cash - Daily - First Two of Four Plausible Paths
The first path says that there have already been five minute-degree waves up in a wedge count - the extended first wave count - to a Minor C wave, to make a high of the Intermediate (B) wave, up, and the S&P500 will not make a new all-time high. A waterfall decline in an Intermediate (C) wave would follow, lower. The second path says that the fourth minute wave is still under construction as a Flat wave. There could then be a minute fifth wave up to follow beyond the prior all-time high before an Intermediate (B) or Intermediate (3) wave tops.
SPY Cash - Daily - Second Two of Four Plausible Paths
The third path says, ok, there were five waves up in a wedge count, but it is one degree lower than a minute wave degree (perhaps a minuet wave degree), and there could be a second wave down to make a minute-degree second wave. I'm showing a different symbol here just to make a distinction. The fourth path says that a third minute wave ended at the high, and perhaps, even with further movement lower or not, a triangle is developing for a fourth minute wave which may take several days to complete yet, before a fifth minute wave up. A triangle might help even out the net point differences between a second and a fourth wave. And it might signify "last wave up in this wave-set is dead ahead."
Other than the first count, the remaining three counts could help make a higher all-time-high for the SP500 and allow the Intermediate (3) wave of a contracting diagonal for a Primary ⑤th wave, or just a slightly larger Intermediate wave (B), up.
In the shorter term, unless your market metrics are exceptionally good, any of these scenarios has roughly an even chance of working out, so that the odds are only about 25% of getting it right by random chance alone. Therefore, it might be beneficial to allow the market to sort things out until valid short-term counts are obtained. As often said, patience, calmness and flexibility are essential at this time.
This morning provides a great example of why it makes little sense to count only the cash market in the SP500 versus the futures. The futures were lower overnight, and the Payroll Employment Report drove prices down even lower in the pre-market according to the 5-minute ES futures chart, below.
The Payroll Report showed lots of people getting jobs, and increased wages - higher than expected. The initial reaction was to dump from 4,720 to about 4,702. Then the market began reversing into the cash open from 4,702 to about 4,728. All-in-all this is about a 44-point excursion which is completely missing in the cash market.
Yet, these were real trades by real people and real money was won, lost, or temporarily trapped in the market as of this time. Does it make sense, as Neely and some others suggest, to 'only' count the cash market? We think while there is some benefit in doing so, since, granted, the volume is lower in the after-hours market, we think that this might apply more to the long term counts to eliminate the distractions from contract roll-overs, premium degradation, etc.
And we think it makes little sense to exclude this rich detail, including the truncation at the low, from the shorter-term wave-counting exercise - at least until the daily and weekly data are compacted into the larger degree wave count.
And regardless of today's news and the current count of five-down (including the futures), all this argues for is monitoring the high. The Primary ⑤ diagonal count, and the Intermediate (B) count both allow prices over the high again, so do not be surprised if the S&P joins the Dow and the NDX over the high. It is not required for a topping count, but both counts allow it.
Below is the ES 8-Hr chart with approximately 140 candles, well within the range of 120 - 160 suggested by The Eight-Fold-Path Method. The EWO has come back below the zero line, still well within the range of +10% to -40% suggested by the method.
This suggests the 'last chance' for a fourth wave is likely building. We can perhaps count one earlier, but its signature does not show up well on the EWO. Let's see how it goes.
%202024_01_30%20(4_17_10%20PM)%20Impulse%20C2.png)


