Tuesday, March 29, 2022

All But Two

The ES futures have now broken all of the daily up (green) fractals on the daily chart below, save for two - the left-most one, marked with the green triangle, and the all-time-high.

ES Futures - Daily - Still Embedded

Price, too, is nearing the 78.6% retrace level, above which truncation becomes more plausible. Although we proposed a way today that we could count a completed wave up, we said that it is likely a very poor assumption to suggest that down movement is underway without lower lows. The daily swing line is up until it isn't, and the daily bias closed positive.

With today's price movement it is again possible that the upper daily Bollinger Band will move out again, and that seems to be the game being played by the Smart Money until it isn't.

Have an excellent start to the evening.

TraderJoe

Monday, March 28, 2022

Up Wave Still Being Monitored

Here is the SPY 30-minute chart. We are still monitoring the up wave. Cash did not maintain the measurements of a true diagonal, therefore, the best count at this time is that we are still in the impulse (v)th wave, with iii of (v) today, as below.

SPY Cash - 30 min - Impulse

The best alternate labels are also shown on the chart in red. Interestingly, the lack of a diagonal wave may signal that IFF five-clear-waves can be counted upward, then another five-wave-sequence, up, might follow it after a correction. And, yes, there could be a "turn-around-Tuesday ", i.e. lower.

Have an excellent start to the evening.

TraderJoe

Sunday, March 27, 2022

Weekend Video - It's Been A While

Here is a short (8 minute) video with an overview of the Historical Dow Jones Industrial Average, and a chart which may be used to make a forecast.


It's been a while since I made one of these but thought it might be worthwhile. You might think the idea is a bit off-kilter, but it is based on EW logic. Perhaps the money printing has merely distorted the "size" of the latest waves since 2009.

Have an excellent rest of the weekend.

TraderJoe

Friday, March 25, 2022

Only Questions Today

Today, after what looked like a high after the triangle, we tried counting downward. It worked for a while, then it didn't work, then it worked again, then - in the last half-hour - it didn't again.  As a result, I have no firm conclusions, but a couple of options. It is possible that non-linear and overlapping action on the ES 2-Hr futures below is either a leading diagonal or we have passed the first wave (i) and are making the red a-b waves, with a downward corrective wave to follow.


Today was reminiscent of the typical "Goldman Sachs" buy-back in the last half-hour, and it was a Friday after-all. So be it. It made the internal wave structure very difficult to count, and therefore, I would be as happy with the b wave as I would be with the diagonal.

This chart & commentary was added on Saturday morning. When one looks at cash rather than futures, with 130 candles on the 30-min chart, it is possible that a v = i move might still occur.

SPX - 30 min - Close Only

Maybe the minor break of the ii - iv trend line is what Elliott would have called a typical 'throw-under' and is a second wave after a "Running Flat" that ended with the diagonal counted out in real time. This pattern would be signaled by a gap-up on Sunday night. The chart is still offered in the spirit of questioning.

Have an excellent start to the weekend.

TraderJoe


Thursday, March 24, 2022

Post-Pattern Confirmation (PPC) - Step 2 Did Not Occur

Post-Pattern Confirmation (PPC) - Step 2 Did Not Occur today. That required a retrace that did not go over the prior high. By 4:05 pm ET today the ES futures ticked over the prior high. We did count a potential diagonal downward correctly. Only it was its contracting triple zigzag counterpart that was leg c of the new running triangle shown below on the SPY cash 30-minute chart.


The prior upward count did not have critical alternation for the fourth wave. Now we know why. The new count provides a clear sideways triangle to alternate with the directional sharp wave (ii). The 0 - ((ii) trend line now clearly shows a break for wave (iv). And now, the time taken in wave (iv) clearly exceeds the time taken in wave (iii).

Wave (v) can now run a bit if it wants. Well, try as hard as one can to count properly, there are a lot of things to consider. We were counting upward after the diagonal leg today. That was a real plus! But, we clearly did not count out the new shape of the wave, until we could look at if after the close. That's OK. We have a nice impulse wave shape in formation which might be an excellent example of the things to keep in mind while counting. And, the clear impulse likely means we got the truncation bottom entirely correct.

Have an excellent start to the evening.

TraderJoe

Wednesday, March 23, 2022

Post-Pattern Confirmation (PPC) - Step 1

Yesterday, in our post entitled 'Five-Up' we showed the likely five waves of an impulse wave upward. If that were the case, then for at least a correction lower, we should have been able to count on a smaller degree chart the 'five waves down'  of the start of a corrective wave as the first step in post-pattern confirmation to help confirm that the upward impulse was done. Today, we did do that, and since yesterday's chart was the SPY 15-minute chart, today's chart is the SPY 5-minute chart to represent the smaller degree. That chart is below.

SPY Cash - 5 Min Close Only - Diagonal

We first tried to count an impulse lower. Notice the 'base channel' in magenta. That did not work - plain and simple. When that channel was broken to the upside, we then switched to trying to count a diagonal wave.  And so far, that was successful. There are five clearly discernible but messy waves downward in a wedge. If you were counting it or trading it, you could feel the market pull back against every down wave trying not to give an inch. Only small sections whooshed like a third wave.

A couple of notes: we counted out the barrier triangle wave iv yesterday, and we said the wave would likely turn below the low of wave ((E)) of the triangle. It did. Second, the first down wave occurred largely in the overnight so - when you look at the futures - wave ((1)) down of the diagonal is also much longer in time than the third wave down.  The diagonal in its current form is good down to 4,433 and the futures near the close are at 4,444. If there is a violation of that level in the overnight, we simply reserve the right to reconfigure based on the futures. Lastly, I upped the degree at the high one level based on the overall length of the wave.

So, with a likely smaller degree 'five-down' at this point we have the first step in Post Pattern Confirmation (PPC) from the impulse upward. The second step in PPC for this count is a retrace that does not go over the high, and the third step in PPC is a lower low than the first five waves down.

Since the market started with a diagonal down odds lean towards a corrective wave lower. They certainly do not guarantee such. The market is whippy - thinking caps are required firmly in place.

Have a good start to the evening.

TraderJoe

Tuesday, March 22, 2022

Five-Up

Yesterday, we said we could only count a 5-3-5 wave down during the session. Higher highs were possible. Today those higher highs were made making the first time we can count fives-waves-up since the likely truncation lows. This applies to both the ES futures and the SPY cash 15-minute chart shown below with about 162 candles.


Both the second wave and fourth wave locations are clearly seen on the Elliott Wave Oscillator EWO), and the EMA-34 through the waves indicates good form and proportion to them. This is not a diagonal or a triangle. It's just a grinding, non-overlapping impulse upward. The caveat is that the fifth wave, v, may not be completed yet. There is a barrier triangle at the high - which was counted out live and in real time - and the low of the triangle needs to be exceeded lower before a down move can be considered.

This impulse took days to form. Then it is a question of how deep any correction would be, and how long it would take. Interesting stuff.

Have an excellent start to the evening.

TraderJoe

Monday, March 21, 2022

Day of Consolidation ?

Today's cash close difference in the SPX Daily chart below shows a decline so minor - as of the close - that it is likely to be a day of consolidation. 

SPX - Daily - Little Change

On the intraday chart in the comments section for the prior post [see LINK here] we can count only three waves up to today's high: i/a, ii/b, iii/c. But, during the day today it is also fair to say we could only count three-waves down which were shown in great detail as 5-3-5, so far. So, we are waiting to see if that is the extent of a fourth wave in an up count, or if those three waves down begin a triangle, or diagonal - because the amount of time spent in consolidation seems relatively short in comparison to a third wave up, iii/c, on the intraday chart.

If a down move instead begins, such a move would at least likely start with a diagonal given only the three waves down, so far.

Have an excellent start to the evening.

TraderJoe

Sunday, March 20, 2022

Speed Comparison

A look at the ES futures 4-Hr chart below shows that, regardless of the prior peak from which the measurement is taken, the recent up trending wave occurred in less time than those two waves.

ES Futures - 4 Hr - Faster Wave

So, while valid retraces can occur at any time, and perhaps some quite significantly, Neely's work suggests this is a significant criterion on which to base the suggestion of a new wave to be counted upward. The upward wave has already reached the 50% level of the entire prior down wave.

Again, with the internal count of the recent wave on shorter time frames, we cannot find a valid reason to discontinue counting upward at present.

So far, this suggests the recent potential truncation was called properly on the correct day. It also ups the odds that the prior all-time-high might be exceeded higher, although this is not for certain. 

One tip or trap to watch-out for: if people start calling for an ending diagonal wave without the first wave having gone over the prior all-time-high as a foundation, that call would likely be incorrect.

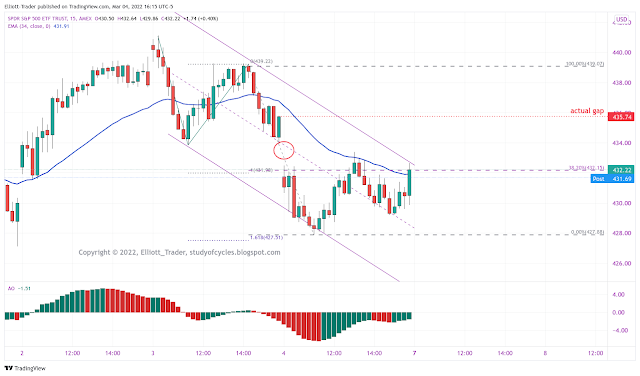
Supplemental: the Grind is on and something reeks again. Have a look at the chart below of the SPY 15-minute cash. We can easily see from the Fibonacci ruler on the left that the largest decline, here labeled ii/b, exceeds the 50% level. This should be sufficient to allow for an extended third wave, iii near the 1.618 extension.


Ok. Fine, I can easily go with that. But now observe a few items. First, in the upper left is an extension Fibonacci ruler. Right now, the extension is only near equality. Therefore, we should carry the labels a, a,b,c as well as the numbered labels. Also, note that the only truly big gaps in the third wave are downward gaps. Why is that? Who ordered those?! Where is the big impressive upward gap? Maybe it will happen on Sunday night. Price is still trading within the channel, and we don't know just yet. But the secondary labels are also being shown in case price runs into the upper daily Bollinger Band (in this area) and decides to reverse. In that case, perhaps a leading diagonal larger (a) wave up is being started as part of a larger diagonal wave 5, upward. Then, maybe an ugly 50 - 62% retrace takes place for a (b) wave of that diagonal, with a (c) wave that goes over the top.

It is very hard to say, but because iii is beyond equality, we should at least rule out the xi count in this case.

Have an excellent rest of the weekend.

TraderJoe

Thursday, March 17, 2022

Daily MACD Diverges

This count continues to have the right look at the moment. Today was further upside and is now over the prior fourth wave.

SPX - Daily - Truncated Diagonal?

The daily MACD has a higher low than prior down waves and has curled up. There is nothing yet to say that downward counting should resume - meaning we don't know the recent up trend is over. If we look at a shorter term SPX cash 15-minute chart, it looks like a third shorter wave up.

SPX - 15min - Potential Third Wave

So, it could be the extended first wave scenario again - but we need to see whether overlap occurs or not. Maybe it is yet another diagonal in formation - or maybe a diagonal in futures, and it will impulse in cash. Hard to say just yet, and tomorrow is Friday.

We're still monitoring the potential daily expanding diagonal doward, via the comments in the prior post, and if a much higher wave forms tomorrow it might exceed the upper expanding down trend line. We'll update as more becomes apparent.

Have a good start to the evening.

TraderJoe

Wednesday, March 16, 2022

Can Be Complete

Yesterday we noted the outside reversal day. We also noted it was a day when a possible truncation occurred. Today was follow-through upward on the FED meeting results. That makes this picture of the S&P500 cash index possible. And it makes going over the highs again possible.

S&P500 Cash Index - Truncated Diagonal (Bullish Falling Wedge)

I suspect things might have turned out differently if Russia had not invaded a foreign country and had the PPT (PWG) not gotten involved to prop up the market during times of uncertainty. You and I will note the market never got to over-sold technical extremes: there was only a bounce off the lower daily Bollinger Band. So, how else did this happen if it was not over-sold? Anyway, it is no concern of mine. My role is to try to count waves properly given the odds. For now, ES 4,100 is a price barrier to have to defeat lower.

It is likely cash closes should try to hold above the declining upper diagonal trend line if this count is correct. Price closed over the 18-day SMA (or the 'line in the sand'), greatly reducing the odds of a near term decline, but not the certainty. For that reason, I will be monitoring the expanding diagonal possibility, and will update that as something becomes more certain.

I will note that the Dow did make a completely acceptable expanding diagonal downward. I commented on that when it occurred. The S&P500 did not, however.

Have an excellent start to the evening.

TraderJoe

Tuesday, March 15, 2022

Outside Day Up

With yesterday's lowest close day for the down move (so far), today started out in the futures with a lower low day, then reversed to make an outside day up. As such, it probably makes the best day to signify a truncation of a contracting diagonal down wave - if one is going to occur. The ES daily chart is below.


Today's move took undercut the first down (red) fractal back which may serve as a 'trap fractal'. Meaning sellers incorrectly sell the morning breakout. Of course, it is clear that occurred right against the lower daily Bollinger Band (where to paraphrase Ira Epstein, "the Smart Money is likely lightening up on some of its positions".) Prices rose, but did not attain the 18-day SMA, aka "the line in the sand."

Notice the number of daily fractals that have formed. With tomorrow's FED meeting result, there are lots of possible outcomes including just lots of volatility that may be initially difficult to count. So, I am sure there are many who will be idle until they know the results and see the presser following. The up wave from the 5 AM morning low (question: who keeps making those 3 am and 5 am morning lows in the futures?) is a bit funky to count. Right now it may be an incomplete wave that we need to keep our eye on.

With today's low just ticks below the 08 March 2022 wave (in other words > 90% to qualify for a Flat wave) on an hourly chart, there are lots and lots of ways this wave could play out and still complete a full non-truncated diagonal lower. Flat waves and triangle waves can be included in this mix, but there is as of now nothing I see that is definitive.

On the intraday ES 30-min wave-counting screen we use, the market ended with the intraday bias up while the daily bias is down. That pretty much sums up the messy waves we are seeing right now. Comments are temporarily back on moderation. It may take me a few minutes/hours for approval with the FED meeting tomorrow.

Have an excellent start to the evening,

TraderJoe

Monday, March 14, 2022

Lower High, Lower Low, Lower Close Day on ES

The potential diagonal(s) we have been describing - this contracting one, shown below - and the Expanding one shown on the ES 8-Hr chart continue to remain valid wave possibilities.


While we must be on alert for the case where the fifth wave of a diagonal '(C)' wave truncates, so far there is no evidence of that. The MACD indicator has now made a lower low on the cash chart. This might be considered a 'warning' for the contracting diagonal. And it might warn that the expanding variety - shown in previous posts - has an opportunity to play out.

On the daily Bollinger Band chart, the slow stochastic is not yet in over-sold territory, and price has not yet again contracted the lower daily Bollinger Band.

Have an excellent start to the evening.

TraderJoe

Sunday, March 13, 2022

No One Else Even Mentions It

Sometimes I think Elliott Wave analysts are so keen on looking at the short-term price squiggles, they miss some overall context. This is particularly true where 'time' is concerned. I have not seen this relationship even mentioned elsewhere so I will bring it up. Below is a comparison of the 'time taken' in the 2020 Covid-19 decline versus the time taken in the recent decline as measured by the S&P500 cash index.


From the above charts, it should be clear that the 2020 decline took 23 days. It was quite the drop in price, but it was relatively quick. Now note that the current decline in 2022 (even if it ended at the lowest low) exceeds 40 bars, and it may have more to go.

From a degree labeling perspective this should mean that the two declines are at least of the same degree, or else, the 2022 decline is of a larger degree. Said differently, if the 2020 decline is an Intermediate (C) wave of Primary ((A)), then the 2022 decline should at least be of the Intermediate degree, so far.

So, you will note that in yesterday's chart (and previous ones we posted) we are showing the sub-waves as Minor degree, symbols 1 - 5, waves that would make up such an Intermediate degree wave. Thus, the Intermediate wave down will be either (A), (1) or (4). We'll say more about which later.

This is one way an Elliott analyst can verify the degrees of labels they are choosing for the wave structures they draw, and not just pick them at random or eyeball them on price alone. You will continue to see few analysts deal with the 'time element'. We hope you are getting more comfortable with it.

Have an excellent rest of the weekend. This is the second post this weekend, and if you have not already, you might like to read the first one, too.

TraderJoe

Friday, March 11, 2022

Next Week Tells the Story

Next week we will find out if this pattern completes properly or does not. We continue to follow both versions closely: a potential contracting diagonal in cash, and the same or a potential expanding diagonal in the ES 8-hr futures (see second chart at this LINK for the expanding variety diagonal).

SPX Cash - Daily Close - Potential Contracting Diagonal

So far, things remain on track - although intraday counting requires patience and flexibility. Today was choppy most of the day until prices let go and made some lower lows into the close. Some of the intraday counting is in the comments for the prior post.

Have an excellent start to the weekend.

TraderJoe

Wednesday, March 9, 2022

b wave appears to be a Flat

In previous posts, we were expecting to get a 'b' wave. Yesterday and today, we appear to have gotten one if the form of a Flat in cash, or a compound flat in futures.

SPX Cash - Daily Close - Potential Diagonal

While the up wave may not be finished yet, the 'b' wave keeps the diagonal count alive. In this count, waves 'b' and 5 would invalidate beyond the high of wave 4 (using OHLC bars).

Keep in mind that if wave 5 should form properly, it must be shorter than wave 3 using OHLC bars. If it gets longer then wave 3 then the expanding diagonal count from the ES 8-hr futures (shown yesterday) may better apply.

If the 'b' wave up is to finish, tomorrow would be the best day for that.

Have an excellent start to the evening.

TraderJoe

Monday, March 7, 2022

Lowest Cash Close

With reference to the chart posted yesterday - which may be another valid form of diagonal - today made the lowest cash close of the decline since January 2022.  Here is a repeat of the cash closing chart, updated for today's data.

SPX Cash - Daily Close - Contracting Diagonal

As you can see, today's close was lower than wave Minor 3. Today was quite the drop to the 4,200 level. Can we say this form of diagonal is completed? No, we can't because on an OHLC chart today's intraday low is not lower than the intraday low at wave 3. Today, we could count 'five-waves-down' as per the SPY 15-minute chart shown in the prior day's post. So, a retrace of some degree may be in order. Note that today's a wave is shorter than all of wave Minor 3, so degree labeling is adhered to.

It is also worth reminding you of the potential Expanding Diagonal count from the ES 8-hour futures, posted previously, as well.


In this count, trading below 4,061 is needed to validate wave Minor 5 of the diagonal. The minute ((c)) wave down of Minor 5 should be either an impulse or a diagonal, itself. Then, we need to monitor lengths overall. Sometimes, from the few examples of expanding diagonals we know of, the fifth wave of the expanding type of diagonal comes very to - but does not cross - the wave 1 to 3 trend line. In other examples, there is a bear throw-under of that trend line, and then prices quickly spring back inside the diagonal structure. If price follows one of these two later paths, it may become too long for the contracting variety of the diagonal (i.e. the first chart, above) to remain valid.

Clearly, we are open to either interpretation and are monitoring the situation carefully. Bear in mind price hit the daily lower Bollinger Band today (where the Smart Money may take some profits off the table - to paraphrase Ira), but the daily slow stochastic is not in over-sold territory. Interesting!

Have a good start to the evening.

TraderJoe


Sunday, March 6, 2022

Another Plausible Diagonal Structure

Blog reader Ronb posted an idea that has a lot of merit: it is that of a contracting diagonal instead of an expanding diagonal. I decided to look at his idea a little differently, using closing only values of the S&P500 cash index to try to show its value. The daily close-only chart of SPX is below.

SPX Cash - Daily Close - Contracting Diagonal

These are some of the merits of the idea: 1) the brief time spent in daily correction by the b waves is very interesting, 2) the count might explain some of the "impulse stopped here, no it didn't" nature of the upward c waves, 3) there are only about 42 days in the decline from the high. And while the EWO is on a low at wave 1, the MACD diverges on wave 3, so perhaps the EWO is providing a bit of a fake-out because the number of candles is not near 120 - 160, 4) the chart looks more like one Elliott would have been able to construct in his early days, meaning, 5) the clear overlap with wave 4 and wave 1 occurs on a closing basis. It does not do so for the expanding diagonal.

The implication of the chart is this: perhaps the decline might not be as significant as the expanding diagonal might suggest. What if on a closing basis we only nick below wave 3 ? Then, such a diagonal might still be valid even if the expanding variety does not work out.

The singular way to tell will be to measure the lengths of the entire waves (using OHLC, or candles) and see which length measurements turn out correct - if any do. We will advise as time progresses.

With thanks to reader Ronb for suggesting the idea.

Have an excellent rest of the weekend.

TraderJoe

Friday, March 4, 2022

Rejection at 18-day - 3

US equity prices as measured by the ES E-mini S&P futures did not engage with the 18-day SMA today. Prices headed lower from the outset, making a lower daily low, and this likely has the effect of turning the daily swing line indicator down. Price is below the 18-day SMA, so the daily bias continues lower. And the daily slow stochastic indicator is drifting in the middle of the range, neither over-bought nor over-sold.

ES Futures - Daily - Lower Low day

On a short term basis, we could only count three waves down today with perhaps a fourth in progress. It is best seen on the SPY cash chart at the 15-minute time frame.

SPY Cash - 15 Minute - Three Down

The clear three-wave appearance within an Elliott trend channel is obvious at this time, as is the possibility of a fourth wave. A prominent feature of the chart is that the cash gap did not even come close to closing. I'm showing the candle which originates the actual gap in this case.

The is some possibility of a triangle fourth wave. There is also some possibility of an upwardly overlapping wave to potentially make a diagonal in which a higher overlapping high could make a fourth wave.  This is because of extensive overlap of certain waves in the futures, too. The third wave down is is longer than the first wave down, yet it is just shy of a 1.618 measurement as shown by the Fibonacci ruler.

This is clearly a news driven market at the moment, and with much of the news unfortunately being war related, there is some probability that the government (PPT or PWG) is taking steps to stem the decline and give people time to think. If you are unfamiliar with the duly sanctioned actions of the Plunge Protection Team (PPT) or President's Working Group PWG, you might like to read the article at this LINK.

Have an excellent start to the weekend.

TraderJoe


Thursday, March 3, 2022

Rejection at 18-day - 2

US Equity prices as measured by the ES E-mini S&P futures were higher overnight, and temporarily exceeded the 18-day SMA. But, they couldn't hold on to the gains and closed lower, below the 'line-in-the-sand'. The daily chart is below.

ES Futures - Daily - Lower Close

The hourly up count, if it is a five-wave-move is best described in this diagram in the SPX cash.

SPX Cash - 1 Hr - Five Waves Up?

The black count is a completion count. Wave iv is at the 38% level. In the futures, wave iv is a triangle.

However, an alternate is possible, but looks less likely, and that is a (i), (ii), i, ii count shown in red. So, we must simply await larger fractal and trend line breaks to see how the rest of this wave occurs. Trading below the dashed up trend line, back-testing it, and failing the back-test would be a significant warning that wave minute ((c)) of Minor 5 is getting underway.

Have a good start to the evening,

TraderJoe

Tuesday, March 1, 2022

Rejection at 18-day

ES futures prices were higher overnight absorbing 'some' of the first-of-the-month money. But because this first trading day was split between a Monday & Tuesday (some business models call the end of the month the last Friday of the month), the impact was muted, and prices did not even make it back to the 18-day SMA. The situation in the Ukraine continued to deteriorate, and prices headed lower.

ES Futures - Daily - Turned Back at 18-SMA


With reference to the ES 8-hr count shown over the weekend at this LINK, last night's high appears to be the (c) wave of the minute ((b)) wave, up, of Minor 5. We are now trying to count a first wave downward, (i) of ((c)) of Minor wave 5. With last night's higher high, the swing line has not formally turned lower, yet, but it could if lower lows are made tomorrow.

Tonight is the President's first State of the Union address. The overnight prices should be monitored to see if there are any 'surprise' announcements, and, if so, what impact they have on the market. 

Regardless, I would put a 'wave-counting-stop' above today's high. Any price movement above it should be a warning that the count of a downward diagonal might not work out.

Have a good start to the evening.

TraderJoe