Saturday, December 30, 2023

Year-End Clean-Up

I was looking over both the down count and the up count, particularly with an eye to try to explain just where this recent accelerating wave came from. Also, I wanted specifically to see if I could find any counts that channeled particularly well, and/or had good Fibonacci relationships. In this regard, we also note the ES futures (continuous contract) are already over the prior 2022 high - while the SP500 cash is lagging a bit. I expect that might be resolved in the New Year. OK, so here is the first channel count: the down count from 2022 on an ES 2-day chart.

ES Futures - 2 Day - Down Count in 2022

The only satisfying count I can find that meets these criteria is a Leading Contracting Diagonal A wave, followed by an Impulse C wave where B is a complex Expanded Flat. In the count C < A in the channel (about 78.6%). This allows the downward wave to be counted as either Intermediate (A) down of a large Expanded Flat or Intermediate (2) down of a Primary Contracting Ending Diagonal, up. 

Now for the up count since the October low.

ES Futures - 3 Day - Channel Count Up

What struck me about this most recent up wave is where did it come from? It seems to have third wave acceleration characteristics, and one must remember that C waves are in third wave positions. So, do we overall have an Expanding Leading Diagonal A wave, now proven by an already higher impulse C wave? Again, both of these counts are in a channel, and the alternation in the corrective wave would work well.

Further, within the expanding diagonal A wave, wave minute-v (circle-v) is 1.618 x minute-iii (circle-iii), and if a non-limiting triangle is considered for minuet (b), then within minute-v (circle-v) minuet (c) = (a), another excellent Fibonacci relationship. And, from a degree perspective wave Minor B is the largest down wave on the chart.

So, now if there is a simple zigzag A,B,C up, then it is even more possible to have either an Intermediate (B) wave, up, or an Intermediate (3) wave up, over the high, in a Primary 5th wave contracting ending diagonal.

We must be clear. There is nothing to conclude yet, that the up wave is over. Tuesday is the start of a new month and a new quarter which may see the characteristic flows from the usual sources (pension funds, 401k's, company bonus plans, dividend reinvestment schemes, etc.). So, we will continue to count locally while we note these potential relationships.

Have an excellent end to a somewhat confusing, but, albeit better year.

TraderJoe

Wednesday, December 27, 2023

Wedge w Overlap

I'm not sure if this pattern will play out on the SPY 15-min chart, and it might take some time. But it is possible we have a wedge count with overlap, w-x-y to a ⓑ-3 wave, up, from an ⓐ-3 wave down. We know price went over the high, so the large down move likely does not count impulsively, even though portions of it look impulsive.


Note that the potential double zigzag does have the suggested overlap and x is larger than the prior (b). Such a pattern might be a fourth wave in the "A" wave, up. And it might be needed to generate some bearishness with the extreme sentiment readings we are seeing now. For this pattern to play out, look for a five-waves-down pattern, and a retrace that does not go over the y wave high.

Have an excellent rest of the day,

TraderJoe

Saturday, December 23, 2023

S&P500 Since 2009

There are some interesting features on this chart. Try to review the degree labels and see if they make sense to you. On the semi-log scale shown the degree labels can be defended, but it would be great to get your feedback on it.


Again, for this count to materialize, wave Intermediate (3) 'must' make a new all-time high, then an overlapping fourth wave, (4), would be looked for. This would be followed by a fifth wave up, (5).

The count would reflect the "too-far, too-fast" nature of the stock market's rise since 2009. A couple of the applicable Fibonacci ratios are shown. For example, wave  = 2.618 x , and wave  = 0.382 times wave  - when measured from the top of wave , itself, not the top of Intermediate (X). Keep in mind these are the Fibonacci ratios on the semi-log scale.

From a degree labeling perspective, waves IV and V are Cycle degree, waves ① - ⑤ are Primary degree and waves (1) - (5) are Intermediate degree.

Diagonal diagram added from Frost & Prechter, Figure 8.


Have a great rest of the holiday weekend.

TraderJoe

Thursday, December 21, 2023

SPY 5-min Exercise

This exercise was done today largely in real-time after noon (following a morning haircut). Readers can confirm this by reading the comments in the prior post. Please look over the count in detail. It is heavily annotated. This exercise was done to show the types of counting decisions that should be made by you in your real-time wave counting.

SPY Cash - 5 Min - Counting Exercise

Starting over on the left, there was this morning's gap up, then a decline that does not look like five-waves down, followed by waves up to 10:15 am that also do not look like five-waves-up. When I got back from the haircut, I was counting to see if we would get down to the 78.6% Fibonacci level. We did around 13:15, and I was able to count five-waves-down in that sequence including a contracting leading diagonal that started with a bearish engulfing candle. But, because of the only three-waves up to 10:15 I had my suspicions that those five waves would be the five waves that end the c-5 wave of a flat.

At about 13:15 there was an immediate bullish engulfing candle, and then a further diagonal which formed. At that point, I also sketched in the parallel trend lines. From the diagonal it was impossible to know if that would be a  wave, an  wave, or a  wave if my down count was in error. So, I suspended judgement until the high of the diagonal was exceeded. When it was, the odds tilted very much in favor that the overall count would become a simple (a), (b), (c) up - even if the internals were tortured and twisted.

During the afternoon the 100% level of the formative wave sequences was passed, and this count seems relatively verified. There are a couple of other things not labeled you should try to find. Can you find the three bearish red crows in the down wave? Can you find the three bullish green soldiers in the up wave? These were also key aspects of following a count.

So what is the purpose of this post? The main purpose is not what you might think. The main purpose is this: you will note at one point during the count I was required to suspend judgement until I knew whether the second diagonal a) would be leading or ending, and b) if leading would it be a , or would it be an . So, these are the two questions I have for you.

Do you know the basic Elliott Wave patterns well enough so that you could complete this exercise? If you don't, you are encouraged to review them over & over & over until they are second nature. But second, and perhaps more importantly - can you suspend judgement simply and easily in portions of the count where the pattern is unclear because of a potential diagonal or a triangle or some other factor, rather than needing to know the count at every single stage of a rise or fall? 

I did not know certain things in this count, but I still made a few pennies off of doing what was most likely with appropriate stops around the uncertain items, even on a day when the volume is 'holiday light' and some people advise not trading. Can you do the same? Can you suspend judgement where you need to, and just accept that as part of the wave-counting experience? If you can't, you might have trouble with being a wave counter. For it is the nature of Elliott wave that there are some uncertainties. Elliott Wave can not reduce all trading uncertainty, or wave counting uncertainty. A heavy dose of patience, calm and flexibility is needed in counting waves. That's all there is to it.

Here is just one other observation to note. Look at how the bull (green) volume increased at the end of the trading day. So, here is the item to ask, "just why weren't those green people buying at the (b) wave low, after the bullish engulfing candle, rather than waiting until the end of the day and price had dragged them all upward?"

That is the key Elliott Wave question. Everyone (that is - the masses) gets bullish at the highs, and bearish at the lows. Try to use EW to try to help yourself from being in that position.

Have an excellent start to the evening.

TraderJoe


Wednesday, December 20, 2023

Survival by 2 pts ?

It's not for sure yet, but the A wave may have survived the current count by 2 pts in the ES futures. Here is the chart.

ES Futures - 8 Hr - A Wave Possible


The overnight high was 4824.25, and the max is 4826.25 based on this chart. It looks like there would be a gap down at the open, but that needs to be monitored. If the count busts, we'll switch to the alternate red count shown in the prior post. As always with a trending move, confirmation of a change in count should be sought. In this case, at minimum five-waves down and a retrace that does not go over the high would be only a first step.

Have an excellent start to the day.

TraderJoe

Sunday, December 17, 2023

The Double-Zigzag, Overlap, Degree & Market Status

I have written about this topic before, but the current market environment provides the ideal opportunity to revisit and elaborate. When people don't use fixed rules for determining wave counts it is literally possible to develop "any" wave count and to have unrealistic questions about the current market environment. There are definitely fixed rules that I use to suggest a count is a double zigzag (versus a single zigzag or an impulse). Let's look at a diagram of an idealized double zigzag. We'll look at the market example second.

Double-Zigzag Idealized

These are the Fibonacci Five important fixed rules in use.

  1. The first zigzag is a 5-3-5 sequence. Here is it hard to tell if the market will impulse or not. So, the Principle of Equivalence applies in the first zigzag as a,b,c is i,ii,iii until it is not.
  2. The first zigzag is labeled a-b-c, and if there is to be a second zigzag, the first zigzag makes up the W wave.
  3. Clearly the W wave is 'larger degree' than the a-b-c because "as a whole" it is larger in price and time than any of the single contained waves (i.e. larger than the a, the b, or the c alone). The lower-case letters are smaller degree. The upper-case letters are larger degree.
  4. In a double zigzag, the X wave 'must' have overlap with the 'a' wave of the first zigzag. It is this overlap that prevents the further counting of the first wave as an impulse structure - because if it were a fourth wave - then, by rule, it may not overlap with wave 'i' up of the prior structure. This overlap is what negates the Principle of Equivalence and says the a,b,c is just that.
  5. The X wave then 'must' or is very, very likely to be larger in either price or time than the 'b' wave as it is 'also' of larger degree. Therefore, a double zigzag 'must' be labeled as W-X-Y and not as a-b-c-x-a-b-c and that is because the lower-case 'x' implies that 'x' is of the 'same degree' as a-b-c and that is almost certainly not true.
So, how does this apply in the current market environment? Let's have a look at the two-day ES futures and see each of these rules in play.

ES Futures - 2 Day - Double Zigzag Forming? 


Application of the Rules to the Current Market

  1. Starting from the lower left there is an expanding diagonal five-wave Minor A wave, up. This is followed by a 30 bar Minor B wave down, and a longer impulse C wave higher which did not make a 1.618 extension. Up until this point The Principle of Equivalence applied, and as I had showed earlier the wave could be labeled as 1,2,3 - as they eventually were in the NDX.
  2. The Minor A,B,C, make up the Intermediate (W) wave. The Intermediate symbol ( ) is of larger degree than the Minor (capital letter) symbol. 
  3. (W) is a larger degree wave, and the (W) wave is larger as a whole than any of its components.
  4. The (X) wave then ensues. Critically, it overlaps the prior A wave and negates the Principle of Equivalence, forcing only the A,B,C count and not the 1,2,3 count.  The (X) wave is 32 bars in length. It is larger in time than the lower degree B wave, and therefore (X) is larger degree than B, the prior wave in the same direction. The Fibonacci ruler also shows that (X) is larger in price traveled than B, as well.
  5. If the structure plays out it will be labeled as the double zigzag (W)-(X)-(Y). Currently, price is likely in the next Minor A wave, up, of the series.
The Fibonacci Five rules were applied above. What does this imply for the current wave upward since the recent October low?

In yesterday's post, the wave structure suggests that the current price in SP500 (SPX) should not exceed 4,771 to maintain the five waves up with the extended first wave. But what if it does? What if this up wave becomes longer in price than that?

First, we note there are no overlaps in the current structure. So zigzag labeling likely does not yet apply. Then, using the 0 - 2 trend line guideline, this would be the next most-likely structure.


Again, the above chart alternate is currently for example purposes only. But first note there simply are no overlaps to suggest the market is not strong and is not impulsive. The 0  - 2 guideline would then suggest that the largest trough to the right is the larger degree wave (ii), assuming the 1 symbol in this case is for the lower degree micro degree, say. And the current wave up is wave (iii) which would make sense only if the price limit for the main count is exceeded. Exceeding that limit would also suggest extraordinary strength as in a (iii) wave.

(P.S. Why was this structure suggested as the alternate at this time? It is because wave 5 measures exceptionally small compared to 1 or 3. The wave principle is about measurement, form and balance which suggest the main count over this alternate. This alternate is possible but just less likely at this time).

This explains the situation as clearly and precisely as I can with regard to double-zigzags. Regular readers of this blog will also clearly note how it is the overlapping nature of the (X) waves in double and triple zigzags that also results in the contracting and expanding diagonals. These waves are not impulsive. They are motive, and can move price in a direction, but they are not impulsive. It's just that those overlapping (X) waves can be labeled as (2) & (4) within the diagonals, only!

I hope this helps address the topic. You will likely not find such a full explanation elsewhere. I know that these "no-pullback" waves tend to suggest zigzags. But not always. Sometimes they represent extended first wave sequences, and the analyst must be alert to it.

This is the second post this weekend, and if you have not read the first one, you are invited to read it now. 

Have an excellent rest of the weekend,
TraderJoe

Saturday, December 16, 2023

Measurement - Note

The chart below is of the SP500 (cash), SPX, 2-Hr time frame. We note that in the current count under consideration, the SPX cannot make a new all-time high with only the sub-waves, below. Meanwhile the DJIA has already made the new all-time-high.

S&P500 Cash Index - 2 Hr - Likely Count


This count would max out at 4,770.99 but the prior all-time-high was 4,818.62 so it remains a bit of the way off. The primary reason for bringing this up is the following.

If the S&P500 is to make an ending contracting diagonal, then it would likely have to have a retrace and then another leg up, counted as (W)-(X)-(Y) to the third wave of the diagonal. As noted previously this double zigzag would still be acceptable in a diagonal, but it does run slightly afoul of a guideline. But if there is no retrace & further extension or higher all-time-high, a diagonal third wave could not be considered for this index. And that would leave only a "B" wave count of some type for the indexes. Meanwhile, the Dow has made the new all-time-high already and can be considered already for either the diagonal count or the "B" wave style count.

It is way too early to say which will occur. But seasonality and a year-end rally, along with new money from the "first of the month - of January - effect" after a dip could provide the needed new all-time-high in the SP500. 

Yet while these are "likely" based on history, they do not have to happen. On some measures, sentiment is quite extreme in the short run. If - for some reason - they don't, then either the diagonal will not occur, or the count above would have to be modified.

Right now, things are on track. Let's see how they go.

TraderJoe

Wednesday, December 13, 2023

Measurement

Here is the calculation on the up wave for whether  remains less than . Always use OHLC bars or candles. Always do the calculation in futures, as they use have greater traveling ranges than cash.


Have a good start to the evening,

TraderJoe

Tuesday, December 12, 2023

Up Wave Structure

The ES 2-hr futures (RTH only) shows the structure of the up wave well with about 122 candles on the chart, as below, and using The Eight-Fold-Path Methodology for an Impulse wave.


The first wave up may be the extended wave, x, and has the highest Elliott Wave Oscillator value. The 0 -  trend line identifies the end of wave  ala Neely. And the return of the EWO to the zero line - or near it - identifies wave ④. And the current wave - likely wave  - is diverging on the EWO.

In this count, wave  should not exceed the length of wave . To the downside not much happens until the lower trend line 0 - is exceeded lower, back tests, and/or fails.

Have an excellent start to the evening,
TraderJoe


Sunday, December 10, 2023

IF the Dow goes over the high in 2023 or early 2024

If the Dow goes over its high in the remainder of 2023 or early 2024, then we need to be completely open minded to the contracting diagonal possibility I have noted several times in the past. As a reminder, it now looks like this on the Monthly Chart of the Dow.


Because sentiment is getting quite bullish, price could retrace down closer to the (B) wave within a few days. But then, a holiday rally might take the Dow over the all-time-high again. For the short term, wave (C) of  should not trade under the (B) wave to remain valid. This is clearly marked on the chart.

Then, IF and only IF a new all-time-high is made one can suggest it might be the larger diagonal that is forming. It may take a while, but the MACD is currently above the zero line on this time frame. So, keep it in mind for now until we know more.

After (and only after) a new all-time-high could there be a fourth wave down, ④ which should overlap in a diagonal wave and might re-test or throw-slightly-under the lower uptrend line. Let's see how this plays out and IF it plays out.

Have an excellent rest of the weekend,

TraderJoe


Friday, December 8, 2023

Mean Green Machines

I'm a bit envious of the Smart Money that has the machines. What a tool. See below for a little more explanation. The ES futures made overnight lows on the US Payroll Employment Report. That's the large down bar on the left of the chart, below. Little of that was seen by the cash open. Further, the Consumer Confidence Inflation Expectations came out more benign at 10 AM, and the ES put on another leg higher. Here is the ES 10-min chart.


Beginning about 10:10 am there was a three-wave-sequence downward, until about noon, and roughly then, you could tell "someone turned on the machines", much like you can tell when the casino 'turns off the slot machine' and you get no winners until your stake runs out. Look at that long and choppy pattern to a new high. It looks like and can be counted like it is 'five-waves-up'. Yet it in no way has the same impulsive character of the preceding up waves. Still, it grinds and grinds to a new higher high with not even a 38% percent pull-back along the way. "Hello Machines" - to keep prices higher into the Friday daily, and weekly close. It's similar technology. They monitor your account. They control the algorithms. You are being traded against. They are the house. You (and I) are not.

From a wave-counting perspective, that wave came out two-points-shy of validating an expanding diagonal wave. Then the cash market closed. An expanding diagonal could still occur, but not below the low of what is marked wave ④ - and the local wave-counting-stop.

From a non-wave perspective, it feels like something is going to happen soon. The reaction of the equity markets to everything is bullish. The Payroll Employment Report doesn't matter, but, oh, it's the Consumer Expectations report that really matters. Yeah, right (uh, no).

So, stay tuned. A number of things are falling into place. It will be interesting when they do.

Have an excellent start to the evening and the weekend,

TraderJoe

Thursday, December 7, 2023

Gappy & Trappy

A gappy and trappy triangle can still be valid in the SPY 30-min cash index. We have been following such for several days. The US Payroll Employment report is tomorrow.


The report might have a lot to say about the triangle. If the reaction is really bad, Friday could be an entire down day provided the triangle does not travel below the low of wave (c). If the reaction is initially bad but turns around higher the (e) wave might just be another spike lower.

Today the (d) wave got over the prior x wave of (c) but - from these quotes - the prior gap near the high was not yet closed.

What is making these triangles so treacherous is that the proportions are a little stilted. The retraces are both a bit greater than 78%, so it makes it a bit more difficult to know where the legs will stop. But these are likely machine made triangles - where the machines are exercising the control, and that is probably needed to keep them profitable and traders less so.

Regardless, the pattern is full of holes - like Swiss cheese - and often the gaps from triangles fill. It may take a few days but 'often' (not always) they fill.

Oh, and a word of caution, it looks like some data services are doing their 'futures contract roll over" tonight as this is written. That will throw a wrench into the mix.

Have an excellent start to the evening,

TraderJoe


Wednesday, December 6, 2023

ES Daily - Outside Day Down

In somewhat tricky action the daily ES futures contract made an outside day down. And in doing so the daily slow stochastic lost its embedded status - all as of the cash close.


As we indicated in the comments for the prior post earlier, the DJIA (YM) futures made a new higher high today. We were expecting such and we also called a >78.6% upward wave in the ES today and began counting a downward wave. We said such a wave could be part of a potential smaller triangle. That smaller potential triangle invalidated. There could still be other downward structures - including a larger triangle - that would eventually result in a further new high, but the loss of the embedded reading is problematic, and the market will have to prove it.

In the ES, there is potentially a lower high and a lower low, and if price closes below the 18-day SMA it might trigger some more significant selling - perhaps to the lower daily Bollinger Band. 

So, we remain flexible, calm and patient. We did our best to count upward today; the market wasn't having it. Maybe it will eventually, but for now this remains to be demonstrated. 

So far, the Dow (YM), the SPY and the NQ are over their July highs. The ES, the SPX and the RTY are not. It's a fractured situation, but it is what it is. And one wonders of it could be resolved eventually. For the moment, we just count what we see.

Have an excellent start to the evening,

TraderJoe

Tuesday, December 5, 2023

So Slow ...

The cash chart of the SPY 15-min ETF is below. Today's price movements were slow, controlled and largely contracting.


Some tentative trend lines were roughed in. The major question to be asked from the coiling action is, "are we consolidating just the drop of 4 Dec - as in a fourth wave which is not upwardly overlapping yet- or are we consolidating the larger prior rise with a triangle?"

Some news in the next few mornings is likely needed to provide some cover for the breaking of the stalemate. Clearly, the situation demands patience, calm and flexibility. The odds are roughly equal, but the downside might come more into focus if the ES loses its embedded status on the daily chart. As of the cash close that hadn't happened yet.

Have an excellent start to the evening.

TraderJoe

Saturday, December 2, 2023

Extended Fifth Wave?

Is the Dow Jones Industrial Average making an extended fifth wave as per the Dow (YM) futures 4-hr chart, below?

DJIA (YM) Futures - 4 Hr - Extended Fifth?

Here is what Glen Neely writes in his book, Mastering Elliott Wave, about this prospect.

Page 5-12 (Formation of ..) Fifth Wave Extension

It is during a fifth wave extension that wave-3 will normally be related to wave-1 by 161.8%. The 5th wave most commonly will relate to the entire move from the beginning of wave-1 to the end of wave-3 by 161.8% added to the end of wave-3 or wave-4.

Page 6-2 (Correction Following...) Fifth Wave Extension

The correction following a 5th extension pattern must retrace at least 61.8% of the 5th wave but must not retrace all of the 5th wave IF the trend is to remain in effect. If the 5th wave does get completely retraced, it indicates the extension terminated a larger trend. Here are the different ways that can happen: 

  1. The 5th extension pattern was part of a larger impulse which was also part of a fifth wave extension; or,
  2. The 5th extension pattern was the c-wave of a Flat or Zigzag pattern.
With regard to the first page reference (p 5-12), this measure indicates the construction may have a short way to go yet.

With regard to the second reference (p 6-2), it would be interesting to see if this pattern ends both the zigzag pattern at the Minor degree and the Flat pattern at the Intermediate degree. This, again, only applies if the entire wave is retraced. Otherwise look for a minimum of a 61.8% retracement (in Neely's view).

Have an excellent start to the weekend.
TJ

Thursday, November 30, 2023

DOW Futures Reach 90% - Weekly

Now we know why we had a recent countable diagonal downward from July to October 2023 on the weekly chart of the Dow futures, below. It was the minute-c, ⓒ-5, wave of the end of a Minor B wave. There is no escaping the 90% measurement and the fact that today the Dow made higher daily and weekly highs while the other indexes did not.


This chart might also clarify that the wave down on the left could have been a diagonal Minor A, down, triangle Minor B, sideways, and impulse Minor C downward to make wave Intermediate (A) per our labels of (A)/(1) to adhere to the Principle of Equivalence. In this case, it winds up being a perfect Fibonacci  C = A relationship between the two waves.

Since October of last year, we have had Minor A impulse, up, sideways truncated Flat for Minor B, and now a Minor C wave, up. The alternate labels shown at the bottom (roughly equally likely at this point) are Primary  at the 2022 high, Primary  down at the October 2022 low, and Primary , up, to make three legs of a five-leg contracting ending diagonal IF and only IF Primary  goes over the all time high. It isn't there yet.

We also now know that the wave to the ⓑ-3 high was not a true diagonal as it's low was not broken in less time than the diagonal took to form. Meanwhile, the wave down to ⓒ-5 was a true diagonal downward (an ending diagonal) because it's high was broken upward in less time than this diagonal took to form.

One of the reasons I post this update with dispatch is to show just how incorrect one can be when they break the rules.

At the moment, all we know is what we know. Could this be an Intermediate wave (B), up? It certainly could be - even if it goes over the high. But, the odds are just about even, or maybe even a little better, that an ending diagonal wave forms to end the Dow's Cycle Vth wave.

All-in-all whippy difficult to trade action.

Have an excellent start to the evening,

TraderJoe


Wednesday, November 29, 2023

Higher High after X-Over

Ira Epstein (broker with the Linn & Assoc.) offers the advice that when major moving averages cross over then a higher high, or a lower low can occur and that's all the market owe's it. A couple of days ago, the 18-day SMA crossed over the 100-day SMA in a Golden Cross, and today the higher high resulted. See the ES daily chart, below.

ES Futures - Daily - Doji Candle

Note that today would be a Fibonacci 21+1 days since the up trend began. And the wave is more turning to the right than it seems to be impulsing. A channel formed from the low has broken lower, not higher.

So, today's candle needs to be watched to see if the initial confirmation steps of a lower high and lower low are made, and whether or not the daily slow stochastic loses its embedded status or not. The current wave count is given in the comments for the prior post.

Have an excellent start to the evening,

TraderJoe

Tuesday, November 28, 2023

Four of the Seven

Four of the Magnificent Seven stocks have their new daily highs. They are AMZN, META, MSFT, and NVDA, as below.


The three that do not are AAPL, GOOG and TSLA. It's not to say they can't, it's just to keep abreast of the situation with them.

Have an excellent start to the evening,

TraderJoe

Sunday, November 26, 2023

One More Time .. A Little Different

Here is another take on EWI's view. It is short, simple and deals more with the wave count. (No credence is given to any ad YouTube may show with the video, particularly one for any financial product. They are not inserted by me.)


Some, but not many, ideas are given if the high doesn't hold, as per the prior post.

Have an excellent rest of the holiday.

TraderJoe

Thursday, November 23, 2023

The Fourth Wave Conundrum

I have written often that The Fourth Wave Conundrum - which occurs at every degree of trend - is what helps make the Elliott Wave quite a bit less predictable than one would like. The problem, again, is that when a fourth wave is expected, and the market starts down with only a three-wave sequence, then the number of possible patterns explodes to thirteen! So, one has only a one-in-thirteen possibility of being correct by random chance. This amounts to odds of 8 : 92 of being correct. Not good. 

To further illustrate this point, we are going to look at the longer-term market prospects IF, and only IF, the SP500 makes a higher monthly high like the NDX has. We don't care if it does. We are agnostic from a wave counting viewpoint. We have no vested emotional interest in the matter as we are too well aware of this conundrum that we have explained numerous times in the history of this blog. So let's start with some scenarios. The first one is this.

Flat Wave for SuperCycle [IV]


That scenario derives from the "Thrust from a Triangle Interpretation" of wave Cycle V. That means that the downward wave sequence into 2022 was only a three-wave sequence (the 'devil' that creates all the issues). And we could eventually bust the local high and travel to 90% to 150% to make a Primary Ⓑ wave up, before making a Primary Ⓒ wave down. This is a completely realistic scenario, and one must be open to it. Perhaps the 5,000 level will be touched, first.

This scenario has going for it that that 2020 rise "looks like" a thrust from an expanding triangle. It is a massive explosion and can be interpreted that way. Keep in mind on the way down recently the ES futures did overlap downwards. So, we might only have A-B-C up to (W) in the recent count, with an (X) wave down - unlike in the NDX that has no overlaps. The next scenario is this one.

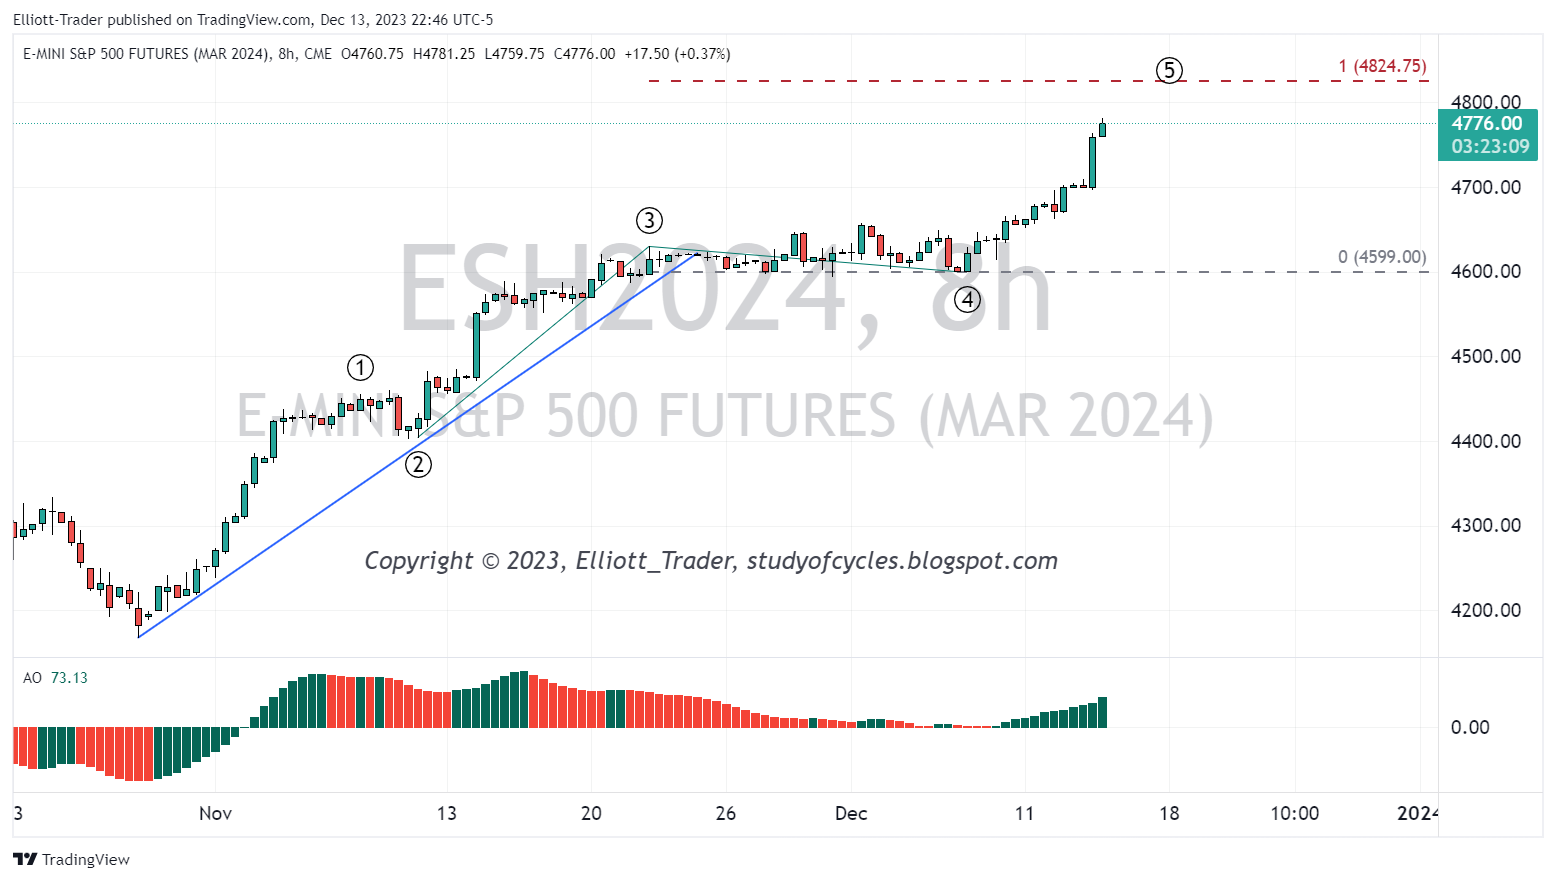
The Contracting Diagonal Scenario


The scenario results from the Flat IV Interpretation of the Covid-19 decline instead of the triangle. The issues with this scenario are that wave Cycle V looks out-of-proportion to Cycle IV in terms of time. But, such a condition might be due to the money-printing and fiscal stimulus we all know of. Another issue is that wave Primary ③ must go over the top again for this count. That hasn't happened yet. Regarding the double-zigzag for wave ③ instead of a single zigzag Prechter has written (and I have seen it once in the EuroFX) that sometimes the third wave forms as a double-zigzag in an effort to try to become the longest wave. The "zigzag substitution rule" in The Elliott Wave Principle by Frost & Prechter allows triple and double zigzags to substitute for a single zigzag. Again, the SP500 5,000 level could be touched or exceeded.

Such a pattern would be a fitting end to a Cycle Degree wave, and it is a way to hobble over to the next Presidential Inauguration. So, one should keep it in the back of one's mind. The third pattern being presented is this one.

The Barrier Triangle Scenario


This scenario recognizes the extreme rise to the 2021-2022 top as a third primary wave. Since then, we may be in a triangle. The wave down would be Intermediate (A) and was the most violent leg of the triangle. The other waves of the triangle would still be in construction in what might turn into a horrible range-bound grind until there is a pop out of the triangle. Again, the S&P500 level of 5,000 could be met or exceeded.

Of these scenarios, the first is favored slightly. But any of them could happen - as could some others. So, one really, really needs to be flexible and open-minded. As Prechter presented in the interview shown previously, long-term sentiment is excessive. So, could this index crumble from here and use the three-waves down from the high as the first wave of a diagonal? It could, but the odds are low. And one must wait until the high is exceeded or not to draw any conclusions.

But IF the high is exceeded, one shouldn't be scratching one's head too long. These very same wave scenarios play out in very, very many fourth waves at all degrees of trend. And, going over the high again - if that's what happens is not a sign of failure or anything else - it is what it is: maybe just a sign of money-printing. So remain flexible, calm and patient.

Have an excellent start to the holiday.

TraderJoe

Monday, November 20, 2023

Now We Know Why - NDX

Did you ever wonder why the NDX (NASDAQ 100) index did not make a new low in March 2020 like many of the other major indexes did? Well, I think now we know. We must tip our hats to the very sombrero looking wave-count below which can be (5) waves up, even if a new high is not made. The chart is the 2-Weekly chart of the cash NDX.

NDX - Cash - 2 Weekly - Five Up

The wave count is awful, but with today's 'five up' in this index the conclusion seems inescapable that there is a five-wave sequence upward - even though some of the segments look like three-wave sequences - and even count better in other indexes as three-wave sequences.

But we must count what we see, and wave (4) is at the 50% retrace level without overlap on wave (1). Further, the recent five-wave sequence up is well over the 78% retracement level of the prior high-to-low which is certainly within the allowable truncation zone. So, even IF price doesn't go up over the wave (3) high - which it certainly may - it would count as an Intermediate (5), up.

The key item to note is the character of this index is significantly different than the other more industrial indexes. The stocks are different, so I would not attempt to count the other indexes the same until there is a good reason. 

Have an excellent start to the evening,

TraderJoe

Sunday, November 19, 2023

EWI Solid

I'm doing Elliott Wave International a solid this morning and advertising their work only because they taught me much of what I know about Elliott Wave. No claims are made for the accuracy of any forecasts. This is for educational purposes only. And it is quite recent.


Since it seemed to be free on YouTube, I thought I would pass it along.

Have an excellent rest of the weekend.

TraderJoe

Friday, November 17, 2023

Triangle vs Diagonal

Triangles move price sideways and take up time. Triangles 'often' precede the last wave in the direction that price entered the triangle. Diagonals slant either with or against the trend. Like triangles, diagonals cannot be called until all five waves are securely made in price.


There is currently a valid "running triangle" in the SPY 30-min chart, above. That is because the Ⓔ wave has crossed over the prior high on 14 Nov to be corrective to it. Sometimes - when a triangle 'fails' - the same three-wave sequences that make a triangle can also be used to build 3-3-3-3-3 diagonals.

There is currently not a valid diagonal, but if the Ⓒ wave breaks lower before a new higher high than the Ⓑ wave, then one might look for the expanded diagonal down for a larger expanded flat, lower. In that case, the wave sequence shown as (w),(x),(y),(x),(z) = (i) - (v) of the diagonal.

Have a good rest of the morning.

TraderJoe

Tuesday, November 14, 2023

Current Up Count

The ES 4-hr chart (close-only) is below. This is just so the form of the wave can be studied. At present, the lack of a retrace beyond 38% suggests the wave is a zigzag being counted as a,b,c.


The count remains in place until/unless there is evidence of a fourth and fifth wave higher. On the daily chart, the slow stochastic remains embedded, and price has touched the upper daily Bollinger Band. A reminder than the PPI report is tomorrow.

Have an excellent start to the evening.

TraderJoe

Sunday, November 12, 2023

Another Pop from Rates?

In a previous post, (13 August 2023 at this LINK) we noted that according to The Eight-Fold-Path Method on the weekly chart, the US 10-Yr Yield had likely made its minor wave 4, now at the lower left, and started its wave Minor 5, up. We said, it would be a question of when the fifth wave ends. Now, with 135 candles on the daily chart, the Elliott Wave Oscillator has again gone below the zero-line indicating a fourth wave at the one lower degree, minute-iv (or circle-iv). Here is the daily chart.


Some points to note follow.

  1. Wave minute-iii (circle-iii) is 1.618 x wave minute-i (circle-i) and is the extended wave.
  2. Wave minute-iv (circle-iv) is a little greater than a 38.2% retrace at prior wave iv.
  3. All we know is that minute-iv has 'sufficient length in price'.
  4. That means only that minute-iv could take much more time if it wants (flat, triangle?)
  5. Minute-v (circle-v) could easily become the length of minute-i (circle-i).
This would suggest that rates would top out around 5.25 - 5.50% (or more). And Minor wave 5 should end on a weekly divergence, as minute-v (circle-v) should end on a daily divergence.

Only time will tell, but that is what the method suggests at this point. The Eight-Fold-Path-Method is the featured post of this site and appears at the upper right of the main blog page. This is the second post this weekend and if you have not read the first one, you may wish to read it now.

Have an excellent rest of the weekend,
TraderJoe

Saturday, November 11, 2023

To b or not to Be ?

As you know, my position has been that if we are making a zigzag upward, then the b wave overall might be 38% of the a wave. Does that have to happen? No. Nothing has to happen in financial markets, but it is a typical (..and in this case one of the least typical) expectation of a b wave. In the ES 4-hr chart, below, you can see where the 38.2% level is located using the Fibonacci ruler on the left side of the image.


If the a wave ended in the diagonal this Thursday on the fourth RSI divergence, then the true diagonal was retraced in 'less time' than the diagonal took to form. But we could only count Thursday's wave down as a three-wave sequence and it was well-short of even the 23% retrace. And, so far, Friday's wave up is 150% of the length of  wave down. This is well inside  wave parameters.

We know that after the close, Moody's downgraded the outlook for the U.S.A. to negative (see story at this LINK) and price only started to fall off. But a "spinning top" candle was made. We also know that a new debt deal must be passed by Friday 17th November. Could these be responsible for the  wave down?

A measurement for a potential supporting argument is that if the b wave turns out to be an expanded flat, then the Fibonacci ruler on the right shows 2.618 x  subtracted from  is just longer than 38.2% of the a wave - and this measurement confluence seems fairly compelling. This is not proof - just an argument in favor. A second argument is that the AAII survey of mom & pop investors just took one of the largest weekly jumps I have ever seen. The percent bullishness in this group jumped to 42.6% from 24.3% last week. Staggering.

Well, we'll have to see. As always, I just urge patience, calm and flexibility until various confirmations are obtained. For example, the "spinning top" candle needs a large lower closing candle. And one should draw a revised up-trend line from the low through the  wave low. Then, this trend line should be breached lower, be back tested, and proven to fail lower for improved confidence a down move is starting. Let's see how it goes.

Have an excellent rest of the weekend.

TraderJoe

Thursday, November 9, 2023

Outside-Day Down

As an outside day down, today's high should not be taken out within two trading days or it might become a trap for the bears. Today may have finished the a wave, up. Here is the ES 4-Hr chart.

ES Futures - 4 Hr - Possibly into b wave down

As noted before I'd like to see between a 38% and 87% wave down. In the event the support areas do not hold and the low is exceeded first, the alternate has to be that the up wave is a more-difficult-to-count zigzag to be all of the fourth wave (iv), up, of the downward expanding diagonal. The primary count tries to recognize that this fourth wave can take much more time in an expanding diagonal than the second wave.

Note above that the wave ④ low has been exceeded lower in the first step of the confirmation process. The next two steps would be a lower high, followed by a low below today's low.

Have an excellent start to the evening.

TraderJoe

Tuesday, November 7, 2023

Nothing Says We're Done, but Maybe

From a counting perspective, the a wave up might be close to finishing up. But there is a way it could extend a tad. The SPY cash 15-min chart is below. There might be a contracting diagonal in progress.


The alternative is that perhaps a (b) wave of the larger b wave is in progress. The issue right now is that only increased downward length will begin to let us know. I, for one, would like to confirm that the a wave up is completed. It would be great to see a b wave that is between 32 - 87% of the a wave upward.

Have an excellent start to the evening,

TraderJoe

Saturday, November 4, 2023

Back to Weekly Channel

US equity prices, as measured by the ES futures contract, retraced back to the lower channel line of the weekly up channel shown previously, and again in the chart below. Remember when we showed how prices were sticking to the channel before they initially collapsed lower? Well, after the gap up on Sunday night, prices rose every day this week and settled back under the underside of the channel.


As shown, prices bounced at the prior support and when the daily chart had two daily closes in-a-row below the lower daily Bollinger Band reducing the odds of the next close being outside of the band to roughly 3 - 5%, small odds. In the course of the week, as readers noted, the nested count invalidated as this wave up is too large to be a smaller degree second wave. It's good to see our blog followers are really beginning to get a handle on degree labeling. It makes writing about it worthwhile.

So, to get to the current wave count, the best valid downward count is this expanding diagonal which would be of the 3-3-3-3-3 variety as shown on the daily chart.


The price rise was very sharp, and on the daily chart the wave looks unsubdivided. So, the suspicion is that the rise is the a wave of this leg of minute-iv (circle-iv). And this wave seems to have ended - so far- at the prior support/resistance noted by the minute-i wave, the prior b wave, and the underside of the weekly channel. If so, that means a b wave lower could occur this week.

And it would be possible for such a b wave to be any of these structures: a) zigzag, b) flat, c) triangle, d) multiple zigzags, e) combination. I cover those again to indicate how much whippy trading might occur in the upcoming week. The only thing the b wave cannot do is travel below minute-iii (circle-iii).

Given the above, can prices move higher? Yes, in two ways: if the a wave is not fully complete yet or if the b wave forms as a Flat wave.

Given the above, can prices break the minute-iii (circle-iii) low? Yes, but not as the b wave. If the current low is broken it would just mean that this week's up wave is all of minute-iv (circle-iv), and the new daily low would be part of minute-v (circle-v).

In terms of minute-iv, the one thing it is not allowed to do is cross the high of minute-ii (circle-ii). This should be checked on an OHLC chart.

Because expanding diagonals tend to expand in time as well as in price, we are giving this wave much more time to develop. It could be a slog.

Have an excellent rest of the weekend.

TraderJoe


Thursday, November 2, 2023

Two Measurements

Here's a two-block of the ES 2-Hr futures showing two ways to measure the current up move. One contains a cut-off by the channel, the other does not.


There is not a good way to decide unless/until the market decides to add more bars and we see how much higher it goes. At the time of this writing, there is not a good solid turning bar (hammer, doji, engulfing candle, etc.) to assist with a decision. We wait and watch carefully.

After the above post, this plausible count was developed looking at the weekly line chart. This count is good to 4,340 and it represents all one wave, the (a) wave of wave minute-iv, circle-iv of a larger diagonal.

ES Futures - Hourly - All One Wave?

The count starts with a leading contracting diagonal wave.

Have a good start to the day.

TraderJoe

Sunday, October 29, 2023

Why the Nested Count Still Works

The daily chart of the NQ lead contract is below. When we attempt to use The Eight-Fold-Path Method on the daily chart, we find there are only 71 candles (as shown) which is insufficient to be in the range of the 120 - 160 candles needed. But we note that the EWO is on its lowest point, as shown.

NQ Lead Contract Futures - Daily - Nested Count

Because there is no divergence yet, this suggests additional price movement lower is possible. To get 142 candles, you can try the trick of using a 12-hour chart, but the EWO in that case remains on the lows. (Try it!) So, there is no difference in interpretation at this point.

In yesterday's post, we suggested that there is yet to be seen a "kick-off" or a "climatic" pulse lower. IF that were to occur, it would break the "base channel" of one's & two's lower and be a first confirming sign of a third wave. This base channel is also shown above. It is Elliott's preliminary channeling technique.

Next, we note that if this symbol, ⓘ, is for minute-i, down, circle-i, then the first sub-wave of minute-iii, circle-iii, is minuet wave (i). And we note that minuet (i) is shorter in price and time than ⓘ. Further, minuet (ii) is shorter in price and time than minute-ii, circle-ii. So degree labeling definitions are currently being followed. The same is the case in the ES futures. And it is possible for minute-iii, circle-iii to extend by smaller degree extensions.

Please remember when viewing these charts, that in the rollover contract, there is a higher high as shown at the (y) wave high on the above chart. And that is the same in the ES futures. And it turns out that this difference between the lead month contract and the rollover contract matters not for the nested count. The degree definitions still hold. Note in the ES I think the (i) ended just before the expanded flat wave (ii) - which a lot of sites are calling a fourth wave.

For the moment, we know the other count that works is the expanding diagonal. But again, we don't know that downward movement in this wave is over. So why, overall, are we counting as minute-i, ⓘ, down to Minor 1? Let's have a look at the weekly chart, below.

ES Futures - Weekly - Degree Labels Lower

As the chart shows, as long as downward price remains shorter in price and time than the prior larger degree wave in the downward direction, which is Intermediate (A)/(1) based on previous criteria, then the new down wave may be counted as the one lower degree or Minor 1. And its visible sub-waves are the minute degree components. 

Let's see how the week progresses and whether further impulse is experienced - which is certainly possible - or whether a diagonal retraces.

This is the second post this weekend, and if you haven't read the first one yet, you may wish to read it now. Have an excellent rest of the weekend.

TraderJoe

Saturday, October 28, 2023

One Thing is Missing

This may be the most boring stock chart you may see. It is the ratio of NYSE Declining Stocks to NYSE Advancing Stocks. In following this ratio for years, a 4:1 to 9:1 ratio is typical of a downward impulse wave. (Similarly, the reverse is true for upward impulse waves: typically, 4:1 Adv/Dec to 9:1 Adv/Dec).

NYSE Dec/Adv - Daily - Tame

Meanwhile the area of 9:1 to 12:1 (or greater) is reserved for "kick-off" waves that start a down move or "climatic" waves that near the end of the move. What do we see? With the exception of the move to the June 22 low, there simply has not been either a "kick-off" or "climatic" wave registered in all the market's grinding in both directions. Yet when we look at the "cumulative" NYSE advance/decline line below, we see clear and continuing deterioration in market breadth.

NYSE Adv/Dec Cumulative - Daily - Lower Lows

In fact, the March 2023 low has recently been undercut and the 50-day SMA has a bear cross under the 200-day SMA. This is another factor tending to rule out the immediate upward resumption of a bull move as many are hoping for. Rather, it begs the question of whether the NYSE advance-decline line will put in a "kick-off" or at least a "climax" move lower, with the signature of the 9:1 to 12:1 ratio of declining stocks over advancing stocks.

Again, for how much the A/D line has fallen already, such a move seems eerily absent. Thus, if this Monday or Tuesday should be an overnight gap lower, one would want to watch to see the level of the declines / advances and see if it is maintained throughout the day.

For those looking for a bottom in this area, here are some items in favor of that, and some items against that. Refer to the chart, below.


Factors For:

  1. Price has closed outside the lower band for two days in a row. This lowers the odds to somewhat around the 3 - 5% that the next close will be below the band. Definitely not impossible - just lower odds.
  2. There is a way to count "five-waves-down" from the 12 Oct high. So, a rebound wave could occur. But - as we have warned previously - extensions of a fifth wave are possible.
Factors Against:
  1. The daily slow stochastic (regular calculation) has just embedded. According to Ira's work, it is one of the most powerful signals in all of technical analysis.
  2. There is no reversal candle yet at the bottom of the move. There is not a shooting star or a bullish engulfing - anything that would signal reversal.
  3. Price remains below the 18-day SMA, so the daily bias remains lower.
The message of this post is that we could soon be entering the center of a third wave with a gap down move. Such a move might 'also' be the third wave of a fifth wave of a diagonal - but is not yet required to be. One at least has to be aware of this real possibility. I hope to say more on the Elliott Wave count tomorrow.

Have an excellent rest of the weekend.
TraderJoe