Here is the calculation on the up wave for whether ⑤ remains less than ③. Always use OHLC bars or candles. Always do the calculation in futures, as they use have greater traveling ranges than cash.
AAPL looks to have 3 waves up in this should be the final wave into the top on the daily. Will AAPL make a down up to finish the multi year advance? Though the new high print high satisfies the pattern if it is a ending wedge. The market still has next week. Thanks TJ
No, because of the lower low in Oct 22 a wedge shape (one can draw lines any way they like) does not result in a 'valid' Elliott Wave Count, and price is nowhere near the apex of such a wedge. TJ.
SPY 1-Hr: here's an hourly update. By the methodology we should try to look for a fourth wave, miniscule 4, which might be a triangle or a flat. The overlap indication has moved up as shown.
Hello ET. Appreciate the chart and the intraday updates. For context, IIRC, this 5 is likely ending the c of an abc up off the late Oct lows. My own math charting has this abc up NOT as a final top, but just an interim one. So given the even larger context, assuming I'm correct, I'll be watching for abc 2ED, then abc 3ED up etc. Simply because I see more to come after this top and the abc up off the lows (and not a/1 b/2 c/3 etc) seems to rule out any other larger EW pattern (esp. impulsive) that I'm aware of. If I'm off base on this, please advise.
Here's a revised analysis. The black count suggests the market 'triangles' or makes a Flat until the FED actually decides on rates. In other words, they haven't actually 'done' anything yet.
https://www.tradingview.com/x/zjICeMtc/
The red count suggests the up pattern is over, and perhaps Yellen pulled the rug out when she came up with the alternate Treasury financing scheme. The Principle of Equivalence requires consideration of both because both of the (a),(b),(c) corrections noted are so similar in shape, and if the second (a),(b),(c) is all of (4) then it is remarkably short in 'time'. Note too, that the lower degree B is shorter in price and time than the higher degree (3) in the same direction, leaving degree analysis intact. And B stopped suspiciously at 1.618 x A.
TJ - what are your thoughts on the Russell now that the proposed Z wave was taken out? https://studyofcycles.blogspot.com/2023/09/russell-2000-futures-count.html
Robert Prechter was very fond of that impulse that just got taken out. It did not look that great when TJ's eight fold path was applied. It looked like a very weak impulse that was finishing a larger structure, not kicking off a new one.
RUT Futures (RTY) Weekly: the most straight-forward count is the black one. It meets most criteria including (C) make a new low, and (C) is 'at least' 38% of (A) or more - ala Neely. It suggests the RUT could eventually go over the high like the Dow.
https://www.tradingview.com/x/TWSGZAex/
The red count is the alternate and it responds to the fact that the earlier Minor Y, and Z waves up never took out that W wave. This formation would either be a larger double-three or triple-three (very difficult to tell) but for now I' call it a 'triple three'. Then, this suggests that the RUT may stay divergent from the major indexes. By the Principle of Equivalence, this alternate needs to be 'considered', but momentum is locally up, this is to be respected for now, and other technical evidence must be used to see when a pull-back or lower-low is due.
I do not see any sign of rollover or profit taking by BOTS for December future contacts expiring today except intraday 4683 SPX on Wednesday. I have never seen such a silence and if it is already rolled over then ATH in SPX is imminent.
SP500 (SPX) is a simple, theoretical calculation of the index from the individual components. As such, it is not a tradeable. SPY is an index ETF, which 'is' tradeable, and whose price is also affected by these factors 1) actual trading by individuals/groups, 2) dividends are included in SPY, not SPX, and are also subject to ex-dividend price drops/rises. SPX is not, and 3) options can be bought/sold on SPY, not SPX. For these three reasons, the prices sometimes diverge - even though the goal of the ETF managers is to have SPY 'track' SPX. It does 'track' it, but not always exactly.
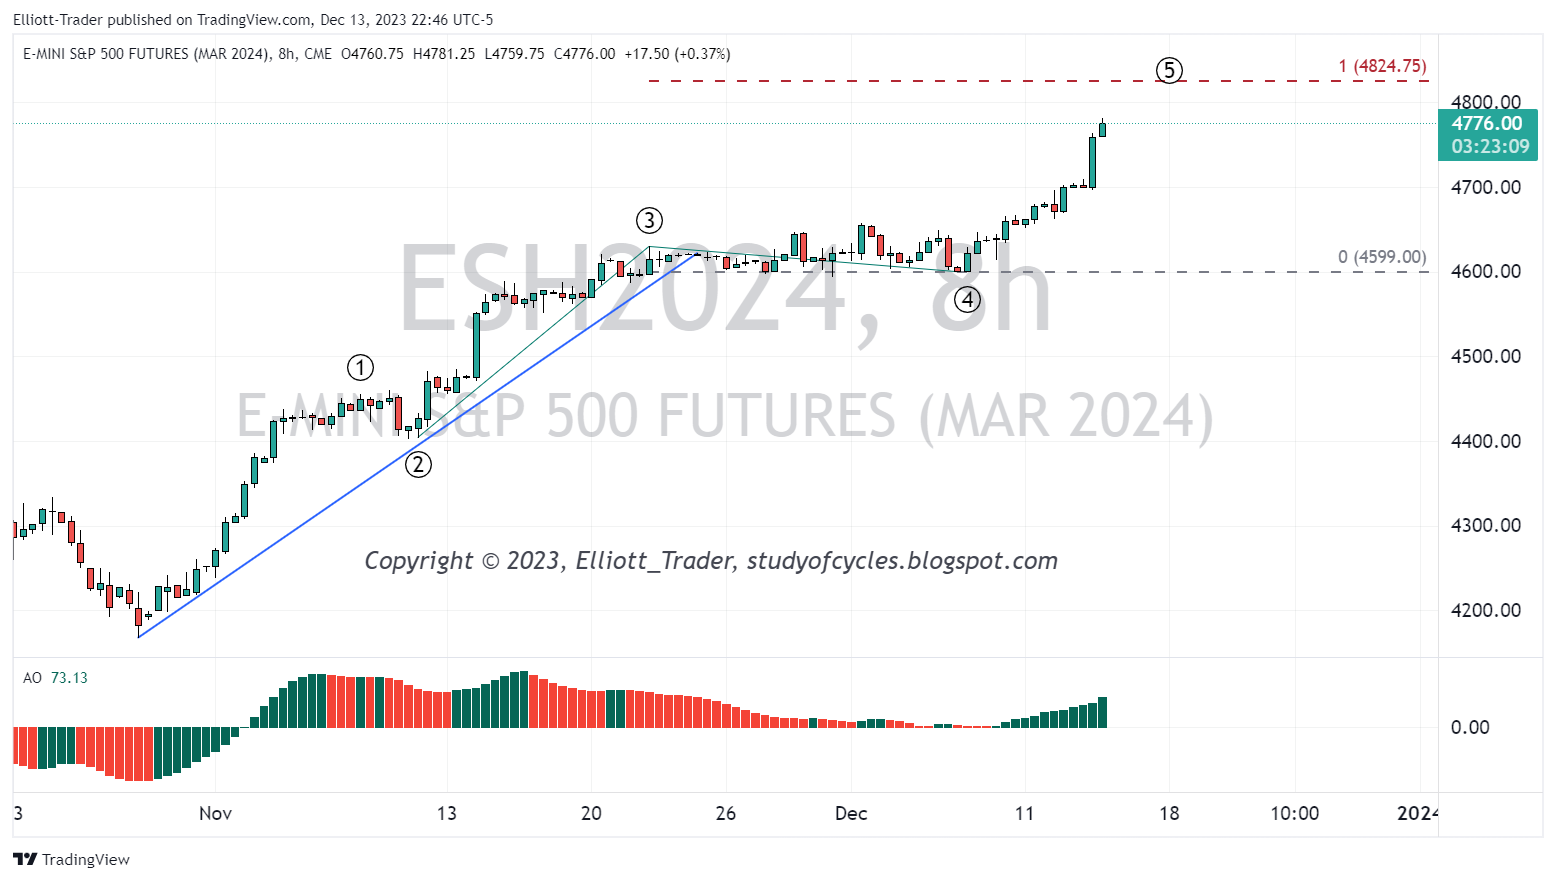
Thanks Tj. Didn't understand how 3 and 4 are drwan for validity? Is it time or price we should look upon or count?
ReplyDeleteMy apologies. I don't understand your question. TJ.
DeleteHow you marked 3 and 4? Price wise or time wise or both.
DeleteSee the prior post, and the trend line analysis.
Deletehttps://studyofcycles.blogspot.com/2023/12/up-wave-structure.html
TJ
AAPL - weekly - has pierced its prior weekly high and can be counted as in a fifth wave up.
ReplyDeletehttps://www.tradingview.com/x/ohItstcV/
TJ
AAPL looks to have 3 waves up in this should be the final wave into the top on the daily. Will AAPL make a down up to finish the multi year advance? Though the new high print high satisfies the pattern if it is a ending wedge. The market still has next week. Thanks TJ
DeleteHello TJ, Do you see a upward wedge in the cash SPX starting at the August 15,2022 high? Thanks
ReplyDeleteNo, because of the lower low in Oct 22 a wedge shape (one can draw lines any way they like) does not result in a 'valid' Elliott Wave Count, and price is nowhere near the apex of such a wedge. TJ.
DeleteThank you
DeleteSPY 1-Hr: here's an hourly update. By the methodology we should try to look for a fourth wave, miniscule 4, which might be a triangle or a flat. The overlap indication has moved up as shown.
ReplyDeletehttps://www.tradingview.com/x/9TTlQPLX/
TJ
SPY opening up gap is now closed.
Deletehttps://www.tradingview.com/x/pj7SuF9c/
TJ
Looks like 3 down, upward overlap.
DeleteAgreed. TJ.
DeleteHello ET. Appreciate the chart and the intraday updates. For context, IIRC, this 5 is likely ending the c of an abc up off the late Oct lows. My own math charting has this abc up NOT as a final top, but just an interim one. So given the even larger context, assuming I'm correct, I'll be watching for abc 2ED, then abc 3ED up etc. Simply because I see more to come after this top and the abc up off the lows (and not a/1 b/2 c/3 etc) seems to rule out any other larger EW pattern (esp. impulsive) that I'm aware of. If I'm off base on this, please advise.
DeletePlease see Sunday's post at the link below.
Deletehttps://studyofcycles.blogspot.com/2023/12/if-dow-does-over-high-in-2023-or-early.html
TJ
Overlap in the 10 year note - reference post https://studyofcycles.blogspot.com/2023/11/another-pop-from-rates.html
ReplyDeleteHere's a revised analysis. The black count suggests the market 'triangles' or makes a Flat until the FED actually decides on rates. In other words, they haven't actually 'done' anything yet.
Deletehttps://www.tradingview.com/x/zjICeMtc/
The red count suggests the up pattern is over, and perhaps Yellen pulled the rug out when she came up with the alternate Treasury financing scheme. The Principle of Equivalence requires consideration of both because both of the (a),(b),(c) corrections noted are so similar in shape, and if the second (a),(b),(c) is all of (4) then it is remarkably short in 'time'. Note too, that the lower degree B is shorter in price and time than the higher degree (3) in the same direction, leaving degree analysis intact. And B stopped suspiciously at 1.618 x A.
Hope this helps.
TJ
Actually, pardon me. I found a degree analysis error in the prior comment, and wish to correct it below.
Deletehttps://www.tradingview.com/x/kf3DekyY/
Five reasons now support the "Yellen rug-pull" including 1) degree, 2) channeling, 3) RSI, 4) alternation, and 5) count in wave (5).
TJ.
Thanks TJ, now we shall watch for a retest and fail at the bottom channel line.
DeleteTJ - what are your thoughts on the Russell now that the proposed Z wave was taken out? https://studyofcycles.blogspot.com/2023/09/russell-2000-futures-count.html
ReplyDeleteRobert Prechter was very fond of that impulse that just got taken out. It did not look that great when TJ's eight fold path was applied. It looked like a very weak impulse that was finishing a larger structure, not kicking off a new one.
DeleteRUT Futures (RTY) Weekly: the most straight-forward count is the black one. It meets most criteria including (C) make a new low, and (C) is 'at least' 38% of (A) or more - ala Neely. It suggests the RUT could eventually go over the high like the Dow.
Deletehttps://www.tradingview.com/x/TWSGZAex/
The red count is the alternate and it responds to the fact that the earlier Minor Y, and Z waves up never took out that W wave. This formation would either be a larger double-three or triple-three (very difficult to tell) but for now I' call it a 'triple three'. Then, this suggests that the RUT may stay divergent from the major indexes. By the Principle of Equivalence, this alternate needs to be 'considered', but momentum is locally up, this is to be respected for now, and other technical evidence must be used to see when a pull-back or lower-low is due.
TJ
I do not see any sign of rollover or profit taking by BOTS for December future contacts expiring today except intraday 4683 SPX on Wednesday. I have never seen such a silence and if it is already rolled over then ATH in SPX is imminent.
ReplyDeleteSPY 1-Hr: a keen eye might be kept on this upper declining trend line.
ReplyDeletehttps://www.tradingview.com/x/HbznBqkM/
TJ
SPY 1-Hr: now up & over the declining trend line with an upward break of RSI indicator local trend line, as well.
Deletehttps://www.tradingview.com/x/tbxl85xQ/
TJ
why spy has a different structure than spx cash..confusing
DeleteSP500 (SPX) is a simple, theoretical calculation of the index from the individual components. As such, it is not a tradeable. SPY is an index ETF, which 'is' tradeable, and whose price is also affected by these factors 1) actual trading by individuals/groups, 2) dividends are included in SPY, not SPX, and are also subject to ex-dividend price drops/rises. SPX is not, and 3) options can be bought/sold on SPY, not SPX. For these three reasons, the prices sometimes diverge - even though the goal of the ETF managers is to have SPY 'track' SPX. It does 'track' it, but not always exactly.
DeleteTJ
A new post is started for the next day.
ReplyDeleteTJ