Tuesday, May 31, 2022

It's a Mess, but it's Our Mess!

Yesterday, we cautioned that today was the end of the month, and it could bring some sloppiness from typical month-end window-dressing. That is one good way to characterize the way the day traded. We noted yesterday that price had hit the upper daily Bollinger Band, and that is often a place where the so-called Smart Money takes some profits off the table. Here is the daily Bollinger Band view.


So today was a small down day and can represent some consolidation of the recent up wave. Can a higher high be made? It can. Yesterday, we also showed this count in the ES 1-hour futures.


We noted this morning that a fourth wave had hit the lower channel boundary, and there was a bounce. Is the fourth wave over? Well, while it has done the very minimum that a fourth wave needs to, it could do more. The reason? Cash indexes, like SPY, have not come close to their lower channel boundary yet. So, they might form a larger flat wave, or form a triangle against that daily upper Bollinger Band.


Note the difference between the cash SPY channel above, and the futures channel previously shown. For reasons of form and proportionality, it would be more likely that that SPY trade below the EMA-34 and maybe contact the lower channel. That might bring the Elliott Wave Oscillator (EWO) closer to the zero line.

So, keep an open mind to the various forms of fourth waves (flat, expanded flat, triangle, etc.) and let's see how this works out. Then, let's see if a further fifth wave forms in the upward direction. For the moment, we're taking it step-by-step.

Remember, tomorrow is the first trading day of the new month, and this often brings some inflows from the usual sources (we noted some yesterday).

Have a good start to your evening.

TrasderJoe


Monday, May 30, 2022

An Experiment - Part 3

We're about 137 - 138 hourly candles in from the low including the Sunday/Monday session. Try as you might it is hard to know where that ii/b is. The second location yields 1.618 from here. Will a fourth wave begin? Only if the a,b,c shown is not the (e) wave of an expanding triangle - a count alluded to by reader marc, and which is a reasonable suggestion. It would be quite a fooler.


Today's up wave hit the upper daily Bollinger Band, then there was the small break seen. Tomorrow will use the Sunday/Monday prints in the Tuesday calculation of the Bollinger Bands the way the Globex price bars work. The Elliott Wave Oscillator (EWO) seems headed for the typical fourth wave location (or more, lower). I will add a reminder that Tuesday is the last trading day of the month which 'often' sees month-end window dressing, and Wednesday is the first day of the new month which 'often' sees the inflows from the roll-overs, pension funds, dividend reinvestment plans, company bonus plans, etc. that we have mentioned before.

More importantly express appreciation for any Vets you might come into contact with today. We do honor their service.

Have a good rest of the holiday.

TraderJoe

Saturday, May 28, 2022

An Experiment - Part 2

Already the wave structure is giving any Elliott analyst difficulty. For example, one opportunity for a true nested wave count, lower, was invalidated. We called it out when the level was exceeded. So, it may be that something else is going on. Looking at the weekly chart of the ES futures we can see several items of note.


First, we note the current weekly up channel, shown in magenta, and the price bounce off of it. Second, we note prior price peaks & troughs which are connected with the dotted purple horizontal line which is labeled as potential resistance.

Fourth, we note the value of the Elliott Wave Oscillator. It is currently at -378 compared to a prior peak value 0f +412. That is -92% of the prior peak much greater than the optimal range for a fourth wave with 113 price closes on the chart. The optimal range for a fourth wave, as I have noted many times is +10% to - 40%. This is -92% and is much greater. Could it still signify the third wave, lower, but in a different manner than the typical impulse?

Fibonacci fifth, several of us (especially including reader BBRider) have noted the herky-jerky nature of the downward price movements - even as early as the first downward moves - and suggested possible diagonal structure. Is it possible to be forming an expanding diagonal downward? It seems that it might have to be the power of a third wave (3) that breaks the channel trend line - if it does - and that it would be a C wave of a third wave, also powerful, that does that. 

We know that overall, the downward wave is longer in price than the first downward wave. But it does not seem to be longer in time yet. Therefore, where all might be trying to count a second wave up, it might only be a minor B wave, up, with a downward "C" wave to follow.

We don't know for sure, but certain indicators - such as RSI - don't look right yet for a third wave. They have not fully gone oversold, and there was little sign of true capitulation at the low. Another item to keep in mind is time. This wave is already longer in time than the drop to the Covid-19 low! And the whole correction is longer in time than any obvious correction in the prior up trend. So, the time relationships should be telling us something as well.

So, this count is something to chew on. It might be a very unexpected count, and might be just what the algo's are trying to use to further whip prices into a jumbled mess.

Have a good start to the weekend and your holiday if you are celebrating Memorial Day.

TraderJoe

Thursday, May 26, 2022

An Experiment

I was looking for a way to mimic the Neely data preparation steps without actually having to manipulate the data off-line (subject to error, and time consuming). What I don't especially like in the Neely technique is problem due to "sampling error". Suppose you pick a 4-Hr time period and pick the high and low of the time period, but in the interim is a 'relatively small' wave that might be a triangle or something important. That might get missed just due to sampling error: the time period selected.

What appears below has no tricks in it. It turns out NinjaTrader has a built-in indicator called a zigzag indicator. All I did was set the filter to a 0.5% move, and also select "Use Highs and Lows". Then, I just "hid the price bars", looked for alternation in the move, and tried to resolve any overlaps.


It turns out the count in this wave is the same as that shown in the daily Dow chart, yesterday, with a crisper look to it. Shown are the actual highs & lows of the bars, provided the moves are better than 0.5%. At this location because 1 is shorter than (1), then I think the degree labels in the ES futures work out as well. I will double-check this over the next couple of days.

The key now is that the wave (ii)-(iv) trend line has been decisively violated, we might look for an up wave than makes a decent wave 2 and stays shorter in price & time than Intermediate wave (2).

I'm going to be experimenting with this over the next couple of days and let you know if I like it or not. Right now, it is a really welcome sight to have an ES count that agrees roughly with the count on the Dow (futures). 

The Fibonacci extension ruler is shown as the extension of a (c) wave from the (b) wave of the potential expanded flat. The latest up wave is shown with a dashed line, as we don't have any information that it is completed at this time. 

Have an excellent start to the evening.

TraderJoe

Wednesday, May 25, 2022

DJIA invalidated a larger diagonal - not a smaller one

I don't 'know'. This is my best stab at it. There are enough overlaps to drive a sane person mad. Here is the DOW daily chart.


Have a good start to your evening.

TraderJoe

Tuesday, May 24, 2022

Good news: there's a limit on wave minute ((iv))

Using the SPY hourly chart - which we have posted before, we see that part of yesterday's action may have been either a diagonal for the blue a wave, or - because the retraces were not 62% - an impulse for the a wave, and then an expanded flat for the b wave. We are showing this second construction on the hourly chart below.


The good news is there is a defined limit on the blue minute ((iv)) wave. Do you remember the limit? In a contracting diagonal blue ((iv)) may not - by rule - become longer than blue minute wave ((ii)). Readers of this blog should use OHLC charts tomorrow to assess this condition. And, yes, blue wave c of ((iv)) may fail if it wants, so that is something to pay attention to, as well.

When the wave ((iv)) terminus is located, and if it holds, then the upper potential diagonal trend line should be redrawn to wherever that location in.

And, if the measurements of a contracting diagonal don't hold up  - because wave ((iv)) becomes too large - then we simply accept the measurements - without emotion - and look for the next most likely count. And with the three-wave-sequences currently in place that might wind up being a larger flat wave.

The market keeps challenging us to stay engaged and keep our thinking caps on. Remember, it is only Elliott Wave theory that gives us such clear and concise terminal points to know when we are right or we are not.

Have a good start to the evening.

TraderJoe

Friday, May 20, 2022

Robotics 101 (J/K)

From a price action & algorithmic trading standpoint today is not at all difficult to understand. Prices today got down to the lower daily Bollinger Band. And what does Ira say about the lower band? Things like 1) Smart Money will likely be taking some profits, 2) no new shorts below the band. So, prices got to the lower band, and then they rebounded to finish positive.

ES Futures - Daily - Lower Band Hit

It also wasn't hard to understand from a trading psychology standpoint. All day the "talking heads" were yakking about bear market territory. This typically happens at/near a low rather than at/near a high. It did again. Further, it was Friday, and a lot of big traders will lighten up before the weekend - especially with a war raging - and then reassess when the new week starts. So that fits, as well.

From an Elliott Wave perspective price made only three-waves-down (see my last comment in the prior post to see how the three waves were made). Thus, as bear-markety as it seemed, it might be only the "B" wave of a flat or it could be the third wave in a diagonal. How would the diagonal work? Like in the following chart.

ES Futures - Daily - Potential Diagonal

As always diagonals are waves that must prove themselves in every detail. A potential diagonal as shown is not a reality until all five waves form properly. We will see if such a thing can happen.

So regardless of the algorithms or robotics involved, we just keep our heads on, and our minds engaged and try to determine the next most likely wave count. Such a count might also again work with the daily Bollinger Band if it slips lower on Monday/Tuesday. We'll just have to see. Remember, in this count, minute wave ((iv)), circle-iv, would have to remain shorter than minute wave ((ii)), circle-ii. And the same for minute ((v)) remaining shorter than minute ((iii)).

This is a great way to keep the market compressed and grinding most trades into submission.

Have an excellent start to the weekend,

TraderJoe

Wednesday, May 18, 2022

Can it Parallel (Approximately)?

Just keeping it simple tonight. Our first job is to find whether an impulse can form a parallel, as in the ES 30-min chart below.

ES Futures - 30 min - Can Fourth & Fifth Waves Form in a Parallel?


If it can, and if a fourth wave forms properly, followed by a fifth wave, then it seems like an attack on the prior low is possible as well as re-visiting the lower daily Bollinger Band.

A step at a time here. The longer term will take care of itself, for the moment.

Have a good start to the evening.

TraderJoe

Tuesday, May 17, 2022

Clear Overlapping Wedge in ES Futures

For the last couple of days, we have been trying to count an up wave. Looking at the hourly ES futures, it looks like the pattern currently is that of a significantly overlapping wedge, with three zigzags in it, like the one below.


With three zigzags, the mind must remain open to the possibility of a diagonal. But, if it is just three zigzags, with price remaining below 4,102 then it might be the second minute wave in the nested count. Keep in mind the retrace waves, or (x)'s in this count are not 62% or greater. Thus, the triple zigzag is preferred at this time. The alternate is more probably a leading diagonal rather than an ending one.

The volatility is high, and price action today was whippy on an interview by the Wall Street Journal with FED Chair Jerome Powell.

Having lost the embedded daily slow stochastic, the market may be trying to target the 18-day SMA.

Have an excellent start to the evening.

TraderJo

Saturday, May 14, 2022

Nesting?

The cabal that is running the financial markets (the Federal Reserve, the large banks, the exchanges, the Treasury, and the large hedge funds) are using A-I against the retail trader. A-I just means Artificial Intelligence, and it is really nothing more than a computer and a sophisticated set of algorithms that monitor account balances in real time and have a goal seeking procedure to limit trader profits. If you have been trading for many years, you've heard it expressed as 'maximum pain'. In Elliott Wave terms, let's call it a point of significant uncertainty in the wave count.

You are at a disadvantage. Why? You don't have access to everyone else's position to know minute-by-minute what they are doing. The Exchanges do. The Clearing Firms are charged with knowing your balances and insuring margins are met at all times. In Arby's terms, "they have the beef".

If you are a frequent reader of this blog, you know by now, that one of the algorithms used is the daily Bollinger Band and the relationship of price to the 18-day SMA. Ira Epstein's (Broker with the Linn Group) videos explain this concept on a daily basis. The evidence is clear, frequent and cogent. Friday, prices bounced off of the lower daily Bollinger Band. Is that a surprise, especially after a Fibonacci 89 days of decline? 

From an Elliott Wave perspective, we were attempting to count a wave upward, within limits and, so far, it has held. Why didn't it bust? We don't know yet. It still could bust on Sunday or Monday. Like many, we know that, at least temporarily, some trader sentiment (like AAII, and to some degree put-call ratios) were getting a little stretched. So, there could be more rally. 

Then, from an Elliott Wave perspective what is one to do? Yes, like many on our Thursday post we showed how you can count two sets of five Minor Waves down. Could they be (A)-(B)-(C) and done? Well, that is 'possible'. But we also noted how the market could make a true extended third wave down, and we simply want to show some measurements that will help confirm or deny it in the ES 8-Hr chart, below.


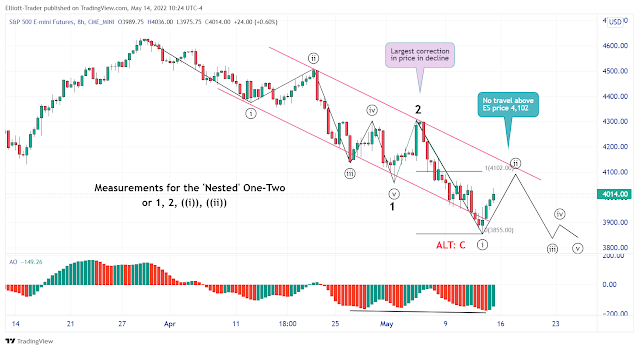
The first item to note is that the Elliott Wave Oscillator is on both a local and daily low. That, by itself, is not definitive. Some C waves do not end on a divergence. So, the bottom is labeled ALT: C. Next, we look for the largest correction in terms of price in the decline. In the nested count, that must be the second wave, labeled 2. We note that it just barely exceeds a 38.2% retrace and note how it could be located at a prior fourth wave, minute ((iv)), circle-iv. And this, coupled with degree labeling definitions, gives us an objective measurement. IF the downward wave is to further accelerate in a nested pattern, then it must remain shorter in price and time than wave 2. That means - as an absolute limit - a minute ((ii)), or circle-ii, wave may not travel beyond ES 4,102 - as shown.

Importantly, we note that minute ((i)), circle-i, does not have to be done at this location, particularly if the expanding diagonal potential we were tracing out on Friday comes to pass. But it could be done. Yet, the first minute ((i)) in wave 3 could be as long in price as Minor 1 is long. It is nowhere near there. We also note that the Thurs-Fri up wave in only in three-waves at this time. Why not five? Could minute ((ii)) be over? It could, but we do not know, and this is the significant uncertainty referred to above. 

For now, we note the EWO on the 8-hr time frame is on green bars. And second waves can do some wacky things like form a double zigzag, instead of just the single zigzag we have now. And this points to another thing to watch. Minor 2 in the nested count is a maximum of nine 8-hour bars. And this suggests that if the if up wave passes ten eight-hour bars (or the price limit noted above), then the nested count is likely not working.

If this seems complicated, let's boil it down to its ultimate simplicity: over 4,102 or more than 10 8-hr bars in the making and a nested minute ((ii)) wave is temporarily off the table - at least by degree labeling definitions.

How simple is that? Have an excellent rest of the weekend.

TraderJoe

Thursday, May 12, 2022

Embedded

I listened to Ira's video last night and, regarding the argument of expoential vs. regular moving averages for the daily slow stochastic, he said, "the ES futures were on the verge of embedding". He was careful to say they did not actually embed. Today, the daily slow stochastic did embed, as per the daily chart, below.


Further, whereas price did not make it to the lower daily band yesterday, it did today. It also pierced the daily declining parallel lower. Then the futures bounced to form a doji candle near the close. The wave count is being a bit of a pain right now. At one point during the day, we got either 'five-waves-up' in the form of a diagonal or a double zigzag, and then the low of the diagonal (or DZZ) was exceeded lower. So, that might have the "(b)" wave of a larger expanding triangle wave in an hourly count like the one below.


We do not know if a legal expanding diagonal will form, or if the three waves down, so far, only represents an intractable overall larger ((b)) wave. What separates the two counts at this time is trading over the minute ((ii)) wave.

We do note that a diagonal is possible with the embedded reading. An perhaps, such a diagonal would get the market more over-sold. That is, note where the RSI finished the day today, "middle of the range".

Have an excellent start to the evening.

TraderJoe

Wednesday, May 11, 2022

Hard to Argue With

On the ES daily chart (and more clearly using the ES 4-Hr chart) it is hard to argue with the count of another five-waves-down, falling a couple of ticks just over equality with the Jan to Feb, 2022 drop, as shown on the daily chart below. However, the couple of ticks are enough to currently make the waves of the same degree.

ES Futures - Daily - Just a Smidge Over Equality


The down wave includes a 1.618 third wave, shown, and a non-overlapping retrace for a fourth wave as a sharp that alternates with a flat second wave. Should the market retrace and give way again to lower local lows, then the clear alternate is shown on the chart as alt: 1, alt: 2, and alt: ((i)) of a larger declining wave. (Note: there is a gap in this wave in the daily ES which 'could' make this a third wave, giving some significant credibility to the red alternate count). In the alternate count, a new second wave alt: ((ii)) may not trade above the high of alt: 2.

On a four-hour chart, with 180 candles, the EWO diverges at today's low, but, by-all-means, it is not very convincing yet. Further, upward counting should not begin in earnest until/unless price started printing full candles over a trend line drawn from black Minor 2 to black Minor 4.

On this chart, the daily slow stochastic has not embedded yet. And while in over-sold territory, there is nothing bullish on the chart at this time. There is not even a daily higher-high bar since wave minute 4. Thus, the daily swing line is still headed lower, and price has again tried to attack the lower daily Bollinger Band but did not quite make it there today.

Also of interest, the daily fractals are acting as they should to help define terminus points of waves.

Have a good start to the evening.

TraderJoe

Tuesday, May 10, 2022

Make-Or-Break Day

Today is likely a make-or-break day between a potential "B" wave count and a larger impulse count down. First, a review of this morning's daily chart (before the inflation reports tomorrow) shows a lower low day. This has the potential to continue the swing-line in the down direction. 

ES Futures - Daily - Lower Low day

However, one should note the lower low is made against the lower daily Bollinger Band, and this is "often a place where the so-called Smart Money is taking profits from short positions. They may let some of their positions ride lower, but they are likely coming out of at least a portion of their trades." Certainly, to paraphrase Ira, "no new short positions should be opened under the lower band." (This is not trading or investment advice - just a paraphrase of Ira's guidelines.)

Shorter-term, looking at the ES 2-Hr chart, below, we see several items: 1) there is now an approximate c = a, down, 2) the short term downward parallel has been breached to the upside, and 3) last night's down wave currently has a low at the 1.382 external retrace level of the up wave.

ES Futures - 2 Hr - Measurements


So, this is why today might be a make-or-break day. If the market cannot muster even a "(c) wave up" to complete a flat or expanded flat wave, it may be in significant trouble. We'll be watching the inflation report tomorrow with interest.

Have a good start to the day.

TraderJoe

Saturday, May 7, 2022

Follow the Procedures - 2

Elliott Wave counting does not reduce market risk to nothing. If it did, there would be no market. But having clear, defined procedures helps reduce the additional risk posed when a trader's emotions further cloud the market picture. One such clear procedure is the use of the Bill Williams' Alligator and fractals on the daily chart. Another clear procedure is the use of Elliott parallel trend channels to help define whether momentum is with or against the market. Below is the current situation with Willams' daily Alligator and fractals. (This is an update from the "Follow the Procedures" post at this LINK which did provide a valid five-waves-down sequence).


The last week's daily market action created a daily down (red) fractal at the May 2 low. It also created a valid up (green) fractal at the May 4 interim high.

We note that on Friday, the market held off making a new low below the 2 May down fractal, but it clearly did come within 90% of the low. This measurement allows a Flat wave to form legally and possibly revisit the May 4 high. However, at this time, the up fractal at that location is below the upper limit of the gator at that level. Therefore, if that fractal is exceeded upward, it might only be a trap fractal.

Similarly, if on Monday the market is inclined to continue making lows, then it is still possible to form a larger flat or expanded flat wave.  Why the focus on a flat wave? First, the volatility index while still at a very whippy level of 30 did back off from higher levels on Friday. Here is the chart of the daily VIX.


If the VIX continues lower, then it could easily retrace to support at the 18-day and 100-day SMA. This would likely represent a concomitant increase in US equity prices.

A second reason is that since the 29 March high there have been 20 downward days to the low, but only three up days since to the 5 May high. This seems very disproportional in terms of time at this moment. So, a flat wave could extend this correction further in terms of time.

A third reason is a bit more straight-forward. If we look at the ES 1-hour chart, below, we see some of the local parallel channels.


As of Friday's close, we could only count three waves up, and a similar three waves down. So, first one needs to ask the question, "why can't we count five-waves-down as of the end of the day?" Next, we need to watch the upper trend line of the most recent down parallel to see whether it holds allowing lower prices or whether it breaks higher on Monday. We might know this answer before Monday's opening bell.

Yes, there clearly are ways the B wave of a flat can extend downward - which would involve breaking the prior daily down (red) fractal. But right now, such further downward movement is not in evidence. And such is the way that risk is maintained in the market even in the face of a reasonably well-described wave count.  It is the very structure of corrections (flats, expanded flats, zigzags, combinations and triangles) that often expands this risk within limits.

Clearly, the above structure looks like a traditional head & shoulders top - which would provide a clear downside wave-counting target. But, at this time the five waves down needed to activate and follow that count are difficult to find.

Further, there is a new five-wave-sequence upward (:5) without a new low yet. So, while we clearly see the possibility of more daily downside waves eventually, we need to "think globally" but count locally.

Have an excellent rest of the weekend.

TraderJoe

Thursday, May 5, 2022

Slice of Parallel - No Back-test Yet

On the ES hourly chart, prices started lower overnight in a very insidious manner - they just scraped along the 18-day SMA until they failed lower. When they failed, they broke the lower parallel as shown, below.


Often (not always) when prices do this, they back-test the lower parallel. So far, that back test has not happened. It could. The down wave only got to a 78.6% retrace today. At the moment a double-zigzag is on the table, and so is a flat wave to make a larger second wave correction. Those, of course, do not have to occur, but they could in order to make an up wave that is more proportional in time. And such counts might better agree with the current lower Bollinger Band location.

If, for some reason, neither of these forms then the third option is a more definitive impulse lower.

Towards the end of the day, the NYSE adv/dec line maintained its impulsive character at greater than a ratio of 1:7 to the downside. And, again, nothing to the downside will surprise us at this point.

Have a good start to the evening.

TraderJoe

Wednesday, May 4, 2022

No Clear Indication of a Terminus

Although we were clearly able to call an overnight potential triangle in the ES hourly futures (shown below), the up wave produced on the results of the U.S. Federal Reserve' meeting output does not show a good sign of ending yet.


Neither the MACD nor its histogram is diverging at this time. And price has exceeded the channel to the upside. Therefore, until there is more information the up wave is as likely to be a iii wave as it is to be a c wave.

We will continue to scour for clues. Kindly remember that if this is a second wave up at some degree, it could also form a double-zigzag w-x-y and that may be a reason why there is no divergence yet. Until we see something that looks like a clear reversal, we will continue counting a correction or an impulse upward.

We just remain flexible to which it is. Have a good start to the evening.

TraderJoe

Monday, May 2, 2022

Another Five-Waves Down to a New Low

On the ES four-hour futures, we were able to count another five-waves-down to a lower low. On a much larger timeframe - just so it can be pictured - at the moment there are only a larger three waves down, counted below as 5-3-5.


Other than being able to identify the low today, as (v) = 0.618 x net[(i) through (iii)] to the half-hour, there is not much more we can say about the current wave structure. We can say that it is possible to form either a larger impulse OR a diagonal with these waves. Thus, the trend lines shown are only tentative.

Towards the end of the session a healthy impulse upward occurred, and this could be the start of a corrective wave as some upward overlap has occurred already.

Have an excellent start to the evening.

TraderJoe