US equity prices as measured by the ES E-mini S&P futures did not engage with the 18-day SMA today. Prices headed lower from the outset, making a lower daily low, and this likely has the effect of turning the daily swing line indicator down. Price is below the 18-day SMA, so the daily bias continues lower. And the daily slow stochastic indicator is drifting in the middle of the range, neither over-bought nor over-sold.
 |
| ES Futures - Daily - Lower Low day |
On a short term basis, we could only count three waves down today with perhaps a fourth in progress. It is best seen on the SPY cash chart at the 15-minute time frame.
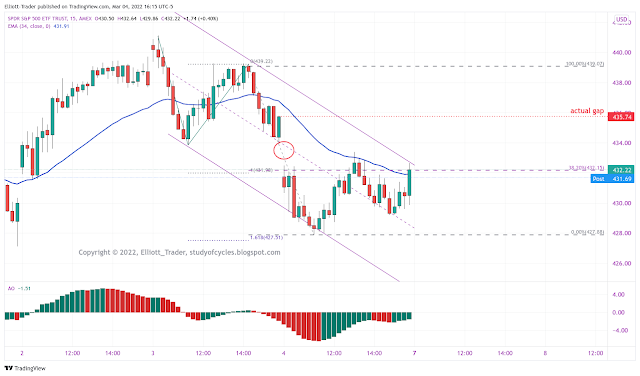 |
| SPY Cash - 15 Minute - Three Down |
The clear three-wave appearance within an Elliott trend channel is obvious at this time, as is the possibility of a fourth wave. A prominent feature of the chart is that the cash gap did not even come close to closing. I'm showing the candle which originates the actual gap in this case.
The is some possibility of a triangle fourth wave. There is also some possibility of an upwardly overlapping wave to potentially make a diagonal in which a higher overlapping high could make a fourth wave. This is because of extensive overlap of certain waves in the futures, too. The third wave down is is longer than the first wave down, yet it is just shy of a 1.618 measurement as shown by the Fibonacci ruler.
This is clearly a news driven market at the moment, and with much of the news unfortunately being war related, there is some probability that the government (PPT or PWG) is taking steps to stem the decline and give people time to think. If you are unfamiliar with the duly sanctioned actions of the Plunge Protection Team (PPT) or President's Working Group PWG, you might like to read the article at this LINK.
Have an excellent start to the weekend.
TraderJoe
Thanks TJ have a good weekend.
ReplyDeleteWelcome Rob. You too!
DeleteTJ
SPY - Traps and Poles - [if interested] (click to sharpen)
ReplyDeletehttps://www.mediafire.com/view/np77911gyqlap9z/TrapsandPoles.PNG/file
MJ - (dly,2wks) - Are we close to "smoke 'em if you got 'em" time?
ReplyDeletehttps://www.mediafire.com/view/6cfm4zqew78qeot/LightUp.PNG/file
ES - current supplemental look
ReplyDeletehttps://invst.ly/xkp87
The 'significant decline' began when I wrote this post, "The Dow has just touched 1.618 - Just Sayin'". Link below.
ReplyDeletehttps://studyofcycles.blogspot.com/2022/01/dow-has-touched-1618-just-saying.html
So, if you're looking for the 'significant decline' from here, you missed it. The 'easy money's been made' as they say. I am only looking to see if a Minor 5th wave finishes a diagonal properly or not. Or, whether a new up trend begins.
The CNN Fear & Greed indicator is a 'muddled' indicator. It combines stocks, bonds, options, and moving averages. So here are some related comments for you.
1. The CBOE Equity put-call ratio is 0.67 - which is "middle of the road." It is not near 1.00+ where it is very bullish, and not near 0.35 where it is very bearish.
2. 'Massive amount' of VIX calls is subjective. Without reference to a number, or to history, 'massive' might still be well within statistical norms. In other words, you are doing no work; doing no actual analysis.
3. The McClellan Oscillator on Friday closed below zero, and the summation index is still in negative territory. Both indicate the decline can continue.
4. The ES had a brilliant chance on Friday to close over the 18-day, and it did not do so, sinking further below it.
This does not make a rise Monday or next week 'impossible'. But, with prices still below the 18-day SMA, the daily bias is lower until it isn't. This indicator puts the odds higher of a decline. Clearly, this is always a matter of probabilities. But picking one number (like CNN F&G) doesn't change probabilities much.
TJ
Noticed a Triangle pattern that formed in the ES at the close on Friday. It brought back the way it opened last Sunday.
ReplyDeletehttps://www.tradingview.com/i/mTqBxGjG/
Yes, very possible in the futures to complement cash.
DeleteTJ
Standing back and looking at this down move from the all time highs. Could this be a leading diagonal?
ReplyDeletehttps://www.tradingview.com/i/dJxLQjBR/
While I think the measurements are correct for a contracting diagonal in the ES (this needs verification), the real issue is whether or not the 'C' waves are true five-wave sequences. Right now using The Eight-Fold Path Method, I could only count them as 'threes' but the issue could be revisited.
DeleteTJ
Looks good for measurements and works nice on the EWO. Only concern I have is 2 and 3 do not look like a simple ZZ's. As TJ has stated, it is a news driven tape. I can get creative and make a running correction for the B of 3.
DeleteThanks for the idea Ronb.
Checking in on BTC -
ReplyDeletehttps://invst.ly/xkq02
GGN - Long term look at a Gold related CEF, trying to get a foothold.[if interested]
ReplyDeletehttps://www.mediafire.com/view/8azuje34w8mz13d/GGNlt.PNG/file
Correction - LPS s/b LPSY
Deletehttps://schrts.co/pFkevsDR
ReplyDeleteEven though the 2/10 yield curve is tight at 24 bps. The 3m/10y curve is the one I pay most attention to as the fed starts hiking. When this goes negative my plan changes. ATB
why is the 3m/10yr is preferred?
DeleteFolks at BOA suggest that the 3mth (1 yr forward) vs 3mth spot is most important to monitor (fwiw).
DeleteYes, use forwards contracts. It provides a quicker and more accurate signal than simply using common yield differentials, like the 2/10.
DeleteIt follows the fed fund rate closely and will be closer to a SPX top than 2/10.
Deletewhere do you guys get the chart for the 3 mo 1 yr forward vs 3 mo spot?
DeleteBTC - current
ReplyDeletehttps://invst.ly/xkwh8
Sectors - current status of each [click to sharpen]
ReplyDeletehttps://www.mediafire.com/view/biibn0qwui0nfcu/sectors.PNG/file
Addendum: XLF/SPY - a look at long term relative strength
Deletehttps://www.mediafire.com/view/rf5lzybxr3hn0h1/XLFSPY.PNG/file
A new post is started for the next day.
ReplyDeleteTJ