This post is titled the "first vaccine" day because I don't know how many announcements we will go through of companies that suggest they have a viable one. From Friday's count ...
While we were definitely headed in the right direction (up) but looking only for a
62% or 78% retrace at the 2,900 - 2,907 targets, the vaccine news
extended the rally. We then exceeded the prior high in cash, but not the Minor A wave, yet. The updated chart in full detail is below.
 |
| ES Futures - 4 Hr - A Larger ((b)) Wave? |
It is possible that this is a larger 'news-driven' minute wave ((b))
back to the 90% level or better. The initial flat counts as this 3-3-5.
There is nothing incorrect about what we did about calling for a flat wave. We got one.
And there is nothing wrong with what we did counting five-waves down to Thursday's low, which is now minuet (c) of the minute ((a)) wave, or circle-a wave, low. So far, we only have three waves up to the 'possible' minute ((b)) wave, or circle-b wave. It can still count as a w-x-y wave in futures and a minute ((c)) wave down for Minor B is still possible.
Meanwhile, it was so boring after the gap up, we had to have some fun.
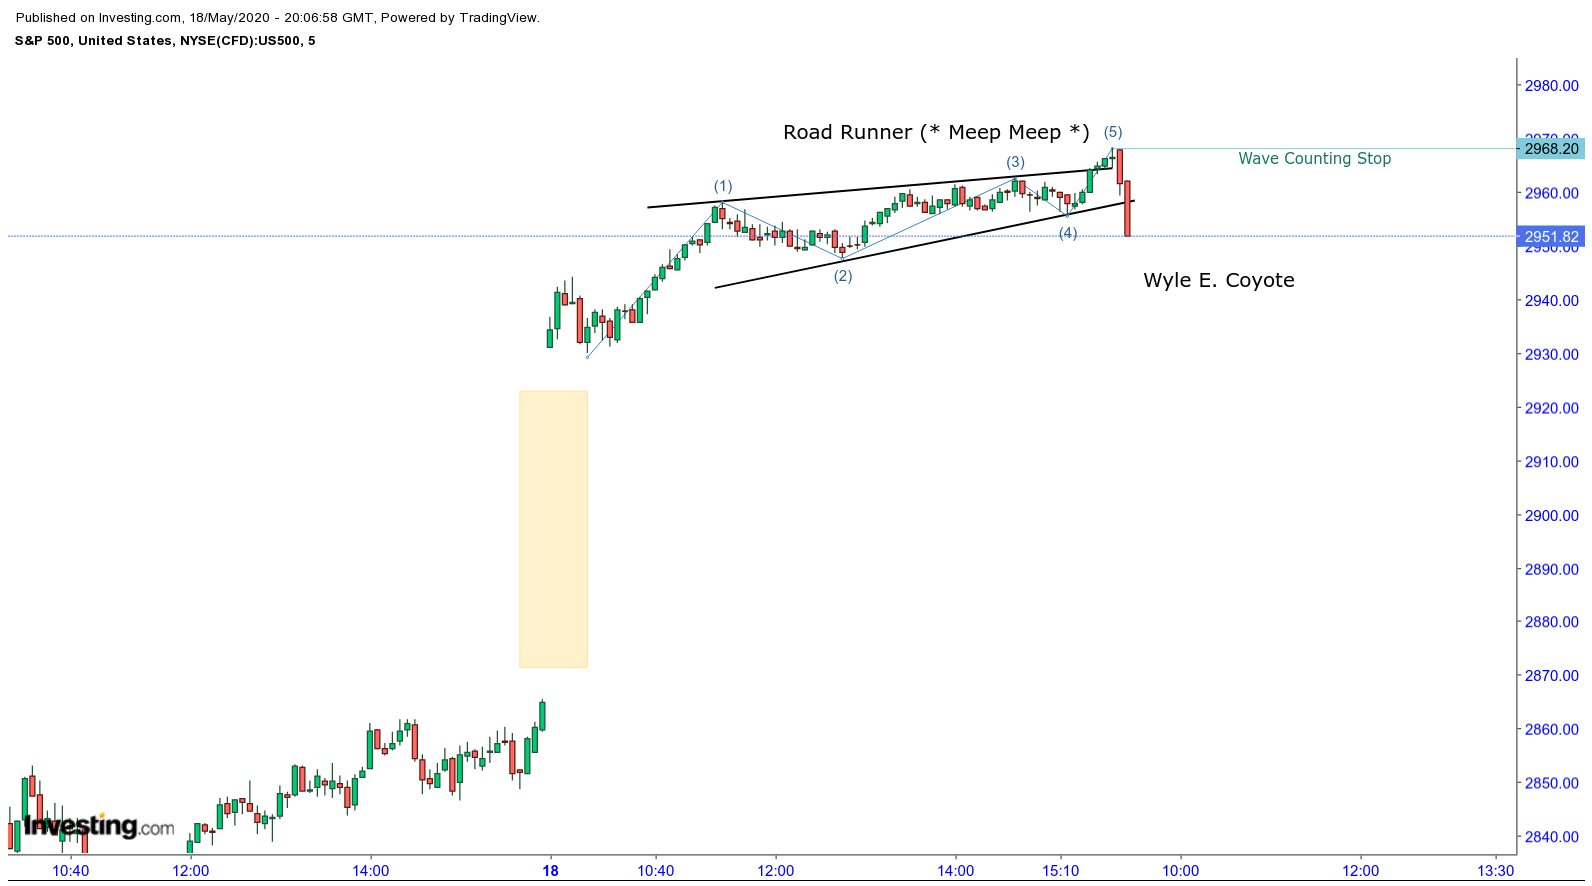 |
| S&P500 Cash Index - 5 Minutes - Wyle E. Coyote? |
Not only might Wyle be falling of the cliff, there might be nothing holding the cliff itself up. More seriously, the five minute diagonal in cash and futures - which is correct is every detail might end the "three-wave" sequence upward to that minute ((b)) wave, or circle-b.
Have a great start to the evening and week.
TraderJoe
..Sorry, but your count as you describe it breaks the 'rules' because your 4 is longer in price than your 2. This violates the rules for a contracting diagonal because in a contracting diagonal wave four 'must' be shorter in price, (and hopefully time) than wave 2.
ReplyDeleteIt should look just like the "Road Runner, Wyle Coyote" picture I showed in the cash market above. If it doesn't it is not likely correct.
Further, while A has been corrected somewhat in time; it really is too shallow in price being just barely 23.6% in price.
ET, If we go back at put A at (iii), could today have been d of a barrier triangle for B?
ReplyDeleteReminder of Powell, Mnuchin testimony on CARES act before Senate at the top of the hour.
ReplyDeleteHow would the overnight new high affect the 5 min diagonal in futures referenced above?
ReplyDeleteThanks
So are we in wave c right now? We're approaching the prior high for wave A
ReplyDeletehello Mobes .. I can tell from your questions that you may not have read the featured post (see link at the upper right of the main blog page) on The Eight Fold Path Method for counting an impulse.
DeleteI am not opposed to counting an impulse upward, but I do want to follow the method, overall.
TJ
looks like an impulse from thursday low (b)... so now in c..... ???
ReplyDeletejoske
hello joske .. I can tell from your questions that you may not have read the featured post (see link at the upper right of the main blog page) on The Eight Fold Path Method for counting an impulse.
DeleteI am not opposed to counting an impulse upward, but I do want to follow the method, overall.
TJ
Gentlemen,
ReplyDeleteHere is my hack on the 1 minute.
https://imgur.com/NPF36Wi
Couple of things to note:
Delete(C) is about 1.5 of (A)
I understand that I don't have 140-160 bars but tough to do in 1 to 5 min
There is divergence on the EWO in the diagonal for (C)
Hope this helps
Now bottom of trend line for diagonal is breached
DeleteHowever, it needs to be longer than ii.... otherwise it can be iv extending to have another v up to finish (C).
Deleteiv would be now longer in time than iii so either diagonal for (C) is invalid or v truncated and diagonal is still in play.
DeleteDiagonal seemed to pan out a little further with a wave v overshoot and now sinking to a .786 retrace and more. Seems to have breached the 1hr trend line that Joe told us all to monitor.
DeleteThe diagonal is now taken out (to the downside) in less time than it took to form so should be leading to the downside.
DeleteReminder of the hourly channel I suggested the other day should be tracked.
ReplyDeletehttps://invst.ly/qv0xt
TJ
To me it looks more like a double zigzag in the making with the last c wave coming to end somewhere between 3000 and 3100.
ReplyDeleteWe do appear to be consolidating around 2950. I agree the move above 2900 brings 3000.00 into play as a former critical S/R battle ground.
ReplyDeleteIn reference to my unanswered question at 10:20am above, it appears that the 5 min diagonal in futures referenced above did not fully retrace before a new overnight high was made. Would this not call the diagonal assessment into question?
ReplyDeleteThanks
The assessment of three upward sloping zigzags was correct.
DeleteRemember, a triple zigzag is the exact "equal-and-opposite" alternative for absolutely 'every' diagonal.
In this case, we know the futures sprang much higher in the after hours from the hourly channel chart shown previously. And, yes, since the time for a diagonal was exceeded, then 'most likely' with the higher high - which also absolutely rules out a pure diagonal at that location - then very likely that triple zigzag structure was the "B" wave of a triangle.
Happily, I was sound asleep for that pop that followed. The pop, by the way, represents the typical 'Far Eastern" market response, by those now awake, to a large up day for our markets. They are trying to "ride the coat-tails" when they see such a large move.
TJ
P.S. .to be more complete and accurate, I should have said, "B wave or X wave of a triangle or FLAT", as it appears a flat was made in this instance.
DeleteSo Joe is the C wave currently in progress?
ReplyDeleteMentioned a few days ago NQ's surprising failure to close a daily and weekly gap and simultaneously reach the 90% retrace level after having come so close. It looks as though today it's ready to put things right. Just another 0.5% needed and both targets are in the bag. If the market tops out today or tomorrow that would potentially be a very bearish development because I cannot see an upward impulse count on NQ unless it goes well past its ATH.
ReplyDeleteDaily S&P 500 futures tagged the upper bb, negative divergence on the AO, price is above the 18ma but below the 100ma which is now below the 200ma and the slow stoch. is approaching overbought: https://invst.ly/qv305
ReplyDeleteSlow stoch was overbought yesterday, with %D > 70, according to Ira.
DeleteI recall that too but Investing.com and TOS both had the %K and %D amounts below 70 yesterday.
DeleteThe ES hourly futures are now in contact with their EMA-34, as below. But, price has broken down through this morning's two hourly down (or red) fractals. That rules out a triangle at this location, but does not rule out much else, just yet.
ReplyDeletehttps://invst.ly/qv32x
TJ
Here is one news item.
Delete"Both the Dow and S&P 500 fell to their session lows after a STAT News report raised concerns about the trial results for a potential coronavirus vaccine from Moderna. "
S & P is tanking hard right now could we fill the gap from yesterday in 10 mins lol
ReplyDeleteIF we are making a 'typical fourth wave', here is a chart showing the typical levels. Can only say that IF price gets below a 50% retracement of the third wave, the odds of a fourth wave begin to decrease rapidly.
ReplyDeletehttps://invst.ly/qv38j
TJ
There is a new post for the next day.
ReplyDelete