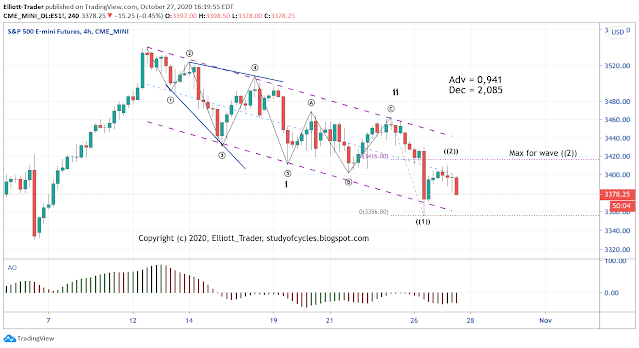
Stocks as measured by the Dow Jones Industrial Average, and SP500 cash index had a down day. The NASDAQ Composite had an up day. The ES futures opened higher at the outset as expected from yesterday's post and comments. They did not exceed the 3,416 level which keep the possibility of the i, ii, ((1)), ((2)) setup, downward, on the table.
The updated chart of the ES 4-Hr futures is below.
 |
| ES Futures - 4 Hr - Micro ((2)) ? |
While today was a down day, the advance decline line was only about 1-to-2 in favor declines, and, by the futures settle, it was still an inside day.
The market re-tested the daily pivot point (PP) using the classic calculation and round-number resistance at the 3,400 level about seven-to-nine times today, depending on how you want to count it, but could not make it through 3,410, and then made a series of lower highs and lower lows.
This is a very heavy earnings week, so things can still get volatile. speaking-of-which the VIX had a locally higher high, and higher close today.
Have a good start to the evening.
TraderJoe
Quite a contest at 3400.00 Looks like 3300.00 now in play with a possible manic second wave into the election...
ReplyDeleteNow below 3,300. That was quick!
DeleteTJ
A big [IF]. Observations this evening.
ReplyDeletehttps://imgur.com/Ker0rNZ
Failed to hold. New low.
DeleteTj can a a leg of triangle of 4th wave overlap 1. Like in fitures at 4 am cst this morning
ReplyDeleteI don't see any relevant overlap, and see the post at 10:14 am. My suggestion is that you use some method to filter your sensitivity relative to a wave count.
DeleteOn OHLC charts, of the correct time-frame sometimes the EMA-13, 34 pair will help do that.
TJ
Nice call on nested 1st and 2nd waves T.J. Every other annalyst I read ( Avi excepted) was decidedly bullish calling for new ATHs, all the while VIX was flying a cautionary flag...
ReplyDeleteThx .. Tachyon.
Delete@JohnnyG .. Ralph Nelson Elliott wrote on the subject of "degree" in his original monograph "The Wave Principle" in 1938. Then, Prechter wrote about it (lightly) in The Elliott Wave Principle in the late 1970's and beyond. Neely wrote about in "Mastering Elliott Wave". If major analysts do not understand degree, they just haven't studied all the material there is.
DeleteI assure you, it's original description is not a "TraderJoe invention".
TJ
Gross disproportion among EW waves of varying degrees always bothered me but since neither Prechter not Elliott talked about it I just did not know what to make of it. T.J. was the first perso I knew to actually explain it from a technical viewpoint and outline exactly how and when it occurs. Most EW analysts, including Avi and Lara routinely ignore this rule. Remarkably, they more often than not get market direction right despite that!
Delete@Tachyon .. they Elliott & Prechter did write about it, Neely too; perhaps just not enough for one to apply it well.
DeleteYou don't have to look too far to figure out that If you don't follow degree violations your whole count goes Kaput. The major EW service Joe calls it, Is EWI-
DeleteRun by Prechter and this clown called as Steve Hohenberg.
They Have always been wrong since year 1999. With the exception of 2007.
Because they don't follow the principles and guidelines of EW theory.
@JohnnyG .. you can watch the first five minutes of this guy's video. Notice how his minute i) and his minute iii) is longer in price and time than his Minor 1 on even the very first chart. Look at how he reaches for 'five-waves-up', and yet today he has to reverse course, where I don't.
Deletehttps://www.youtube.com/watch?v=cQoyFpKpO-U&t=396s
TJ
Excellent- Been saying it and will say it again. You are one of the best.
DeleteTony Caldaro(RIP) needs a mention too IMHO.
@fibo .. thx!, and agree with Tony's dedication.
DeleteThis chart (ES 4-Hr close) shows and adjustment for the correct degree of the local labels since the high only. No change in direction or overall daily count.
ReplyDeletehttps://invst.ly/sme21
TJ
Fyi only ..early advance-decline reading is Adv : Dec = 0,215 to 2,771 or more than 1-to-10. That is in the range of "kick-offs" if it holds.
ReplyDeleteTJ
FYI only .. already there is a 1.618 wave down.
ReplyDeletehttps://invst.ly/sme-u
TJ
If interested, here's a currently applicable [informational] reference.
ReplyDeletehttps://imgur.com/HbIZHZJ
A new post is started for the next day.
ReplyDelete