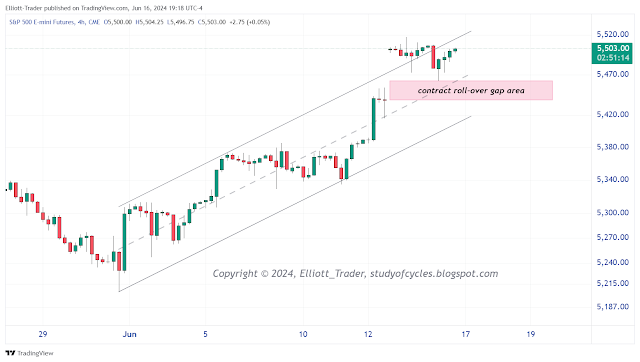
Simply watch the ES 4-hr futures below for either new highs or contract-roll-over gap fill. A complete up count can be counted, but that does not mean that there won't be extensions. There could be, but they are not required.
If the gap fills and the lower channel breaks, we'll have more to say at that time.
Have an excellent rest of the evening and start of a new week.
TraderJoe

Thanks TJ, tomorrow starts a buy back blackout fwiw.
ReplyDeleteIWM looking interesting. After attempting to find support at the gap of May 1st, gap was decisively closed with a gap down. Shape of things to come? Divergences as extreme as I have seen in awhile.
ReplyDeleteES Sep 30-min: here are two equivalent patterns to watch this morning. First on the right is the potential magenta channel upward.
ReplyDeletehttps://www.tradingview.com/x/ebzps8Fh/
The second is the potential expanding diagonal. The pattern is taking a very, very long time in comparison to the prior up wave. This pattern gives a 'clean' invalidation with no guessing.
But I have no issue if the channel pattern plays out. It just creates a more in-synch high. Further, even if the long-in-time diagonal plays out, it has to be watched for 'ending' versus 'leading'.
Caution, patience & flexibility!!
TJ
SPY 30-min: does have a higher high, so into an extension of some type.
ReplyDeletehttps://www.tradingview.com/x/U6E4gaKb/
TJ
ES 1-hr: also has the higher high. Better synch'ing. TJ.
ReplyDeleteSPY 30-min: as far as I can tell, this is a triangle in cash.
ReplyDeletehttps://www.tradingview.com/x/mOuHQRBl/
TJ
Nice thrust out of that triangle.
ReplyDelete5470 to 5500??
In 2000 the Dow÷NDX ratio was about .4650 now it is .5133
ReplyDeleteLet that sink in. Several degrees bigger mania. IMHO
fyi only : ES 5-min: price is now 'parabolic' into 5,550 (steeper and steeper angle of ascent). It is also up against the upper daily Bollinger Band. Parabolic rises usually don't end well. TJ.
ReplyDeleteTypically SWIFTLY returning to point of origin...as a start! Lol! 😊
DeleteThe cash has overthrown the LT trendline. GS says their target is 6300 🎅 me thinks this qualifies as euphoria.
DeleteElections ahead so fed will not allow much correction. Amazing rally from 4103.
ReplyDeletefyi only - SPY 30-min: usual technical-analysis triangle target (widest-width of triangle added to the breakout point), met and slightly exceeded.
ReplyDeletehttps://www.tradingview.com/x/QYYJLkws/
TJ
With all the euphoria talk, does this chart not concern anyone?
ReplyDeletehttps://imgur.com/GXigfxU
150ish candles on the chart.
Well they sold the Dow @40,000 NDX @20,000 but this market is not logical. But yes I would expect a top given Europe,Japan,the Dow,Trans, and about everything else is not joining this party fwiw.
DeleteThe high on the NDX cash 19977
ReplyDeleteFutures 19980..20 points from 20k. NVDA did close down after Fridays 4 hr harami cross. Is the blow of minute wave 5 done?
A new post is started for the next day.
ReplyDeleteTJ