Monday, December 31, 2018

Old Year - Neely Style

I thought it might be helpful as we move into the New Year to have a look back at the last few months as one might if they were analyzing it using some of the techniques pioneered by Elliott analyst, consultant and money manager Glenn Neely. The techniques below are the simple basic ones from his book, Mastering Elliott Wave. I decided to plot each month's significant waves day-by-day plotting the high of the day and the low of the day - in order - depending on which came first. That's why you will see both an A&B data point for each day on the x-axis.

With that, let's have a look at the month of October, 2018.

S&P500 Cash - Daily - High/Low Plotted in Order - October 2018

So, here you can pretty clearly see the contracting leading diagonal minute wave ((i)) as counted in near real time on this blog. The chart doesn't change anything, but it does tend to abstract the wave just a bit. It's very clear in this manner where the "big moves" are, but it's a little harder to see the internal detail. That being the case, let's focus on the most important detail in this chart. That is that wave minuet (iii) is shorter in time than wave minuet (i). As shown, if T1 is the time of minuet (i), then that arrow, copied over, shows that wave minuet (iii) is shorter than (i). T3 is shorter than T1.  It should also be clear to all that wave (v) is shorter than wave (iii) in time, as expected.

Neely terms what we call a contracting diagonal a "1st Extension Impulse". I don't think the renaming is needed. I think it creates more confusion than it helps resolve. He is very clear in the so-named wave that there is overlap between parts of wave two, and wave four. Sounds like a simple diagonal to me!

Now let's move on to the month of November.

S&P500 Cash - Daily - High/Low Plotted in Order - November 2018

In the second chart I have included the most significant lows and highs to serve and an anchor for you to view, so the chart covers a little more than a month. Besides the pretty clear three-wave (w) wave, the other item to note on this chart is that the time signature of the (x) wave is much longer than that of of the (w) wave. So, T2 as shown, is much longer in time than T1. It is not disproportionately so, but it is enough to be noticeable - perhaps about a third more.

The (y) wave is then shorter in time that both the (w) wave and the (x) wave which represents nice time alternation within the correction. Plotted in this manner, the (y) wave failure is clearly noted.

I am focusing on the time signature as we move into the month of December, below.

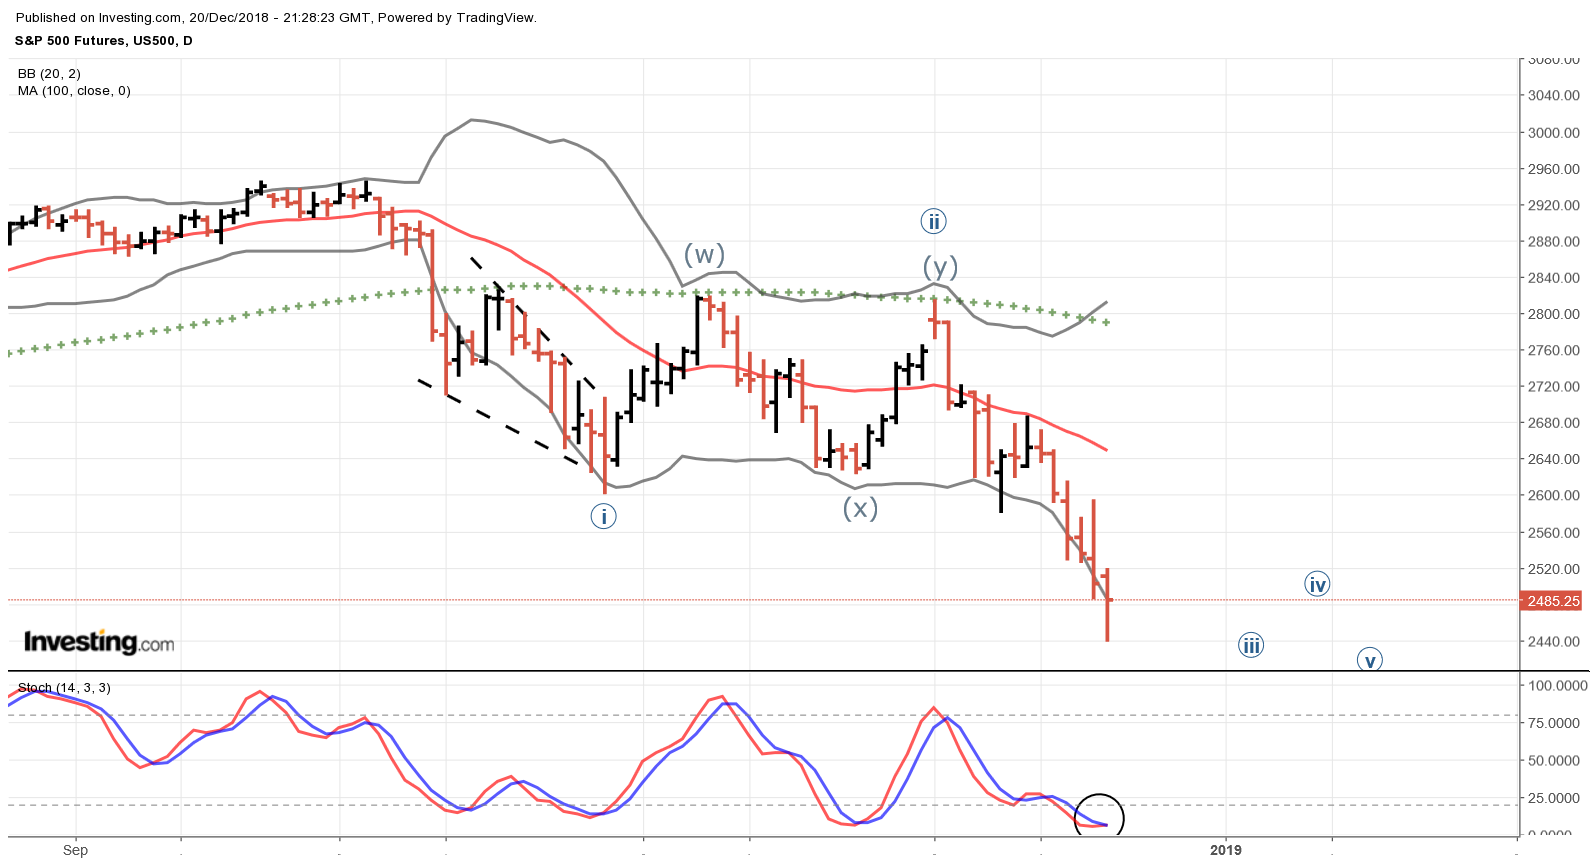
S&P500 Cash - Daily - High/Low Plotted in Order - December 2018

So here we see the most recent data - always the most difficult to deal with  because one doesn't know for sure that a move is over with. But let's focus on two of the time signatures. The first clear result is that wave minuet (iii) of minute ((iii)) is clearly longer in time than wave minuet (i). In other words T3 is clearly longer than T1. That is important. Why? Because it allows us to assess than minuet (iii) may be the extended wave in the sequence - not just by price, but also by time. So, we mark that wave as x (iii) - extended wave (iii) in the sequence.

The next time signature I will leave for you to measure, but, as far as I can tell, wave minuet (iv) is already longer in time than wave minuet (ii). And that is the usual state of affairs in wave counting, is it not? So, at this point, even though the pattern is expanding a bit, there are no overlaps, and we should consider this count as a valid one - provided one thing is true.

That one thing is that minuet (iii) of minute ((iii)) as a sub-wave, must be shorter than all of minute ((i)).

I did that measurement tonight. At the wave that ends at the point of the arrow, it is exactly shorter by two points! Whew! That to me was itself an astounding result. So, either the wave ends at the arrow or wave (iii) ended at the bottom of the wave on 12/20 - and there is a long b wave in a flat - which adds more cushion. Either way, the count works. We also know that level is the 1.618 Fibonacci extension on wave minuet (i) of minute ((iii)).

In Mastering Elliott Wave, on page 5-14, Glen Neely shows a picture much resembling the impulse wave shown in the December chart. The second wave is somewhat shallow, and the fourth wave is deeper in relationship to it - which is already the case. In reality, the pattern is not expanding. What will most likely happen is that wave (v), if it occurs would end roughly parallel to wave (i) once the first line of the parallel is redrawn from waves (ii) to wave (iv) and the parallel copy is placed on wave (i).

We also know, by measurement, that wave (v) will most likely not become the extended wave for the simple reason that at it's current length wave (iii) is as long as degree labeling allows. So, wave (v) should not become longer than it.

Given all of this, we should have some pretty good degree of confidence a full impulse will form. Of course, we'll have to wait to see if it happens.

In the mean time, rest up. Enjoy the celebrations, and have a great start to the New Year!
TraderJoe

Sunday, December 30, 2018

Degree, Fibonacci and Volume

A number of people have been pressing for the short-term hourly count as a matter of some urgency. So, I decided to take a open-eyed view and see if volume would tell us anything. Here is the hourly chart.

S&P500 Cash Index - Hourly - Degree, Fibonacci and Volume

Starting at the upper left, we have the minuet (y) failure, as called in real time, of the minute ((ii)) wave. Then, wave (i) is a diagonal - also as we called it, followed by a zigzag upward for minuet (ii).

The Fibonacci ruler shows there was a 1.618 extension as close as is needed. It is hard to argue with this pure measurement, and the suggestion that it is clearly denoting minuet (iii) of minute ((iii)). As I have noted before, if a decline ended the day after the FED day, then this wave is smaller than minuet (i), and is, now, therefore the likely location of wave sub-minuette i. Thus, this count meets degree labeling requirements. The rest of the count is pretty self-explanatory. It is not a diagonal - just a non-overlapping impulse in a wedge.

I tried to see a way if this idea could be "tested". So, independently of the EWO, I decided to plot volume. Volume spikes typically occur in a third wave. Over on the left, the red volume spike would be in iii of C of i of (i) - not labeled.

Then the rest of this count would put the volume spikes on Micro ((3)) of i, Miniscule -iii inside micro ((5)) of i, and on minuet iii, itself. Then, the volume dries up almost entirely on the holiday wave v. This really seems like an excellent fit, and tends to confirm the count.

So, then the question arises about the hourly EWO being at about -55% instead of -40, it's max guideline. Well, it is a 'guideline' and it is not formally codified into the Elliott Wave rule system. Is it just an over-shoot on the light holiday volume? Not sure.

Next, a review of gaps is similar to that of volume, with the vast majority of them occurring in the third waves,

But, other than derivatives of price and volume (such as oscillators, money flow, etc.) this seems to be about the maximum amount of information the market is willing to give us at this time.

Have an excellent weekend.
TraderJoe

Friday, December 28, 2018

Diagonal Pending

Market Outlook: Likely Long Term Top Identified
Market Indexes: Major U.S. Equity Indexes closed mixed
SPX Candle: Higher High, Higher Low, Lower Close - Spinning Top Candle
FED Posture: Quantitative Tightening (QT)

Make of it what you will, we were able to call a potential diagonal to the top bar today. This fits well with one of the options posted yesterday (#2). Here is the hourly chart of the futures.


ES E-Mini S&P500 Futures - Hourly - Potential Diagonal

There is a triple divergence on the MACD, and there is an hourly bearish engulfing candle to potentially end the pattern. These five overlapping waves up, currently have wave ((5)) shorter than wave ((3)), wave ((3)) shorter than wave ((1)), wave ((4)) shorter than wave ((2)), but wave ((4)) overlapping wave ((1)).

These are all the requirements for a diagonal in a wedge shape - both in price and in time. The "spinning top" candle suggests that if it is confirmed lower, then a retracement, and or lower low might be seen.

In terms of the diagonal, one would like to see wave ((4)) exceeded lower by a few points as this would also create overlap in the cash on it's first wave up.

Usually, most-often, three-wave diagonals (3-3-3-3-3) are ending. IF so, then there should be a lower low in less time than it took to build the diagonal. That lower low - if it occurs - would be minuet (v). As always, diagonals are patterns that must prove themselves. So, remain patient, calm and flexible. The diagonal shows price can move +/-60 points in an hour in the lighter holiday trade!

Have a very good start to your evening and to your weekend.
TraderJoe

Thursday, December 27, 2018

Two Hourly Options

Market Outlook: Likely Long Term Top Identified
Market Indexes: Major U.S. Equity Indexes closed uniformly higher
SPX Candle: Higher High, Lower Low, Higher Close - Trend Candle
FED Posture: Quantitative Tightening (QT)

The primary purposes of tonight's post are to show that 1) a reasonable channel is still being maintained. Usually, most-often, not always, a portion of the third wave is outside of the channel to show where the most momentum was - whether to the upside, or in this case, the down side. 2) to show that the hourly Elliott Wave Oscillator is about where one would expect it four a fourth wave. There are two options for considering this wave. I have no preference at this time. They each have their own strong points.

Option 1


SP500 Cash Index - Hourly - Option 1

The strong points of Option 1 are that wave (iii) would be more than 1.618 x (i); wave (ii) would be much longer in time than wave (i); and waves (ii) and (iv) would alternate. We have no way of knowing that wave (iv) is done. Right now, it is a double zigzag. It 'could' make a triple zigzag without a problem.

Option 2


SP500 Cash Index - Hourly - Option 2

The strong points of the second option are that 1) there maybe a better way to preserve degree labeling in this count, 2) waves (ii) and (iv) would still alternate, and 3) wave (iv) would be longer in time than wave (ii), which is often, though not always, the case.  Here too, wave (iv) does not have to be seen as over. It may be forming a contracting diagonal c wave. The obvious weak point is you really have to stretch to see that b wave.

Clearly, the longest and strongest downward bar is the FED day, and that should likely be seen somewhere in minuet wave (iii) of minute ((iii)).

Have a good start to your evening.
TraderJoe

P.S. Option 3, added after the open the next morning.

SP500 Cash - Hourly - Option 3

In this count, I think sub-wave i just sneaks in under the wire by a few points. Subject to verification.

Wednesday, December 26, 2018

Daily Count Remains on Track

Market Outlook: Likely Long Term Top Identified
Market Indexes: Major U.S. Equity Indexes closed uniformly higher
SPX Candle: Higher High, Lower Low, Higher Close - Outside Reversal Candle Up
FED Posture: Quantitative Tightening (QT)

On Sunday Dec 23rd, we analyzed that a short-term pop could be coming soon based on sentiment (we said to watch to see if a B wave completed. It did not). That pop occurred today to help relieve some of the negative sentiment. The daily count currently remains on track. This morning we analyzed "to the bar" that a contracting diagonal was occurring. Then, we confirmed that the beginning of the diagonal was exceeded in less time than the diagonal took to build - a true diagonal. That almost certainly means a wave series ended at today's low.

And that seems to mean the daily count is as below.

S&P500 Cash - Daily Index - Likely In Minuet (iv)

As long as minuet (i) is not overlapped, it is possible to see this wave as minuet (iv). This is a relatively large up wave, so far. As best we can tell, it has only occurred in three segments - which may not be complete yet. The fourth and fifth waves of a C wave may be needed tomorrow.

If the up wave forms three waves, then it is possible to see this first segment as part of a triangle which may help equalize it's net distance traveled with wave minuet (ii). Of course, a triangle for wave minuet (iv) would have to prove itself in every detail. Just bear in mind that contracting triangles often start with a very violent wave, and today's up wave would certainly fit that bill.

The daily Elliott Wave Oscillator is at a new low for the move, so this should still be signalling a third wave in force. Prices may find some resistance on or near the lower base channel line.

If there is a triangle, then there should be a new low around  the 1.618 Fibonacci level shown, followed by a larger fourth wave, minute ((iv)). All-in-all, this could make for very volatile back-and-forth waves ahead.

As far as I can tell, the market is still doing what it is supposed to. So, we'll have to stay aware of the wave personalities and count as best we can.

Have a good start to the evening.
TraderJoe

Tuesday, December 25, 2018

Short Term Channel

Merry Christmas and Happy Holidays, all! This is the short term channel I referred to in the post script to yesterday's post. So far, these sub-wave lengths can work.

S&P500 Cash - 15 Minutes - Likely Channel
Be good!
TraderJoe

Sunday, December 23, 2018

Potential Short Term Pop?

(Please note there was another post on Sunday, so if you didn't see that one, you may wish to read it.)

In the stock market, sentiment is getting a bit "toasty". Contrary to when I called a potential long term top in the stock market in October - when people were ebullient about the prospect for stocks - now, as the downturn is taking hold, everyone is trying to take credit for calling the top. Common pundits such as Jim Cramer, Peter Schiff and Ron Powell are now calling for a correction, a bear market or even depression-like conditions. In his latest newsletter, Robert Prechter won't even publish a stock market count, taking credit and sitting on laurels, when he was incorrect since April of this year, when an immediate down turn did not materialize, but, instead, we got a new all-time high. So now nearly everyone is board.

Well, not quite. There are still the mutual funds and pension funds that are trying to figure out how to get out of this mess. And there are people who might be jolted by their upcoming 401k statements. But still, the lopsided sentiment can now be seen in this chart of the weekly put call ratio. It is up in an area I have not seen in more than two full years.

Put-Call Ratio - Weekly - Enters "Zone of Despair" Above 1.0


Just as we formerly identified the "Zone of Speculation" near the all-time stock market high, here in this chart we show the "Zone of Despair". People are buying a lot of puts.

If you couple this chart with the one below, it can be seen that the possibility of a stock market pop might be near. Make no mistake. It 'is' in all likelihood a bear market. But, there are 'sharp rallies' in bear markets. They are characteristic. The chart below is the hourly chart that we have been following on this site. What I have been trying to figure out all weekend is the degree violation noted by reader Marc Spungin and I, as prices crossed 2,498 to the upside. That is because the wave is larger than wave iv, of higher degree. This seemed to signal a change in degree about to occur. Maybe it is.

S&P500 Cash Index - Hourly - Degree Change?

From wave (iii) to ((A)), we know that sequence is three waves. So, it could easily be an A:3 wave, up. There was a quick but almost uncountable reverse wave to the down side which might be a B:3 wave. If that is the case, we might expect the C:5 wave upward next to make a wave (iv) as a Flat that would alternate well with with the clear zigzag for wave (ii).

While we don't know that the B:3 wave, down is done (this is being written before the futures open), we should look for that occurrence.

There should be allowance for "five waves up" either as an impulse or in the form of a grinding diagonal, before counting downward again. However, for an impulse wave down in no way should a wave (iv) upward overlap with wave (i) downward.

Best wishes,
TraderJoe

P.S. Chart added after the close. Gap-and-go day. Flat wave (iv) did not materialize. Had to be a flat wave ii, instead, to preserve degree. Ugly stuff. EWO at a new low. And, wave (iii) nearing 1.618 x (i).

S&P500 - Hourly - Still in Wave (iii)

It is possible iii and iv were done today, but it would be more proportional to make a channel down. By measurement, at that location, wave i is less than (i) and preserves wave degree. Being in the iii of (iii) is more commensurate with amounts of point drops being seen.

My Xmas & Holiday Presents

First of all thank you each very much for the wonderful holiday wishes. I truly wish the same for each of you. And rather than just providing a somewhat trite "thanks" in response to each, I thought I would return the gesture in the spirit of giving. Let me explain.

One of the readers, Gerald, wrote in to say that my previously published Dollar Index Count was messed up. (The incorrect chart was the second chart published at this LINK.) He said that according to my own degree wisdom .. lol .. then there is no way the third wave, minuet (iii), could be correct because it was larger than wave minute ((i)), and that, he pointed out, was a degree violation. Oh, he wished me Happy Holidays to boot!

He was correct, and I was wrong. And that is my first gift to you. I will always admit, when - by following the rules - that either my logic, my count and/or my emotions are just plain wrong at the time. Again, I further confirmed to him that since the expected post-pattern behavior of a large scale decline did not occur after wave minute ((v)), that this further indicated why the original count was incorrect.

My second gift to you is to offer congratulations to Gerald, and to all like him - who have been trying to piece together this puzzle of degree labeling - it is hard, tedious and laborious work. And it sometimes conflicts with other sacred wave-counting cows. Please accept that I know what is going on in your minds - for those of that truly care about wave labeling.

My third and Fibonacci final gift to you is to show you what I now think to be the correct count on the U.S. Dollar Index - with proper degree labeling. It also led me to an inescapable and unexpected conclusion. It is one that really twisted my head. I said, "nah, that can't be right - can it?" And that's exactly what proper degree labeling should do. It should set your mind apart from all the other casual analysts looking at the wave.


US Dollar Index Futures - Two Day Chart - Degree Labeling Corrected

Now, in all fairness, our dear Gerald did not off the solution to the problem, but I will try to. The descending order of degrees in this wave labeling is the only way I can see to avoid a significant degree violation. In other words, Minor 1, at the upper right, is larger than minute ((i)), and minute ((i)) is larger than minuet (a) which is larger than sub-minuette i, which is larger than Micro (A). That is just as it should be. You will also note that minute ((ii)) is larger than any other downward wave on the chart.

And since Micro (C) at sub-minuette i is of the same degree as (A), there is 'likely' no degree violation. Remember, a "C" wave is a third-wave, just like a wave three is, and so it can be the sub-divided wave. And I have checked that there are enough internal sub-divisions within this (C) wave to construct it, with each of sub-divisions smaller than (A). Please note for any still skeptical that you can move the wave (B)  over one wavelet to the right at the bottom in mid-April; it would be a "B failure" wave at that point. And then, I am virtually certain the sub-divisions inside of (C) would be the correct length.

Lastly, very early on, it looks like we are getting some of the expected post-pattern behavior with a lead-off "trend line break". Wonderful! Let's see if it develops into a 50 - 62% retrace or more. Certainly the MACD has declined on each peak, and that may mean, "The game is a-foot!" as one of my virtual mentors would say.

Merry Christmas all! And I hope Gerald goes easier on me in the New Year! Obviously just kidding. One of the big reasons I do this is that you all are teaching me many things, too!

Cheers for a bright Holiday Season!
TraderJoe

Friday, December 21, 2018

HouseKeeping Rules - This Blog

Today's post is not about the market. It is about 'you'. One of the reasons I no longer run a web-site of any kind (other than this blog), and one of the reasons I no longer participate in any chat room is because of 'other people'.

Some people are very nice and are willing to see what it takes to count Elliott waves in real time or near real time. Other people only want 1) what they can get for free, or 2) to somehow prove that THEIR count is the one true count at the time.

Some 'good' people on this blog are willing to have a discussion, present a complete thought, and understand why some things follow the rules & why other things break the rules.

The bottom line is this: market participation is a voluntary thing. I don't make buy & sell recommendations, period. I have explained why numerous times. Participation in the comments of this blog is also a voluntary thing. But, it is your 'privilege' to be here; not your 'right'. If you can not conduct yourself with "all due respect" for the other people commenting, let alone me, then your account will be removed from this blog, and you will not be allowed to comment.

It seems odd to say this before the Holiday, but if people can not conduct themselves with some level of decorum, then the comments section will be permanently inactivated. (Those of you with good manners can plug your ears).

The ONLY thing I guarantee you on the blog is there will be short term patterns that don't play out. Most often those are triangles and diagonals - whose measurements must conform in every aspect. There will also be 'fifth wave failures' which may cause you and me to wait for a fourth wave that doesn't happen. There WILL be a flat which is misinterpreted as part of a "running triangle". These things will happen. That is the nature of wave counting. But, it is also true, that by following the rules such missteps will be short-lived in nature. That is also the nature of good wave counting.

If your wave count is so perfect, and doesn't break the rules, and never makes a mistake due to a potentially valid alternate, then you need to start your own wave counting service, and leave this blog for others.

But, most importantly, if you accuse me of doing something, and you are factually incorrect, then you have no place here. I only seek to help educate. If you can not accept that, then you don't belong here. By the nature of education, I can not during the span of a few market hours review everyone's chart who may want it reviewed, especially if they are short term charts. There are simply more of you than there are me.

So go easy people. Have a good holiday, and if you have been more a part of the problem than part of the solution, please consider changing your ways. If you have been a real help, with thoughtful and complete questions then accept my sincere thanks. You are the people that make this worthwhile.

Have a good weekend!
TraderJoe


Thursday, December 20, 2018

Post FED Day

Market Outlook: Likely Long Term Top Identified
Market Indexes: Major U.S. Equity Indexes closed lower; DJUtil Higher
SPX Candle: Lower High, Lower Low, Lower Close -Trend Candle
FED Posture: Quantitative Tightening (QT)

As if to underscore that the market did not like the Federal Reserve decision yesterday the market, as measured by the S&P500 cash index, opened lower, filled the gap but made a lower high, traded significantly lower, and closed lower although off of the lows.

By the futures settlement, with three days in-a-row of both the %K and the %D lines of the slow stochastic indicator closing below the 20 level, this indicator has now technically "embedded". This means until the red line in the indicator panel of the chart below crosses back above the 20 level, the chances to make a retrace to the 18-day SMA are now quite limited.

ES E-Mini S&P500 Futures - Daily - Embedded Slow Stochastic

And after three-days in-a-row of closing outside the lower band, right at the settlement price sneaked inside the lower band. This allows for a reset of the number of consecutive closes. Prices are currently 'riding the band' lower. We asked readers to be on watch for this yesterday. 

The embedded slow stochastic is the most powerful indicator of direction on the chart. 1) The trend is down because of lower lows and lower highs, 2) the bias is down as price remains under the 18-day SMA, and 3) the momentum is down as given the embedded reading.

And while there will be "backing-and-filling" just as there was today a backing off of price (from five waves down that we counted lower in real time, and actually caught the low bar), there is currently nothing friendly to the bulls on the chart. One would have to take out the high of yesterday to even neutralize the trend lower. 

Since yesterday was the outside range day down, today counts as the first day after it that it's high was not taken out. Tomorrow is, thus, the last opportunity to set that so-called "bear trap".

Have a good start to your evening.
TraderJoe

Wednesday, December 19, 2018

FED Day

Market Outlook: Likely Long Term Top Identified
Market Indexes: Major U.S. Equity Indexes closed uniformly lower
SPX Candle: Higher High, Lower Low, Lower Close - Outside Reversal Candle Lower
FED Posture: Quantitative Tightening (QT)

So, if you're a Federal Reserve Chairman, today you might be thinking, "well, that could've gone better". Markets completed the a:3, b:3, c:5 flat for sub-minuette wave ii that we highlighted in the second chart in yesterday's post. Then, they reversed, headed lower and made new lows for the move.

That being the case, it looks like we are in sub-minuette wave iii, lower. 

Today, the DOW both broke below it's wave Minor 4 low, and closed below it. The S&P500 appears to have clearly activated the Head & Shoulders top we showed in the December 15th post, the second chart at this LINK.

There will be backing-and-filling, but this path for the market that we outlined in our December 9th post (also at this LINK), entitled, "A Second Bold Prediction" appears to be on pace. Today broke the lower channel line ever so slightly.


S&P500 Cash - Daily - Down Channel

While we can now count sub-waves until we're silly, the market must simply be allowed to see if it is going to make that 1.618 extension for this wave. And while there will be backing-and-filling that must adhere to degree rules, so far, we have found no sub-waves that have yet violated those principles.

The best daily time-frame observations are these: 1) the market has started to push down on the daily Bollinger Bands. There are two days in-a-row with the slow stochastic under the 20 level. We need to see if remains so tomorrow, as that would mean it would shift to 'embedded' status. 2) Since today was an "outside reversal day down", then the high of today should not be taken out in the next two trading sessions or it will be said "to have set a trap for the bears".

Those are items to watch. Let's see how it goes, as the potential government shut down is the next item on the plate (with the alternative of another continuing resolution to fund it until February.)

Have a good start to the evening.
TraderJoe

Tuesday, December 18, 2018

Down Channel May Breech

Here's an early post today as we get ready for the FED meeting, decision, and post-decision conference - not to mention the holidays.

SPX 15-Minute - Down Channel Can Count as a "Five"

This 15-minute down channel can be counted as a "five wave" sequence due to lack of overlaps, gaps in the third wave, and a fifth wave that equals the first. Today has the potential to breech the channel to the upside.

After close: the down channel did breech to the up side a little bit. But then prices made a new low. So I am posting this longer term chart after the close to keep the wave degrees correct. There have been no degree violations in this count that I can tell.

ES E-Mini S&P500 Futures - 2 Hr Chart - From the Minute ((ii)) Top

From what I can see there is nothing bullish on the chart. If there is a five-wave up wave, it may only be to sub-minuette wave ii - if that didn't end already today. With the slightly lower low, it is possible that it is just the b:3 wave of a flat, but it doesn't have to be.

Have a good start to the day.
TraderJoe

Sunday, December 16, 2018

Potential GOLD Pattern

Note: There was a post on Saturday, too. So, if you haven't see that yet you may wish to view it.

I haven't published much on GOLD recently, but I realize a number of readers follow it quite closely. It's with good reason I haven't published. The internals have been a bit overlapping and confusing. So, I thought I'd wait for some clarity as GOLD bumps up against it's 38.2% retracement of the April to August decline.

The chart below is a four-hour 'close only' chart, and there is a reason for presenting it this way. Again, I would like readers to concentrate on the form, measurements and time signature.

GOLD Futures - 4 Hr - Potential Diagonal

It would help to concentrate first on where the numbered 'five-wave sequences' are. Over on the left, there appears to be a clear five-wave a wave which 'goes nowhere'. That is, this a wave does not break the prior high. Then, there is another clear five-wave c wave up to likely the first wave of a contracting diagonal (i). Parenthetically, one might also note the fifth wave of c of (i) might itself be a small contracting diagonal, as a smaller fractal of the larger pattern.

Next, there is a clear 62% retracement downward - almost to the pip - in a startlingly clear three wave zigzag. Given the exact measurement, this is likely wave (ii).

This is followed by another a, b, c wave sequence up to a shorter wave (iii). And it is then followed by a wave that has already overlapped wave (i), up, in the downward direction. So, it it plausible it could be part of wave (iv) in a diagonal wave.

If wave (iv) forms as a nice zigzag, and there is a subsequent higher high, or near higher high then the potential exists for the proper completion of a diagonal.

Diagonals can be leading or ending. If a fifth wave zigzag forms, and it truncates - does not make a higher high - then almost certainly the pattern would be a contracting ending diagonal. If the fifth wave makes a higher high, then a guessing game begins between ending diagonal - which usually has the higher odds - or a leading diagonal, which is somewhat more rare.

And to focus on the time signature, note that wave (iii) is shorter in time than wave (i). So far, the pattern is fitting nicely in all aspects.

Part of the reason I have posted this chart is so that skeptics and cynics alike can see that using Elliott wave properly to analyze markets is not always like wandering around in the woods with a blind-fold on. Again, the usual caveat that diagonals and triangles are patterns that must prove themselves in every detail. Let's see how the pattern plays out. So, as always, patience, flexibility and calm will best help to analyze this market, too.

Have a good rest of the weekend.
TraderJoe

Saturday, December 15, 2018

Spooky Action at a Distance?

This blog is about the stock market and wave counting, so please bear with this brief introduction.

Albert Einstein famously once railed against the new quantum physics model of the atom when it predicted that electrons could become 'entangled' and exhibit properties that seemed to require faster than light communication across vast distances, or that electrons could 'jump' between atomic orbitals in 'no time' - traversing a space or an energy level without actually passing through the distance or passing through the distance in 'zero time'. Further, the suggestion that electrons could pass across a physical barrier and just appear on the other side of it (in an effect known as tunneling) would have been profoundly troubling to him - if experienced in his time - as well.

Some of these apparently irrational, but yet observed, effects are now known to be due to the shared wave & particle (or 'dual nature') of the electron. Want to cause an electron to 'jump' energy levels in an instant? Just change it's wave 'shape' to one requiring more energy, and don't think of it as a particle at the time. Want to get an electron on the other side of a physical barrier? Just make the barrier thin enough so part of an electron's wave is on the other side of the barrier, and presto, there is now a probability of the electron mysteriously on the other side of the barrier - just don't think of it as a particle at the time.

While such effects might seem odd or arcane, much of modern life is literally built on knowing what is going on here. The transistor, the transistor radio, cell phones, televisions, modern electronic computer circuits, and even GPS depend on these effects. Further, present-day experiments are showing some degree of entanglement can occur on larger scales than originally thought. (See the brief article at this LINK.)

Clearly, these are mind-bending phenomenon for us as humans to consider. We are making progress, but it is slow. Einstein had some of the answers - but not all of them. And progress has been made. And certainly, we are becoming very good at using these effects - whether we understand them fully or not.

So, too, in the stock market. We will pose two questions for you. The first question is quite simple.

Elliott Impulse Wave Where Wave 3 is Shorter Than Wave 1

Given the diagram above, in an Elliott Impulse wave - where wave 3 is shorter than wave 1 - just how does that wave 5 know to be shorter than wave 3?

I mean what is this, predestination or something? Or are the waves 'in communication' with one or another? Or is there a mysterious man named Oz sitting behind a smoky curtain at the stock exchange pulling just the right levers that cause this to happen? Yet, there are example after example where the above is true enough and can be seen.  So how does it happen? Inquiring minds want to know.

If that first example isn't puzzling enough, here is a bit more complicated one but one that you can see today. Below is a picture of the stock market, year-to-date.

SPY S&P500 Stock Index ETF - Year To Date

Whether or not this pattern gets 'activated' by trading below the neck line of the pattern, please tell me how the stock market knew to trace out this partial or complete diagram of a near-perfect head & shoulders pattern - just as it is described in Edwards & Magee.

Note that the two shoulders shown here are almost exactly the same height.  How did that happen? And notice that the volume dipped in the left shoulder, rose on the decline to the neck, and then volume all but dried up in the head formation. Further, volume increased again on the decline from the head to the neck - just as described - before volume fell off again on the right shoulder.

Again, whether this pattern activates to the downside, or whether is another larger right shoulder to make to match up with the even larger left shoulder remains an open item. The question is, "who or what is drawing such patterns?" Is it you? It's not me. How does such a pattern know to form?

It is a very good thing that - so far - we don't have to know every detail of the mechanism in order to put it's possible implications to use. But - just like serious physicists - serious market students may have something to learn by asking such questions.

Have a great weekend.
TraderJoe


Friday, December 14, 2018

Count - 2

Market Outlook: Likely Long Term Top Identified
Market Indexes: Major U.S. Equity Indexes closed uniformly lower
SPX Candle: Lower High, Lower Low, Lower Close - Trend Candle
FED Posture: Quantitative Tightening (QT)

Yesterday's chart was predictive of today's down move. That is the very purpose behind the exercise of Elliott Wave counting. Sometimes it is predictive - other times like when in the midst of corrections it is less so. With that in mind, let's again display the ES 2-hour chart.

ES E-Mini S&P500 - 2 Hours - Channel

So far, the channel is working well to constrain prices. But, even though there was a substantial decrease in prices, you can see for yourself the down bars do not have the individual impulsivity of the initial bars lower.

So, a lot will be dependent on the gap direction on Monday, and any subsequent follow-through. If the gap is lower with lower follow-through, then it becomes possible we are in sub-minuet i of minuet (iii), lower.

But, if there is a small gap down and reversal, and prices climb up over the declining trend line, we must allow that today's down movement is only a three-wave b wave. With a c:5 wave up yet to follow. The purpose of such a wave would be to make minuet (ii) longer in time than minuet (i). That is common, and it would be OK with me if that occurs.

The market, as measured by the S&P500 cash index came within 0.10 of that 90% level downward. That should be close enough for all intents-and-purposes, but it could also make the 90% level on Monday.

In this kind of environment, it helps not to be too dogmatic or to have too many expectations. In that light, we need to let the market speak here in the short run. So patience, flexibility and calm remain the by-words of the time.

Have a good start to your evening and to your weekend!
TraderJoe

Thursday, December 13, 2018

Count

Market Outlook: Likely Long Term Top Identified
Market Indexes: Major U.S. Equity Indexes closed mixed
SPX Candle: Lower High, Lower Low, Lower Close - Trend Candle
FED Posture: Quantitative Tightening (QT)

Thanks to Erik B. from the group we were discussing wave counts with here on line. He pointed out a degree violation at wave w below, which meant that we have revised slightly only the position of where the minuet (i) is on the chart. We were trying to count the flat. It did not work this morning, as the downward wave got too long in time and in price. The degree violation is that w is larger than ii, and could not be a sub-wave of a c wave, up. Good job, Erik!

The chart we are showing below is the ES 2-hour futures because your eyes can accept it better. 


ES 2-Hour Futures - Leading Diagonal Minuet (i) Down


In cash, there is also this possibility, but also the possibility of an 'expanding diagonal' down to the same location. Talk about ambiguous! In any event, the wave is still in a channel.  Today, 'ground and ground' lower.

Time to be on one's toes and be calm, flexible and patient. So far, things are adding up well as we adjust slightly.

Have a good evening.
TraderJoe

Wednesday, December 12, 2018

Count and Best Alternate - 2

Market Outlook: Likely Long Term Top Identified
Market Indexes: Major U.S. Equity Indexes closed higher; DJUtil lower
SPX Candle: Higher High, Higher Low, Higher Close - Yin-Yang Candle
FED Posture: Quantitative Tightening (QT)

If you have been following our blog, you know that we have counted wave minuet (i), down, and are trying to count minuet (ii), up. Based on the position of the Elliott Wave Oscillator on the fifteen minute chart, this is the best count at this time. However, risks of an incorrect count are exceptionally high in this wave. Anything could happen - including a government shut down. Therefore, we are posting the current count, and showing the best alternate in red.


S&P500 Cash Index - 15 Minute Chart - Potential Ending Diagonal


Today, we noted that the potential wave ((3)) has a lower high on the Elliott Wave Oscillator (EWO) and has made only a marginal new high. But still, it was a high enough high to suggest an uptrend. Prices broke down to the nearest 15-minute candle at wave ((3)), with it being approximately as long as wave ((1)). 

And if wave ((4)) is in place, or nearly so, then it is shorter in price and time than wave ((2)). A Fibonacci ruler shows that if ((5)) is just less than ((3)), it can crest over wave a, and avoid a truncation. Avoiding a truncation does not have to happen. The upward wave can fail, and must be allowed to fail.

Only because of the near equality in time between waves ((3)), and ((1)), and the fact that we are not yet out to the apex of a wedge, we are showing the alternate that wave ((1)) may have crested at today's high, with the other prior waves as just a zigzag of the new first wave. They are a little ambiguous. If wave ((1)) only occurred today, then a lower low would likely drive the EWO lower. So far, it has held well - near zero - for the diagonal signature in the main count. Also, there did appear to be a running triangle as wave B in today's wave ((4)), and that make have put the brakes on that wave.

And that remains why patience, calm and flexibility remain the by-words.

Have a good start to your evening.
TraderJoe

Tuesday, December 11, 2018

Count and Best Alternate

Market Outlook: Likely Long Term Top Identified
Market Indexes: Major U.S. Equity Indexes closed lower; DJTrans, NDX/NQ Higher
SPX Candle: Higher High, Higher Low, Lower Close - Yin-Yang Candle
FED Posture: Quantitative Tightening (QT)

If you have been following our blog, you know that we have counted wave minuet (i), down, and are trying to count minuet (ii), up. Based on the position of the Elliott Wave Oscillator on the fifteen minute chart, this is the best count at this time. However, risks of an incorrect count are exceptionally high in this wave. Anything could happen - including a government shut down. Therefore, we are posting the current count, and the best alternate at this time.


SP500 15-Minute - Ending Diagonal c wave of (ii)

For the count in the chart above, the B wave should try to hold along the up trend line, and there should be a higher high tomorrow. Overall, the above count is to an ending diagonal c wave to finish a flat for wave (ii)

Now, the best alternate.


SP500 15-Minute - Y wave Failure

The chart above is the alternate because too many legs of the triangle would be as yet undetermined. Failure to make a higher high than (a) tomorrow would be telling, as would a (b) wave below today's low.

These are valid alternates, provided the (e) wave of the triangle closes above wave (i); the wave it is trying to correct. Remember, wave (ii) is never a triangle in it's entirety, and that is just what this chart shows. The triangle would only be the y wave of a complex correction.

The alternate would suggest the market is extremely weak, and might present another failure because of the potential power of a large third wave down yet to come.

Stay patient, flexible and calm. This is the hard part of the work!
Have a good start to your evening,
TraderJoe