Here is an update of the ES 30-min chart. Let's see if a five-wave structure completes or not.

Have a good start to the day and week.
TraderJoe
Here is an update of the ES 30-min chart. Let's see if a five-wave structure completes or not.
Have a good start to the day and week.
TraderJoe
The primary intraday chart we use is the ES 30-min for wave counting purposes. A look at the chart below from today's session shows some reasons why.

Notice how much of today's wave was made in the after-hours. It is astonishing what doesn't show up in the cash market (except as a gap, of course). Prices appeared to have made three waves up so far. Possibly because of the summer-doldrums, the market - while basically positive today - still only made an inside day and didn't answer any good questions yet. The retrace to the high was a 78% wave to an incredible fit and wave iii/c can be seen to be a Fibonacci 2 x i/a.
As a result, the chart is left in a bit of limbo. The Principle of Equivalence tells us that, "a,b,c is i,ii,iii until it is not". So, with an upward extension on Monday/Tuesday, it is certainly possible to go over the high again with a iv, v.
But other counts are possible too including a downward diagonal to make a larger fourth wave, and a sideways triangle to just waste more time.
So, again, patience and flexibility are still needed until the market gets ready to make a bigger statement.
Have a good start to the evening and the weekend.
TraderJoe
Looking at today's ES 4-Hr chart below provides 1) alternation, as we described before, and 2) a minimum flat wave which can now realistically be a fourth wave, iv, or more to the down side.

So here are some notes: If this is correct, then wave iv is already longer in time than wave ii at 36 bars vs 31 bars. In the ES futures, the prior low at Ⓐ was exceeded lower. This is what a flat wave typically does.
Price can easily head down to the channel, and or test it however. It hasn't yet. If the channel largely holds, then a fifth wave, v, might well make a new high possibly with a v = i or more.
On the daily chart, there is an outside reversal bar, lower, but the embedded status of the daily slow stochastic has not yet been lost using the regular calculation. Further, in terms of retracement levels, wave iv is 23.6% of wave iii but it is not yet 38.2% of wave iii which is more typical.
Of course, one needs to monitor the 4,500 level for any potential overlap with wave i. It will be difficult to draw any more conclusions until we see how this channel works out.
Have an excellent start to the evening,
TraderJoe
The cash SPY index went over the prior local high. The ES 4-hr futures came to well-within 90% of the prior high (more like 98%) and might go over the high on earnings reports, although it is not required to. Here is the ES 4-Hr chart again.

In any case, alternation has likely been obtained with the sharp second wave, and a trip to the lower parallel might result. If it does, be careful to watch for any overlap warnings.
This is also just a reminder that tomorrow's economic reports bring new home sales in the morning and the FOMC report & press conference in the afternoon. Thursday is Durable Goods, Initial Claims for Unemployment and the Advance GDP report. Then Friday brings the PCE Prices index. So, there will be a lot to chew on.
Have a good start to the evening,
TraderJoe
So, right on. The YouTubers and Twitter'ers (X'ers?) want you to Like & Subscribe (..and donate!!??) so they can make money off of you. It's my preference people just learn the wave counting rules and struggle a little bit so they are forced to develop the wave-counting muscles for themselves. Here is the ES 4-hr chart.

Again, we haven't even come down to the 4-Hr channel yet, let alone the daily channel. Hopefully, we will at some point as the EWO with 118 candles on this time-frame has come back down to within the needed +10% to -40%, touching the zero line today. Still the count above says some type of alternation may be seen yet. That means it is 'possible' to go over the high again. The location of the overlap warning has been provided.
The odds of a interim top are going to bounce-around here a bit as the market works through its topping process.
The daily ES futures made a small outside day up and this rescued the daily slow stochastic on that index from losing its embedded status. So, this, too says a new local high is possible.
Have an excellent start to the evening and the week.
TraderJoe
Keeping in mind that this is not a solicitation to buy or sell anything, there is one very cogent count we could possibly see in the ES futures daily chart for a top. We only rate the odds though as 60:40. First, let's explain the count from the ES daily line chart, below.

There is a memorable line from The Elliott Wave Principle by Frost and Prechter that goes like this, "Draw line from the start of A to end of B, and place a parallel copy on the end of A. This often shows the location of the C wave." We have done that above.
And when we do so, we notice a count that we can suggest as "diagonal for A, (truncated) Flat for B, and impulse for C." That winds up being excellent alternation in a corrective count. The slight truncation in the B wave presages the rip-roaring C wave impulse to follow. Well, what about the odds assessment?
First, there is an RSI divergence on the high. That's a positive. Second, the waves are confined to a channel. That's a positive. And third, currently C is shy of 1.618 x A, and that's a mild positive. It would be better if C and A were nearer equality.
But the negatives that detract from a near-perfect score are 1) the weekly up wave is over 78%. It would have been better if closer to 62%, 2) some stocks - like AAPL - are up over their previous weekly high, and 3) there is no confirmation wave lower in terms of a faster wave down that undercuts a recent fourth wave.
Barring such a confirmation, barring trading down below the parallel channel, back-testing the lower channel line and failing the back-test, we remain open-minded, calm and flexible. We can see this as a very good possibility - and can even assign some odds because of the elements that work. But we can also see other good possibilities - such as that a new high is made a part of an overall ending diagonal wave V, or that a 90% wave is made to the upside (NDX is only 60 points away), and a larger monthly Flat develops.
I have termed it the Principle of Equivalence in Elliott Wave, and stated it as, "A,B,C is 1,2,3 until it is not." The Principle keeps me flexible and watching for confirmation until it occurs. And, yes, there are some broken trend lines and topping tails among the Magnificent Seven. But, there are other internal parallel trend channels that can still be drawn which are not broken. I'm watching those, as well.
Many people don't understand probability all that well. An awful lot can happen with 40% odds. It is a slight edge only. And it's something to watch. Many, many days in the stock market, you can see something with only 5% probability happen as a regularity: that is closing above or below the upper or lower daily Bollinger Band. We refer to it often. So be mindful of that, and again that has only about 5% odds of it happening.
Have an excellent start to your evening and to your weekend.
TraderJoe
Well four of seven. Four of the Magnificent Seven. This is just a visual review to show where some of the weakness came from today. It might be useful to draw some daily trend lines and see which have broken and which have not.

Have an excellent start to the evening.
TraderJoe
A simple post today. It might be worthwhile checking in on the overnight tonight, as today we got a Doji candle on lower volume for the SPY. This is a candle of indecision. The SPY daily chart is below.

From the intraday time frames (5 - 15 min) in SPY, there are ways to start the counts for an impulse lower followed by an expanded flat, as the high was not exceeded today. Or there are elements of a sideways triangle, if there were only three waves down instead of the expanded flat. Since there was a higher high initially today, it might also be possible to count as a diagonal, either upward or downward. I'm not kidding. Just being honest. So, we need some waves with some length to better determine the count.
I will also add briefly with the higher closing and weekly high on the DJIA (YM) futures, it is now also possible to count the Dow in this manner, depending on whether the Dow's last diagonal holds or not.

Interested analysts should work out the details on an OHLC chart for the exercise in this A,B,C count from the low.
Have a good start to the evening.
TraderJoe
After an initial 62% retrace, lower, from wave (i) it is now possible to count the DJIA Futures (YM) as this following diagonal.

Such a count may not be completed yet, but there is one way to see it as there or very nearly there and to follow the rules for such a pattern. It has been a long, long wait to see this pattern unfold. We will still be patient to see if the post-pattern behavior is what should be expected. The alternate pattern, if not, is a series of nested (i), (ii), i, ii ..
Have an excellent rest of the day and evening.
TraderJoe
Any number of calls went out on social media this week for "The Top". An analysis below (and my analysis from Friday) shows that a local top is certainly possible. My Elliott Wave count currently has this prior wave up as ⓒ wave of a b wave, as shown on the ES daily chart below.

But first we must note where the current daily parallel is. Price has not even had enough downward movement to get the EMA-13 to cross under the EMA-34. Next, we note if an impulse up is being counted, then certainly wave (iv) could take as much time as its companion wave (ii) did. It is nowhere near there yet, being allowed 26 days - if not longer - because, after all, it could be a fourth wave.
Next, we note based on The Fourth Wave Conundrum there are still ways price could go over the top again. For example, a triangle could form for a fourth wave meaning the low in wave (iv) has already occurred. And certainly, while not a lot of evidence exists for it yet, an ending diagonal could form. There could be only the first wave or the third wave of such a diagonal with the current three waves up. And that might mean price can go over the top again.
Still, the most common form of correction is a flat wave back down to the parallel. And while a move from say 4550 to 4300-4350 might seem like devastation, and a good move to be aware of, it just might not spell the end of the move yet from a timing perspective.
Be careful. Be patient, calm and flexible, and have a good start to the week,
TraderJoe
Like a child that won't stand for its security blanket to be temporarily taken away, the stock market bucked and screamed and hollered for another overnight session, and then retreated some. In doing so, it did three important things. 1) it temporarily took out the 'wave-counting-stop' we posted yesterday, and closed back below it again today, 2) it stayed inside of b-3 = 1.618 x a-3, and 3) it made the largest down wave since this potential Ⓒ wave began. Here is the ES hourly chart.
e |
| ES Futures - 1 Hr - Wave ⓒ |
As we pointed out in the comments for the prior post, there was a second spot of RSI divergence with the high made today. The most recent up wave since the low on the 10th was a mess to count starting off with a possible diagonal, and including a sub-wave fifth of wave ③ of x iii that went almost entirely sideways before the CPI report.
The wave did include measurements that showed wave iii at 1.618 x wave i, and wave v that stayed less than the extended third wave and came in at v = 78.6 x iii.
Towards the end of the day, the blue lower up trend line was broken and a likely diagonal downward was completed in good form. The down wave made this afternoon was larger in price that either waves ii or iv, previously. Therefore, there is some reason to believe that there could be a change of degree.
Have an excellent start to the evening and to the weekend.
TraderJoe
ES prices again hit the upper Bollinger Band today. Yesterday, we said that a "b" wave could go up to the 138.2% level. Today it did. These are the measurements we show today on the same ES 4-Hr chart as yesterday.
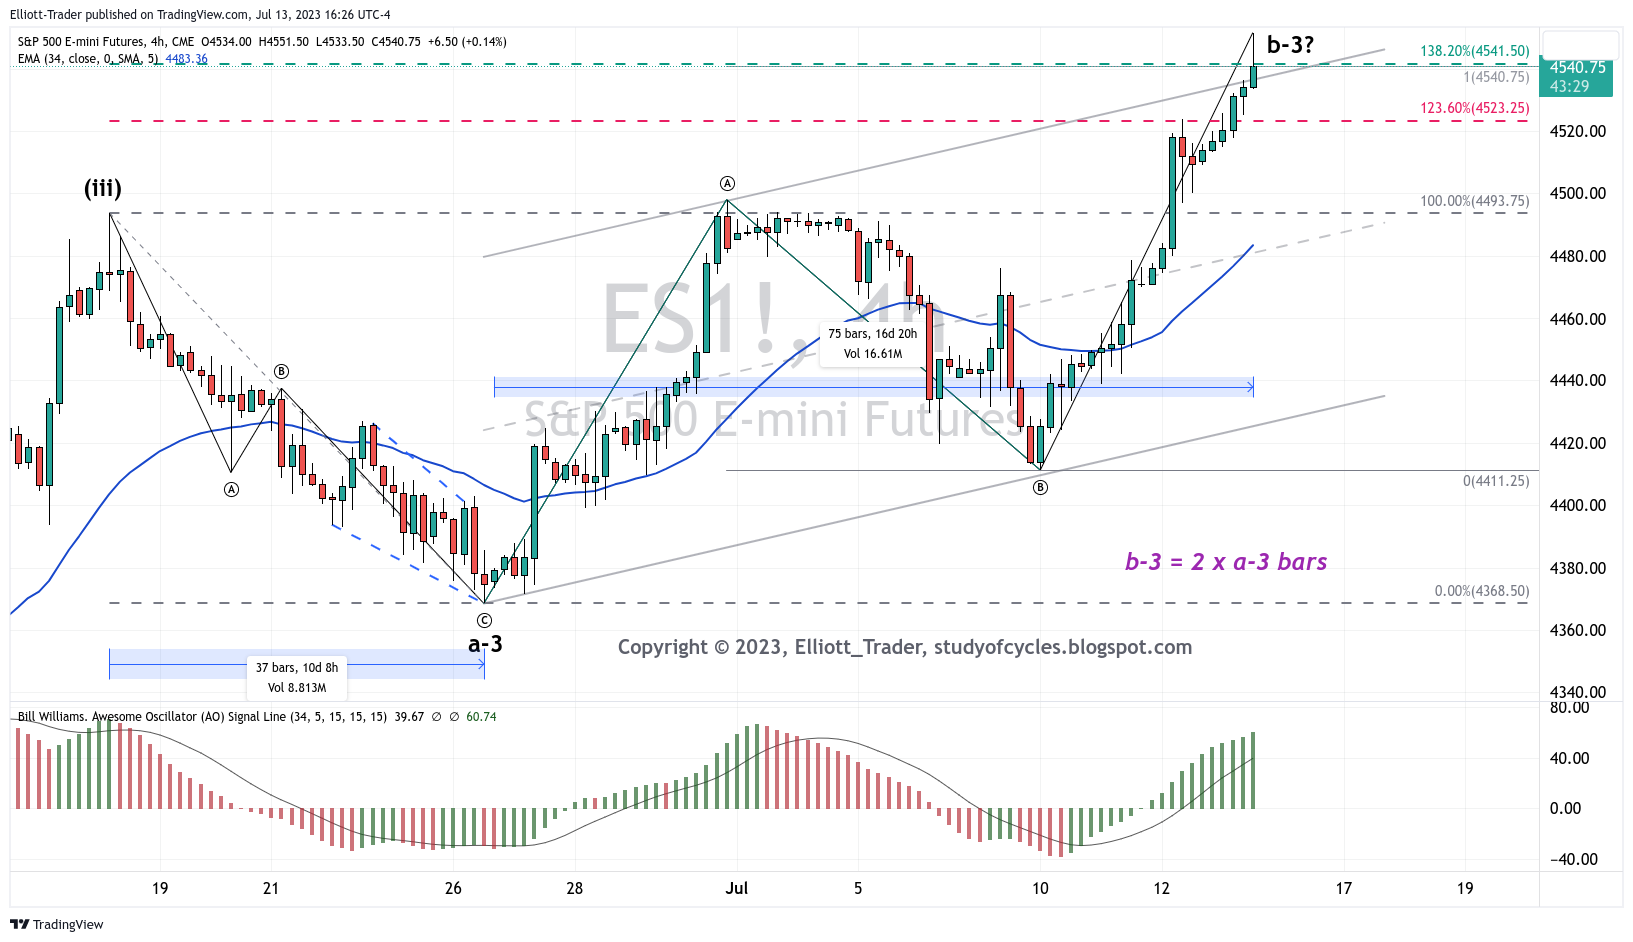 |
| ES Futures - 4 Hr - Potential b-3 wave |
In terms of Price:
b-3 = 138.2% x a-3
within b-3, Ⓒ = Ⓐ
In terms of Time
a-3 = 37 bars; b-3 = 75 bars; ratio : b-3 = 2 x a-3 in time.
In terms of momentum:
b-3 diverges on the EWO from (iii).
None of these, of course, proves anything but a series of measurements can indicate higher probability. For this reason, a wave-counting-stop is being placed at today's high.
Have an excellent start to the evening,
TraderJoe
Or Strike the Up Band. The daily ES futures contract traveled to the upper daily Bollinger Band today on a lot of machine-driven trading. Then, as if by magic some of the Smart Money appeared to be taking some profits at that level. On the ES 4-hour intraday chart, here are the measurements we have to offer.
 |
| ES Futures - 4 Hr - Channel |
We made three-waves down to a likely a-3 wave. That seems proved by the new highs. If we are making a b-3 wave up, it is currently 123.6% x a-3, with a possible further target of 138.2% of same. This currently fits the parameters of a b-3 wave very well, including the potential channel that "B" waves often travel in.
After today's high which occurred in a wedge that we called to the bar, there was some downside movement but it is still unconvincing. Yet, striking that band urges for calm, patience and flexibility.
The alternate at this point is a contracting diagonal but it doesn't fit well here just yet.
Have a good start to the evening.
TraderJoe
The daily Bollinger Bands are narrowing. Price changes are whippy. The CPI report is tomorrow morning. Some future brokers changed margin requirements prior to notification today which changed the character of the last hour. As a result, that prior high of 4,476 on the swing line indicator was exceeded higher, leaving a condition of "no-trend" for the moment in that indicator.

A 38.2% downward retracement of the prior wave (iii) has not occurred yet. It doesn't have to. A sideways triangle or an upward sloping diagonal wave could be made but any such structures would still be incomplete.
But then again, the Elliott Wave Oscillator is not yet down within the limits of a typical fourth wave (+10% to -40% of the prior third wave peak). And that also allows the continuing possibility of a flat fourth wave.
Have a good start to the evening.
TraderJoe
The ES futures put in a lower low in the overnight pricing. SPY cash did that on the first bar of the open. So, the ES daily chart below, has a lower high and lower low on the swing line indicator.
 |
| ES Futures - Daily - Lower Low |
The low traveled below the 18-day SMA, but price closed above the same thus nullifying any signal from the swing line trend, as yet. There was an attempt to make a 62% retrace, but price missed it so far by about 10 points. However, a 50% retrace was obtained.
To better validate any down trend, price needs to stay below the prior 4476 peak, and then close below the 18-day line in the sand. If 4,476 is exceeded first, a pattern of lower lows and lower highs would not be made.
Have an excellent start to the evening.
TraderJoe
Forget about the Magnificent Seven. Let's look at the Magnificent One - AAPL. One question this chart answers is, "How long can a stock stay overbought?" As the RSI on this yearly chart shows, "Years, apparently!".
 |
| AAPL - Yearly - Diagonal & Channel |
As APPL approaches the $200 range we can also note that from its 1982 low to its 2003 low is a remarkable Fibonacci 21 years in time. But we also note from this 2003 low to a 2024 high would also be another remarkable Fibonacci 21 years.
After starting with an expanding diagonal, likely for a first wave ①), there has been a Fibonacci 2 times rise - based on log charting - and price is again headed for the upper channel line in what is probably still wave ③. At some point the vaunted stock will begin at least a wave ④ and might head back towards the lower channel line. Then, a move back to $30 - 50 does not seem unreasonable based on the log channel shown.
If, at some point, this should happen, the question is what would happen to U.S. stock indexes because this darling is such a large part of almost every equity manager's portfolio. Maybe not today. Some day soon? It depends what your definition of soon is.
Meanwhile, let's look at the weekly chart of APPL. Here we see a similar up channel in arithmetic scale.
 |
| AAPL - Weekly - Recently Overbought But No Divergence |
APPL's weekly RSI has gone overbought in the last few weeks. But, as the channel indicates, a move back down to the $170 to $180 range could happen at any time without doing structural damage to the parallel. We just note there is no divergence yet at the high on this chart.
Yet, typically, an Elliott Wave move ends with a 'five-wave-sequence', even if the five waves are part of a larger C wave, or even if the fifth wave fails. Noting there is no solid evidence yet for even a Minor 4th wave, it does not seem reasonable yet to suggest an ending diagonal for this stock. There just isn't downward movement enough to support such a conclusion at this time.
But now it is at least time (meaning from now to within a few weeks/months) to get our antennae up to look for a fourth wave, at least. And what happens if one goes down to the daily price chart, as below?
 |
| AAPL - Daily - Recently Overbought But No Divergence |
Here again we see some prominent features. There are recently both a parallel channel and two over-bought locations of the RSI (at the down arrows). This is suggestive of both a first and a third minute wave on the daily time frame. And it looks like a minute fourth wave has begun, as we've suggested for both the NQ and the ES futures. AAPL's recent up gap has been filled which is one lone suggestion of a loss of momentum. But, as yet a fourth wave looks incomplete as it would be very short in time.
Still, based on the parallel, there seems to be no reason why APPL couldn't eventually reach a $200 price, perhaps on earnings, and that would be telling for all three price time frames. Considering price has recently been as high as $194+ this does not seem like a huge stretch for The Magnificent One.
What the rest of the market does (sectors that don't contain AAPL stock) is a different matter.
On a separate note, the high yield bond ETF (HYG) hasn't made a higher weekly high since September 2021. And it has recently broken it's daily up trend line lower. Here is the chart being referred to.
 |
| HYG (High Yield Bond ETF) - Daily - Break of Up Trend Line |
Hmm.
Have an excellent rest of the weekend.
TraderJoe
A new higher daily high was not made in the NQ daily futures, as the daily chart below shows. But, pretty close. Intraday, the NQ futures made a local higher high, but the ES futures did not. And now the NQ futures have downward overlap. This suggests (but does not prove) that the wave is likely a b wave.
 |
| NQ Futures - Daily - EWO dropping |
It is also possible to count the ES futures as only three-waves-up to its local high. Let's see if the daily EWO wants to come back towards the zero line.
Have an excellent start to the day and recall the Payroll Employment Report is tomorrow.
TraderJoe
The cash market is not open yet, but, so far, the ES 2-Hr chart is still in range of a micro-④th wave. The Elliott Wave Oscillator is also showing typical fourth wave characteristics at this time. Note, it can go a bit further if it wants, but, if it goes too far, the immediate alternate would be a truncation at the high. As you might expect, the fourth wave incorporates a lot of time spent in exceptionally low volume trading over the holiday.
 |
| ES Futures - 2 Hr Close - Fourth Wave Possible |
Remember, the FED FOMC Minutes are scheduled to come out later today (14:00 ET), and the Payroll report on Friday.
Have an excellent start to the day and short week.
TraderJoe
In it's simplest terms, The Principle of Equivalence as I have stated it says that, "A,B,C is 1,2,3 until it is not". The power of this principle in wave counting is that it requires a recognizable fourth and fifth wave to make a completed impulse as distinct from a simpler zigzag. Below are weekly line charts of the ES futures closing values. They show this principle on the weekly chart.
This first chart (shown as Part 1) may be a fairly simple zigzag wave within the parallel channel shown as the dashed lines.
 |
| ES Futures - Weekly - Zigzag Interpretation |
At this point, even recognizing that our state of knowledge is such that we can not claim upward price movement is over, the fit to a weekly parallel is remarkable. In other words, there are easy ways to claim that a c wave can result in a higher wave if a more expanded flat is made for a fourth wave of the c wave. What is suspicious however, is that the lower boundary of the parallel is above the 4,200 level where the closing chart might avoid overlap if a much larger downward wave takes over.
To keep it simple, the next chart (shown as Part 2) demonstrates how the three waves could become more.
 |
| ES Futures - Weekly - Impulsing Interpretation |
The further the wave proceeds higher, the more the third wave likeliness increases, and the higher the lower boundary of the parallel channel moves.
The Principle of Equivalence is one reason The Eight-Fold-Path-Method was developed - to try to help determine differences between impulses and simple zigzags. The Eight-Fold-Path-Method is the featured post in this blog and appears in the upper right-hand corner of the main page.
Some of the characteristics of true extended third waves are 1) they tend to travel above the upper parallel, 2) they often (not always) reach to 1.618 times the first wave or more, 3) they have a large central gap in the middle of the wave on the cash chart, 4) they often have a peak of momentum on the smaller degree third wave within the larger degree third wave, and have an initial momentum divergence on the smaller degree fifth wave of the larger third wave, and 5) they sometimes show the power to break through prior market resistance points to the upside or support points to the downside, and this comes from the fact that their initial retraces usually, most-often, exceed 50% in depth of the initial first wave. So, they have a good base for larger movement.
Some, but not all, of these characteristics are seen in this latter chart above. A key question is whether further of these characteristics will develop or not. Right now, from OHLC charts that show the extreme values, one thing we can say that the two up waves (depending on which terminal points are picked for the analysis) are approximately the same length. This is more characteristic of the zigzag scenario, but requires the analyst to assume that the upward trend is over.
The upcoming week will help determine if that changes or not. And, if it changes, by how much. As such, it is still a reason to remain patient, flexible and cautious as the market traces out its very whippy structures near the prior resistance and prior highs.
This is the second post this weekend, and if you have not seen the first one, yet, you may wish to. Have an excellent rest of the weekend.
Looking at the longer-term monthly chart of the Dow futures (YM), it suggests that this pattern simply can't be ruled out at this time. This would be the classic "too far, too fast" pattern of the contracting ending diagonal in the Dow. We have not had an ending diagonal in the Dow or S&P 500 since 2015 & 2016. So a Fibonacci eight years later might be the right time to suggest it again.
 |
| Dow (YM) Futures - Monthly Close - Potential Diagonal |
Please note the chart does not connote extreme bullishness on my part at this time. For example, I can easily see how a short term decline could occur as a deeper b wave. However, one thing this chart does having going for it is that all of the Primary numbered waves ➀, ➂, and ➄ would be taking place over the prior wave III high to express their motive character, and that is how Elliott originally envisioned it.
One thing not to like about the pattern is that wave ➁ did not reach down to the 62% level, so that would be a caution but does not break any rules.
A reason to favor the count, if wave Primary ➂ occurs, then it would most likely be on a divergence from the Elliott Wave oscillator as is most often the case in the contracting variety of diagonal. Another reason is that most trading - whether to the upside or downside - feels like the grinding that occurs inside of a diagonal or a triangle.
This count is short-term optimistic as it sees marginal new highs in equity markets. But it is longer-term much more pessimistic as the drop from a diagonal implies a major shift in equity market behavior.
And I do want to caution all readers that I can still see ways the market could drop lower in the short run, particularly to make that deeper wave ➁, but those likely require breaking the dotted up trend line shown from 2020 to 2023, and that just hasn't happened yet. Until it does, we look for waves that fit the facts.
Have an excellent rest of the weekend.
TraderJoe