ES prices again hit the upper Bollinger Band today. Yesterday, we said that a "b" wave could go up to the 138.2% level. Today it did. These are the measurements we show today on the same ES 4-Hr chart as yesterday.
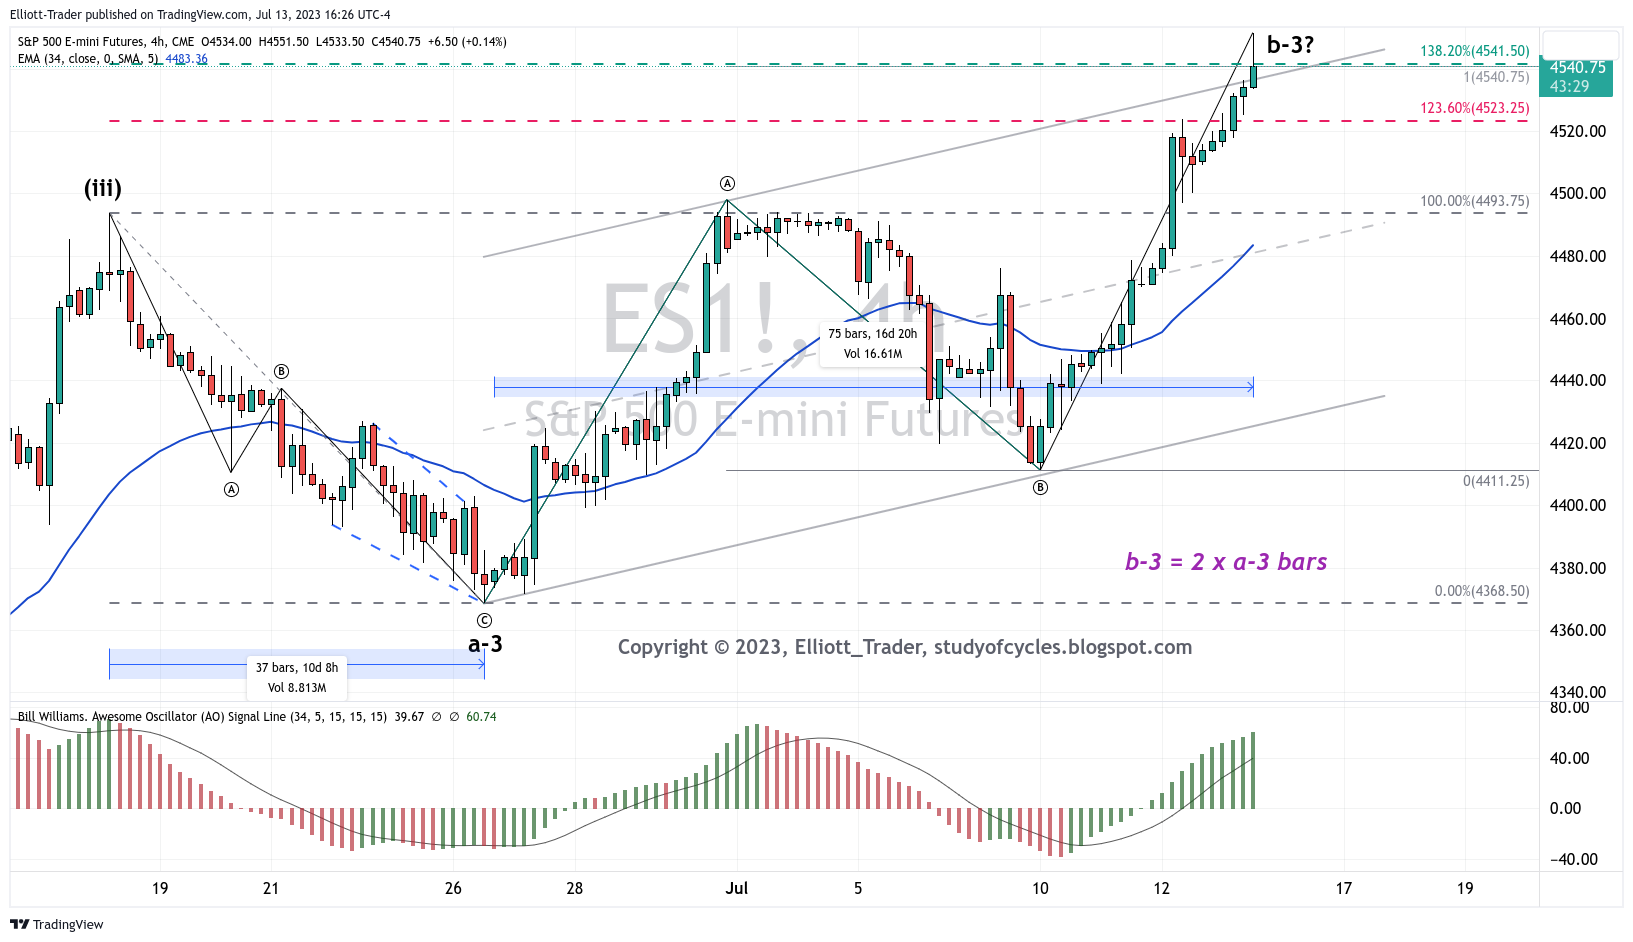 |
| ES Futures - 4 Hr - Potential b-3 wave |
In terms of Price:
b-3 = 138.2% x a-3
within b-3, Ⓒ = Ⓐ
In terms of Time
a-3 = 37 bars; b-3 = 75 bars; ratio : b-3 = 2 x a-3 in time.
In terms of momentum:
b-3 diverges on the EWO from (iii).
None of these, of course, proves anything but a series of measurements can indicate higher probability. For this reason, a wave-counting-stop is being placed at today's high.
Have an excellent start to the evening,
TraderJoe
Current sentiment also matches the "phony" nature of b waves! For example, the put-call ratio.
ReplyDeleteJPM earnings tomorrow, they almost never miss but it seems like Jamie has been trying to prep people for bad news.
ReplyDeleteLol! The big five are all INSOLVENT! Only the most in-attentive could possibly be un-aware of that dire reality!
ReplyDeleteWhat do you mean?
DeleteThe assigned value of assets in their books do not reflect the true price as they are no longer required to "mark to market". The rapid rise in interest rates has decimated their bond holdings. Capital ratio is negative. SVB was forced to sell to meet withdrawals. Inevitable coming bank runs will expose the others as well. The public seems blissfully unaware.
Deleteso the "big five" are the banks?
DeleteThanks TJ, can you please pull your long term chart and count ? Markets at 4500 and in near future once interest rate goes down, 4800 will be crossed in no time. Already 1000 points from 3491 to 4500.
ReplyDeletegot it..https://studyofcycles.blogspot.com/2023/07/the-principle-of-equivalence-daily.html?m=1
Deletenice reversal on the XLF and KRE - banks completely out of the markets mind these past few weeks
ReplyDeleteES 1-Hr: another divergent RSI high slightly above yesterday's wave-counting-stop.
ReplyDeletehttps://www.tradingview.com/x/ykFICYLn/
TJ
There were some gamma squeezes yesterday, e.g. in NVDA. That stuff should unwind this afternoon.
ReplyDeleteAlso: AMD, MSFT, TSLA. & maybe AMZN (but strong Prime Days results too)
DeleteES 1-Hr: a few more measurements. IF wave iii is the extended wave in the sequence - shown by x- it is 1.618 x i. And wave v = 0.786 x iii. So, at this point wave v is shorter than iii. If wave i is a diagonal, this is the best I can do with the count at this time. There are no guarantees, just increasing probabilities.
ReplyDeletehttps://www.tradingview.com/x/MeATT4He/
And, if the bearish engulfing candle is to be meaningful, there should be a significant lower close candle following it.
TJ
ES 1-Hr: so far only an a-b-c down, and then upward overlap and break of trend line. This suggests the way down is by diagonal, or the way up is by triangle or further impulse. Nothing conclusive yet. TJ.
ReplyDeleteThe lower low argues more for a diagonal than a triangle. TJ.
DeleteLooks like an acceptable contracting diagonal which argues for monitoring the high-of-day.TJ.
DeleteHere is what that diagonal looks like. Price and time signatures are spot on.
Deletehttps://www.tradingview.com/x/9PHyc0rp/
Diagonal might be leading. Even if so, there could still be a 'deep retrace' so watch the high-of-day on Monday/Tuesday.
TJ
P.S. Just hard to show the -a, -b within ④ but it does only look like three waves, as well. TJ.
DeleteA new post is started for the next day.
ReplyDeleteTJ