Friday, August 30, 2019

Inverted Hammer

U.S. Debt Clock: $22.55 Trillion
ES Daily Candle: Higher High, Higher Low, Lower Close: Inverted Hammer Candle
Market Posture: Neutral and Probing Waves
Daily Swing Line: Up (Higher Low, Higher High)
Daily Bias: Up (Settle Over 18-day SMA)

The wave labels have been left off of the daily chart, below, for a reason. They will be published in a weekend video. Today's candle is called a weak inverted hammer because it did not close clearly red. As with most candle-stick patterns a confirming daily lower close candle is needed to suggest the end of an upward count.

ES - Daily - Inverted Hammer

Prices traded much higher in the evening. They tried to hit the upper daily Bollinger Band, but did not. We were able to count a completed impulse, upward from the August 28th low. (See yesterday's comments). Then prices traded all the way back down to tag the 100-day SMA before bouncing into the close. As you can see from the Fibonacci ruler on the side, prices briefly traded above the 62% retracement level, and then closed below it. From the August 26th low, one can count three-waves up.

The daily Bollinger Bands are traveling sideways at this time, and the daily slow stochastic is currently in over-bought territory. I hope to have more for you later in the weekend.

For now, have a good start to your weekend, and/or holiday!
TraderJoe

Thursday, August 29, 2019

How Good Counting Adds Flexibility

U.S. Debt Clock: $22.55 Trillion
ES Daily Candle: Higher High, Higher Low, Higher Close: Trend Candle
Market Posture: Neutral and Probing Waves
Daily Swing Line: Up (Higher Low, Higher High)
Daily Bias: Up (Settle Over 18-day SMA)

Yesterday, we counted out an exacting diagonal on the five-minute chart. We did not call it an ending diagonal for a reason. Near the center of a chart such a structure can wind up being a leading diagonal. And, as the ES 15-minute chart, below, shows, it was! Recognizing that fact can help prevent some big mistakes.

ES 15-Minute - Position of Yesterday's Diagonal was Leading

It is nice to have an example to show particularly those newer to Elliott Wave, that not all diagonals are the "death knell" they often hear that they are. Sometimes, instead - as in this case - they are "the wind up before the pitch" or the leading variety of diagonal. Remember that leading diagonals may only be in the 1 or A wave positions on a chart.

Today was a powerful third wave that followed the diagonal. The chart above shows the market poised to make a fourth wave, but it hasn't yet. At today's ES settlement, with 119 candles on the chart - well within the recommended range of 120 to 160 from The Eight Fold Path Method - the Elliott Wave Oscillator is nearing the zero line again. Wave ((3)) of iii is on a peak of the EWO, and wave ((5)) of iii is on a divergence. So, right now, the wave fits an impulse, but it has not yet followed through with the needed form. If there is a drop in the overnight, or at least a running triangle followed by a fifth wave, then that fifth wave should occur on a divergence with the peak EWO.

Yesterday, I said if the market makes a higher high then it opens up several options. We have covered some of them before, but will I recap them in light of recent pricing on the weekend.  Again, it is not a problem so much in wave counting at this time as it is matching up the wave count to the money flows and news cycle here in the middle of the wave.

This is again a reminder that tomorrow is the last day of the trading month - with a propensity towards "window dressing" and some of the sloppiness that entails. Then, Monday/Tuesday will be the first trading days of the month with the likelihood of inflows from pension funds, 401k's, company bonuses, dividend reinvestment plans, etc. Oh, and  this first of the month will be the first of the month of September, which, in a study from 1950 to 2018, has the largest negative seasonality of any individual month overall. (Past performance is not necessarily predictive of future results.)

Have a good start to the evening - or to your long weekend if you are in the U.S. or otherwise celebrating the holiday or a vacation.

TraderJoe

Wednesday, August 28, 2019

An Exact Count with Two Interpretations

U.S. Debt Clock: $22.54 Trillion
ES Daily Candle: Higher High, Higher Low, Higher Close: Yin-Yang Candle
Market Posture: Neutral-to-Negative and Probing Waves
Daily Swing Line: Neutral (set up for either higher or lower)
Daily Bias: Down (Settle Under 18-day SMA) for fourth day

Today we counted upward this exacting diagonal structure on the ES five-minute chart and posted it in real time. First, here's the chart as it was shown at 03:22 PM ET today.

ES - 5 min - Diagonal

We chose  this count because any other would not respect the 0 - 2 trend line off the low. In other words, if you draw a line from 0 - b, it would cut off a third wave if you tried to call that the third wave. Also, in the futures - not in cash - there is an overlap with the down wave at 11:00 and what is labeled the a wave up. Then, in the after hours, price began to move lower after a near-equal retrace of the highs. But, it was enough to say that wave ((4)) can not be misplaced - because a downward wave would now be longer than wave ((2)) which is not allowed in a diagonal.

But, here's the problem: the very same wave structure can either be a leading diagonal or an ending diagonal! If it is an ending diagonal, then we proposed a plan for that in yesterday's comments. Let me provide a reminder.

ES - 2 Hr - Declining Trend Line Broke Upward

We said yesterday that for a wave ii location to be where it was shown, the dotted magenta trend line would have to hold. It did not. There's no "fudging it", no "only slightly over it". It just didn't hold plain and simple.

If there is a big gap down tonight (not saying there will be) and the low of alt: x is taken out, then we also posted that the downward structure could be a much larger diagonal which I sketched out in real time and you can find at this LINK.

But if the shorter-term diagonal is leading, then a number of upward counts is possible. Why such seeming indecision? It should be clear by now, it is not a problem with wave counting methodology. When a person can chart a wave to the 5-minute bar, then the method is pretty much spot on. No, as you can see from the chart, below, we are still doing battle at "the line in the sand", at the 18-day SMA, touching it again today. The Bollinger Bands are narrowing in. People are on vacation. We are in the middle of a price range. Pricing is both whippy and choppy.

ES - Daily - Close Near 18-day SMA

There is nothing sacred about a wave count when one recognizes the larger context. So, each day will be examined for what it is until there is some additional clarity.

Have a good start to your evening.
TraderJoe

Tuesday, August 27, 2019

Battle at the Line-in-the-Sand

U.S. Debt Clock: $22.54 Trillion
ES Daily Candle: Higher High, Higher Low, Lower Close: Neutral Candle
Market Posture: Neutral-to-Negative and Probing Waves
Daily Swing Line: Neutral (Lower Low, Higher High)
Daily Bias: Down (Settle Under 18-day SMA) for third day

First, let's finish with yesterday's chart for consistency. As anticipated, prices traded higher in the overnight, then opened higher this morning and traded marginally higher for about 30-minutes, then began to sell off.

ES - 120 Minutes - Second Wave


The up waves are best interpreted as an ((A)) wave, up, and a barrier triangle for a ((B)) wave - based on degree - followed by a ((C)) wave to the new high. After today's high, we counted five waves down in a channel, with good form, using The Eight-Fold Path Method. IF today's high is a second wave, then the dotted magenta line down from the previous high should hold. If the bottom is not exceeded relatively soon (days), then the best alternate is that a second wave might extend as a double zigzag, so a lower low below ((B)) that does not break the wave i low might only be an alternate x wave. But, right now, the EWO signature is that of a second wave, having retreated most of the way to the zero line.

Next, let's go back to the daily chart.

ES - Daily - Battle at the 18-Day

Prices briefly exceeded the 18-day SMA and tried valiantly to reach the 100-day SMA but could not do it. Then, they were turned down by the 18-day SMA as well, and closed lower. This is what was called "having a battle at the 18-day SMA". So far, the downside forces are winning a bit. The daily slow stochastic has turned lower, and as long as that remains the case - from a wave counting view - it should be respected.

Have a good start to the evening.
TraderJoe


Monday, August 26, 2019

Nothing Broke

U.S. Debt Clock: $22.54 Trillion
ES Daily Candle: Lower High, Lower Low, Higher Close: Neutral Candle
Market Posture: Neutral-to-Negative and Probing Waves
Daily Swing Line: Lower (Lower High, Lower Low)
Daily Bias: Down (Settle Under 18-day SMA)

While nothing "broke" by the rules today, let's fix it anyway. The cash S&P 500 index chart on the 15-minute basis really is no longer "looking" like a proportional fourth wave - even though it measures OK at the close.

And because of the overnight futures waves which keep being both 1) dramatic, and 2) invisible in the cash markets, it seems like this is the better downward count.

ES - 2 Hr - Diagonal and First Wave Down

Even at the ((A)) wave up this morning, the futures were very near the 62% retracement level. And, there are now more up bars to ii than down bars to i.

So, if the count is correct, then there is an Ending Diagonal at the high. I did call the truncation at the (c) wave on the 1-minute chart. But other readers of the blog suggested the ending diagonal - which is longer in time - and then a completed first wave down to last night's overnight low. I have suggested before that counting the cash market is getting to almost be a fruitless exercise. This is another example.

The main reason for showing this chart is that if there is a true ending diagonal at the high, then the low of the (b) wave must be taken out in less time than the diagonal took to form. And looking at brokerage quotes for the ES, it already has been - although you would never know it from the above chart! I did confirm it using a second source of reliable quotes before writing this post, but this is a real caution for those using the "free" tools: they have the potential to fake one out (even though they didn't me, this time).

So let's see how this goes: neutral, flexible, patient and probing.
Have a good start to the evening,
TraderJoe

Sunday, August 25, 2019

Weekend Video - Steps to Confirming an Impulse Wave

Here is a weekend video report than I hope some of you (particularly the less experienced at wave counting) will find useful. Again, to be respectful of your time and mine, the video has been limited to about four (4) minutes.


I might also note that a gap down on Sunday that back-fills on early Monday might be part of the b:3 wave of a flat. Let's see how it goes.

Thanks for watching and have a very good rest of the weekend.
TraderJoe

Friday, August 23, 2019

Powell Snores, China Roars

U.S. Debt Clock: $22.53 Trillion
S&P500 Candle: Lower High, Lower Low: Trend Candle
Market Posture: Neutral-to-Negative and Probing Waves
Swing Line: Neutral (Higher High, Lower Low)
Bias: Down

If FED Chairman Powell's speech at Jackson Hole was meant to inspire today, it certainly didn't. Steve Leisman from CNBC almost fell asleep summarizing it. That, and some announced retaliation by China in terms of tariffs, sent the market reeling today. Price broke through the 100-day SMA and then the 18-day SMA and kept on going. In doing so, prices filled the futures gap (black circle at the arrow) we said could fill relatively quickly because futures gaps are just not as persistent as cash gaps. We will remove further reference to that gap from future charts.

ES - Daily - Lower Daily Low

While the swing line is confused, today we eliminated the alternate labels on the chart. A more than 2.618 wave was made in the downward direction on the cash 15-minute chart, and that means we should err on the side of a third wave. The bias of price is to the downside again, being below the moving averages. Further, if downside movement continues, the lower Bollinger Band would be a good initial target for the move. The moving averages have crossed over - as we noted yesterday - and today price is confirming the bear cross with lower prices.

The w-x-y failed double zigzag also counts like a good example of a second wave. It found a barrier at the 62% retracement and simply was not able to penetrate it. It tried hard even into last night, still reflecting the caution in the count, but it could not do it. The second wave (ii) is also nicely longer in time than (i), and the Bollinger Bands are now crashing down below the prior high - which should give the bulls some pause. The daily slow stochastic was in over-bought territory and, although it has not rolled over as of the futures settlement, if it does, it would likely confirm the lower daily high.

Any price movement below the x wave would also provide more confirmation of a top. One final reminder: Art Cashin likes to say, "stocks rarely bottom on a Friday".

Have a good start to the weekend.
TraderJoe

Thursday, August 22, 2019

Will Powell find Another Towel ?

U.S. Debt Clock: $22.53 Trillion
S&P500 Candle: Spinning Top
Market Posture: Neutral and Probing Waves
Swing Line: Up (Higher High, Higher Low)
Bias: Up

Tomorrow the U.S. Federal Reserve and other central bankers will supposedly provide more clarity on the state of monetary policy probably in a more global context. Of course, if you can believe any thing a central banker says, "good luck". Remember just a few short months ago when the FED said that "the balance sheet roll-off would continue on auto-pilot", or then, later, when they said, "It would end in September", and then later when they said, "No, no. It will end in August!".

Yesterday, we said there was no compelling reason to end a count on yesterday's bars. That statement was proved correct today with a higher high day. A spinning top candle requires a confirming candle lower.

ES - Daily - Higher High Day

So, the daily chart is quite neutral as we head into the Jackson Hole Summit. Prices originally popped higher. Still they did not exceed the 2,944 high of 13-Aug. After the marginal higher high, prices then reversed in five waves down from 2,940 to 2,904, yes, some 36 points, when they met the combination of the 18-day SMA and the 100-day SMA around 11:00 AM (ET) and found near-term support. 

Prices then made a near-exact 78.6% retrace to 2,932 before falling off approximately 10 points near the close to 2,922.

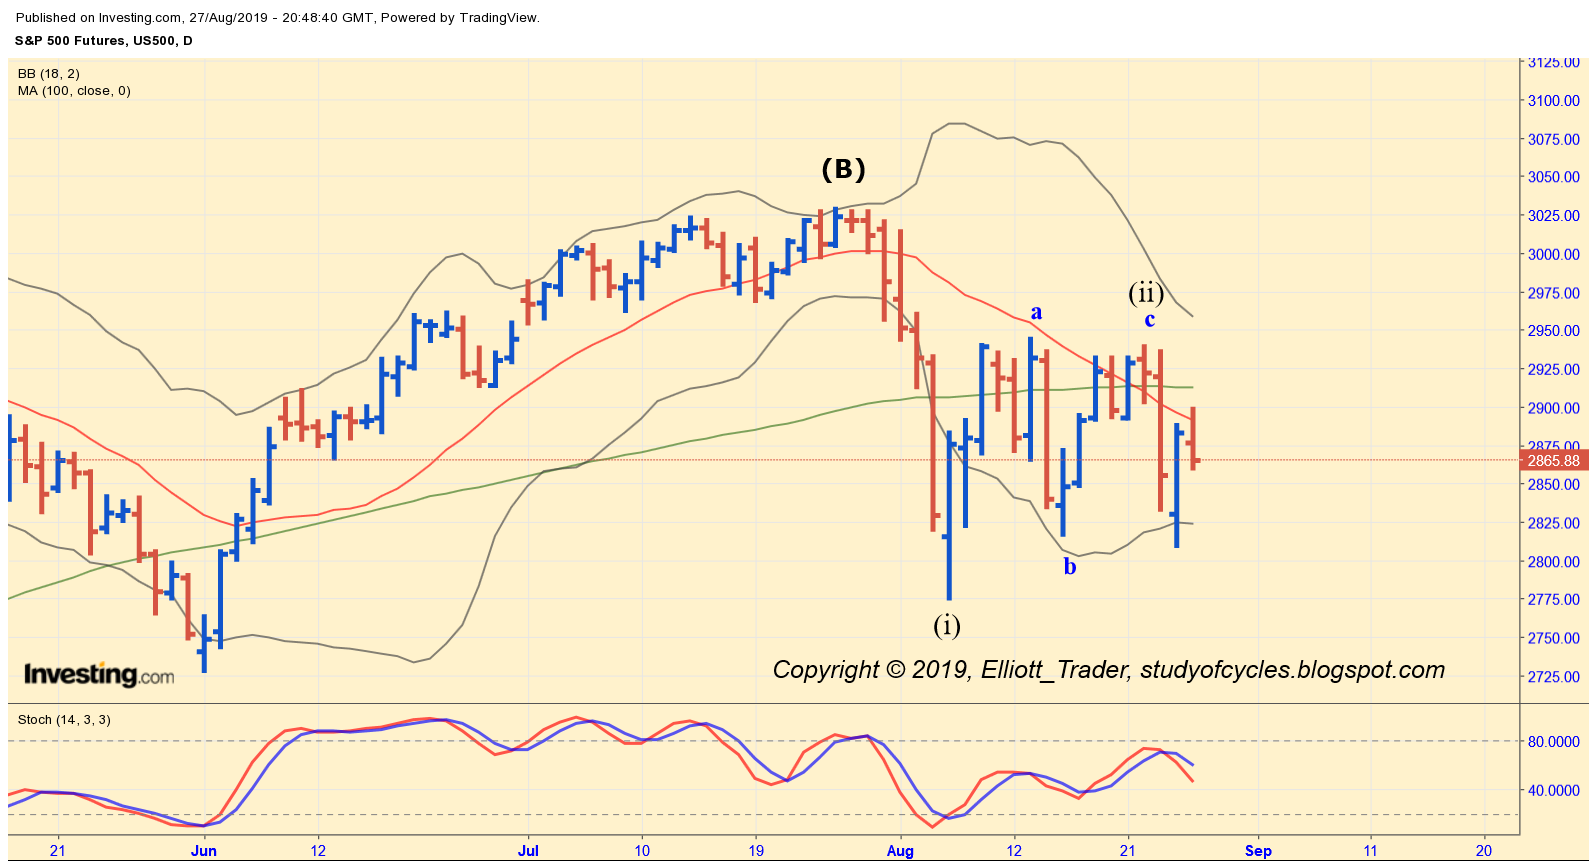
There is now one way to count the wave (ii), above as complete. Two of us found it independently, and it can be interpreted to be a contracting ending diagonal as of today's high. However, the bias of prices remains up, and the swing-line is up even though there was a clear five-waves down made this morning. So, the chart is still fighting with itself (please don't blame your local Elliott analyst: we don't make the waves, we just try to count them). As further sign of the fight, the 18-day SMA has indeed crossed below the 100-day SMA, although this is usually better validated by prices trading below the moving averages, not above them as they are now.

Today we called the 78.6% retrace a retrace to a "Wave Counting Stop" or a warning about the intraday count. That level is often associated with "B" waves, so it might mean that a diagonal is still continuing or is in progress, and in this case "either" higher or lower. Here was today's intraday chart. The five waves down are on the left.

ES - 5-Minutes - c = 1.272 x a?

Then, it is clear there was a choppy wave sequence higher which we could not count as an impulse. Near the end of the day the wave measured c = 1.272 x a, which is a common measurement for a failure wave, before prices fell off below wave .iv at the end of the session. They have still not yet overlapped the a wave, but the blue .i wave has been overlapped.

So, the five waves down make the chart somewhat compelling, but a lower daily low, especially with a close back below the 18-day and 100-day SMA would provide improved confirmation. Why such caution? There is the potential of major news tomorrow - or it could be a "snooze conference" just as well. But, a lot of 78.6% waves have busted higher or been only part of upward diagonals etc. And, there are still ways to count upward. And, as well, the first five waves down with a 78.6% deep retrace could also just be part of a diagonal, downward to start a wave sequence, lower. 

For this reason, patience, calm and a probing mentality might well serve the wave counting studies the most at this time.

Have an excellent start to your evening.
TraderJoe


Wednesday, August 21, 2019

Re-testing 62%

Prices as measured by ES E-Mini S&P500 futures reversed again today and closed higher. In doing so, they closed over the 18-day and 100-day SMA's and turned the short term bias to the upside again, but not the swing-line just yet. We must remain neutral and flexible as difficult as that is.

ES - Daily - Back to 62%

Prices have thus reset back to the 62% Fibonacci level for all intents and purposes. If they fail in this general vicinity, for which there is not good evidence at this time, that would be one thing. On the other hand, if prices proceed to the 78.6% Fibonacci level, then it is just possible they could make the triangle we outlined in the previous post (see LINK here).

Unfortunately, this results in only a contingent market count (or some of you might like the term 'situational' market count better). This means the count develops as the situation proceeds: IF this, THEN that.

This posture is unfortunately required when the evidence is poor, or two possibilities with roughly equal odds can be envisioned. Stock futures settled at the high-of-the-day, but did not make a new recovery high. The new recovery high is needed to turn the swing-line higher.

Prices could proceed higher to make a (b) wave in the alternate count that is longer in time than the (a) wave. There is nothing wrong with that. But, they might also stall in this area or make an ending diagonal c wave of (ii) waiting on the FED's Jackson Hole speech on Friday.

So, in the summer heat, play it cool. There are lots of market participants that are still on vacations both here and in Europe. For me, personally, that means keeping risk very small indeed, and only probing some positions to better ascertain the count until the volume returns and momentum picks a direction. There is no reason stocks are required to top in the next couple of days. They could, but they don't have to. The wave count just is not compelling yet, although the possibility is there. I'm being flexible, calm and patient in wave counting - as best I can.

Have a good start to the evening.
TraderJoe

Tuesday, August 20, 2019

Not an Especially Good Sign

It was not an especially good sign for higher prices that the ES E-Mini S&P500 futures made an equal or higher high (regular e-mini's or micro?) in the overnight and then fell off below both the 18-day SMA (line in the sand) and the 100-day SMA. Thus, the bias is down. There are lower highs but higher lows on the chart.

ES - Daily - Turned Back by 18-SMA

If price continues lower, then it is highly possible for the 18-day to cross under the 100-day which has not happened in several months. Many technicians who watch such things would consider that as a negative. That situation has occurred in Crude Oil futures, and in the Dow futures. It has not yet occurred in the NASDAQ 100 (NQ) futures. 

The up gap from yesterday's overnight jump has not filled yet. We'll let you know if it does. At this time - if further downside movement occurs - the peak to the farthest right would be wave (ii) so as to preserve the 0 - (ii) trend line guideline that has worked so well in the past.

At this point, upward counting would only resume with a full-on higher high day. Should that occur, there is an odd way a triangle could be made out of these waves, but such a triangle would be better proportioned with a higher high to the 78.6% level of the drop to the current wave (i). Therefore, as an alternate, that triangle will not be counted unless there is a higher high day.

Have an excellent start to the evening.
TraderJoe

Monday, August 19, 2019

Gap Up to 18-Day SMA

The so-called "Smart Money", the funds and banks with accounts large enough to move markets, saw a "slow news weekend", and gapped even the ES futures up to start the week (red circle). Prices hit the 18-day SMA (red curve), and promptly stalled for the remainder of the day.

ES - Daily - Gap Up to 18-Day SMA

In doing so, prices also gapped above the 100-day SMA (green curve). Prices traded between the 100-day and the 18-day SMA's for the bulk of the cash session. Futures gaps tend to get filled a bit more quickly than cash gaps. The last such one that filled is shown as the black circle and it was called out in real time when it filled.

With today's up move, it became less likely that a (i)-(ii)-i-ii move, downward, occurred. That is because a line drawn from the top to (ii) would now cut off part of wave (iii), lower. However, it could be that wave (ii) is just becoming more complex and is extending in time. This up move has already consumed more daily bars than the down move, so, it should be corrective.

We'll provide more detail on the count once we see if we get a "turn-around Tuesday" or not.

Have a good start to the week.
TraderJoe

Wednesday, August 14, 2019

Best at this Time

I posted this count earlier in the day in the comments section. Yesterday, I had posted that a larger triangle was 'possible' with the up wave on the tariff news. Today, that counts looks a lot less likely. It is not impossible, but I am not counting upward until or unless there is a higher high day.

ES E-Mini S&P500 Futures - 4 Hr - Downward Count

The count is based on 1) the location of the 0.618 retracement, 2) the lower low today, and 3) the Treasury Dept branding of China as a "currency manipulator" which made the (v)th wave down on the night of Aug 5th - 6th.

The futures kept falling in the after-market to close on the lows. So far, there is not even sign of retracement. I was looking for a good reversal candle with follow-through that stuck. There was only one reversal candle today (hourly or better), and there was no confirmation candle.

People have criticized the turn-about in short-term outlook. Go ahead. Gripe all you care to. I said a larger triangle was 'possible', not for certain; not even "highly likely". Today the poor German GDP took the wind out of the sails overnight. So. So far, we have 1) Hong Kong problems, 2) German GDP problems, 3) Deutch Bank laying off 18,000 people and creating a "bad bank" to house problem assets, and 4) maybe problems in Italy. It looks like the problems are creeping in from overseas again. Beyond that, everyone knows that U.S. debt is exploding with $1 Trillion deficits, and the U.S. Debt clock now over $22.5 Trillion. 

All of you who read this blog know I have been looking to count a top. This Intermediate (B) wave has been among the most challenging to count I have ever encountered. Several of the waves can be interpreted multiple ways. That is the nature of almost all B waves. As I said before, I am not with the people counting an Intermediate (4)th wave, or an Intermediate (5) of a Primary Vth wave, or a Primary III wave. Let's see what those web-sites have to say for themselves this weekend - if anything.

As far as the griping. I can handle quite a bit of it. I recognize a B wave for what it is: a very hard to count wave. So, if you want to make fun of me - good-natured or not, then have at it. Some times I laugh, too, at what the market does. But, then again, if you keep it up without offering suggestions for improvement or your very own brand of "magic methodology", then you might expect this blog to take a new approach.

New Approach?

That's right. There is no reason why comments on this blog can't be held in a "pending queue" waiting for moderation. I'll read each one of them when I 'git a round to it', and then decide if I even want to publish your pearl of wisdom. In case it's not clear, I am trying to show you Elliott Wave for what it is, a sometimes & often useful and descriptive discipline. But Elliott Wave is not a pre-determined, pre-ordained, and fail-safe methodology. If it was, we'd all be rich beyond our wildest dreams by now. But, there are things about it I still don't understand yet and issues am trying to resolve because they are not clarified by the so-called experts in the field. Oh, it turns out every once in a while they get surprised too. There are even some things they have dead wrong. And, there is a big difference between describing an Elliott Wave count, and operating a "news-reading algorithm" that can react to published news reports with the mega-millions of "smart money" before a human can even finish the end of the sentence or paragraph of news. These are two different things. I am trying to do the former, not the latter.

So, what's it going to be? As the world gets more hostile, are you going to join the people who oppose the dark forces; are you going to try to be a teacher, and a helper, too? Or, are you here to grind your ax, and work your own (maybe twisted) agenda, or just complain for the fun of it?

I'll be gauging how you think this should go over the course of the next few days. If you have not complained, please ignore much of the above...

...and have a good start to the evening.
TraderJoe


Tuesday, August 13, 2019

Larger Triangle Possible

The 'stock market by tweet' continued today. This time, a supposed delay in the onset of tariffs - and a reduction in the types of goods upon which tariffs are now being imposed - sent the news-reading bots crazy and created a higher high day. Prices rose high enough in the S&P and the ES to negate a downward count, and put into play the larger triangle we wrote about last week. Here is a LINK to that chart, and here is that triangle updated.

DJIA - Daily - Potential Larger Triangle

As I had written, we have not seen the "large daily triangle" before the ending waves yet. Perhaps this is it. It is certainly a whippy and news-driven environment. Will the triangle play out? It is hard to say for sure. One clue would be that the upward wave terminates at the 78.6% level, or alternatively at the prior high (as a barrier triangle). Another clue might be y = w for the ((B)) wave of the triangle.

Time will tell. Have a good start to the evening.
TraderJoe

Monday, August 12, 2019

Out of Up Channel

Over the weekend, on Saturday, we posted that the up count just could not be made into an impulse wave, primarily because the wave had not broken the channel to the upside, yet. Today, the channel broke to the down side before the channel ever had a chance to break to the upside. That's a negative, not a positive, for the upward progress of U.S. equity markets.

ES - 1 Hr - Broken Channel

Although the Dow finished a ((C)) wave in a way that looks more pleasing to the eye, the ES finished with an attempt at a breakout of a fourth wave triangle, iv, shown above. But, that breakout in the overnight market failed on the news that protesters had shut down the airport in Hong Kong. That news - and the channel break, lower, that follows it - is the proper start of the next wave lower. It breaks the previous up wave in less time than the up wave took to form.

As many noted today, the downward wave overlapped the ((A)) wave high, and therefore lends increased confidence to a downward count. So does the failure. So does the channel break, lower.

Some have criticized this web-site for difficult, challenging or incorrect Elliott Wave counts. In response one can only look at two of the supposedly more popular web-sites and note have they have still been banking on either a primary fifth wave up (wrong - done and over in Oct 2018), or a full on Primary 3rd wave higher.  I think they are misleading their readers and / or paid subscribers.

How are you going to get continued up waves with the clear failures we are seeing between the Dow and the S&P on many occasions now? Ask them. Not me.

Have a good start to the evening.
TraderJoe

Sunday, August 11, 2019

Anyone Paying Attention Yet?

Yesterday, I published a chart - intentionally again trying to see if anyone is paying attention to degree labeling. It was a test. No one is paying attention. Few are challenging. I even gave you a clear clue in the write up. I said, that "I would add the note that since ((1)) is slightly longer than a, then a 1-2-i-ii from the low would seem to violate degree labeling."

But, therefore that also means that as a sub-wave of an ending diagonal, then ((1)) of an ending diagonal c wave would also violate degree labeling. No one is paying attention. Few people get it - or at least no one says so after 24-hrs. Further, I published the ALT labels. I did that for a reason. The ALT labels are the correct ones because of the degree labeling requirements.


The degree labeling interpretation leaves room only for a fifth wave up that is shorter than wave ((3)), because wave ((3)) is shorter than wave ((1)), and/or an ending diagonal fifth wave of c (not required).

C'mon people ... thinking caps on.
Have a good rest of the weekend.
TraderJoe

Saturday, August 10, 2019

No Impulse Yet

With the real strong proviso that things could change next week, the chart below would indicate that at the present time prices can not be claimed to be impulsing higher.

ES - 1 Hr - In Channel

For the moment, prices have not broken the potential channel to the upside. I saw no issue with them potentially doing that. Why has the market said, so far, "prices have not exceeded the upper channel"? Further the measurement from a to ((1)), is just about equality, with ((1)) a bit longer. On Friday, prices retraced to 0.382 in cash, or a little more in cash depending on which peak is picked for the top.

IF a top is being made, the count outlined is that of a potential ending diagonal. There was no clear reason why prices didn't further impulse on Friday. They tried to pop, but backed off markedly and broke a shorter term trend channel. Weak action on the close.

Still, at this point, there was no overlap between ((2)) and the prior .a wave on 8 Aug. So an impulse is not required. It could happen, but it doesn't have to. The market is really getting very, very cagey. That means that just a higher wave to end a 5 th wave (seen in red) can not be ruled out as an almost equal alternate.

To some extent, we must see what occurs early next week. That does not mean the situation is murky. It simply means the market is outlining risk parameters as follows: trading over ((1)) can not rule out further highs. But trading under ((2)), and, more so, under the prior .b wave, and therefore outside of the lower channel line would tend to indicate lower prices to follow. That's about a 45 point price range at this time.

I would add the note that since ((1)) is slightly longer than a, then a 1-2-i-ii from the low would seem to violate degree labeling.

And, as a result, patience, calm and flexibility are still needed until a more clear interpretation is present.

Have a good start to the weekend.
TraderJoe

Thursday, August 8, 2019

Probabilities Change Today

Yesterday we had written that a 38% retrace for a first wave down looked a little too cozy. It was. Prices rose today, and filled a gap on cash - which is quite common - and also filled a gap at 2,934.50 on futures. Persistent gaps in the futures (one that last for more than a few days) are a little rarer than on cash.

SP500 Cash Index - 2 Hr - More than 50% Retrace

Until there is more information, the probabilities have to be spread out evenly at 30-30-30 between these various scenarios.
  1. Second wave up as a,b,c
  2. Impulse up
  3. Larger triangle
The larger triangle arose from looking at the Dow Jones Industrial Average and noting that the down wave took less 'time' than the up wave, but did not make a new low.

You can read more on that comment at 12:33 PM in yesterday's thread. Here is the chart LINK so that you don't have to search for it. Any wave over 78.6% will be considered as part of an impulse up or as a leg of a triangle.

Right now we are counting upward. And as of the futures close a c wave would be greater in length than an a wave, which is really what tilts the probabilities.

Have a very good start to your evening.
TraderJoe

Wednesday, August 7, 2019

Second Day of Snap Back toward the Line

Today made a marginal higher high daily bar, and I said upward wave counting would begin at that point. It is also just the second day of "snap-back towards the line previously violated". The daily chart of the S&P500 shows the most probable count, with about 80:20 probability.

SP500 Cash Index - Daily - Snap Back Towards the Line

During many years of looking at the market, a lot of things have been observed. This nice looking retracement back to the 38% Fibonacci zone looks "warm and wonderful", doesn't it? Today again met with that up sloping trend line of resistance. The probability placed on this count is 80:20 for a reason. All it will take is one "progress on China tariffs" tweet, and the upward wave (ii) could extend to 1.618 x a. Where is a? Here is the short term count, below.

ES Futures - Hourly - Upward Corrective Wave

Right now the upward c wave is very, very overlapping, and it may only be the start of a diagonal for the c wave. It did make a marginal new high today, but only a marginal new high. In no case may the c wave travel below the low of b (in terms of the invalidation level).

Now is the time for calm, patience and flexibility.

Have a good start to the evening.
TraderJoe

Tuesday, August 6, 2019

Snap Back towards the Line

It's hard to make too much of today, other than what it was. When you look at the daily chart of the ES E-Mini S&P500 Futures, all they did was snap-back towards the line that was previously violated.

ES - Daily - Snap Back Towards the Line

The problem is there is no clear information that the rally is over. Numerically, the futures settled back inside the lower daily Bollinger Band, which 'resets to zero' the consecutive number of days under the lower band.

And, when one looks at cash, one does not see the 50 point decline in last night's overnight session, or the overnight reversal, so it is again hard to believe it for the best guidance. Cash 'can' be counted as three waves up from the low to this point, but, again, there is no clear information that the rally is over. Sometimes really sharp and violent waves like this one are the start of a triangle, particularly after a long steep drop.

We'll have to wait to see some retrace waves, and how prices react to the lower trend line before making more firm conclusions. But, as said before, there is no upward counting until a higher high day is made. That has not happened yet. Today was actually a "lower low" day! The swing line is still down and daily prices are still under the 18-day SMA, and so have a negative bias. Further, there is no critical upward overlap, yet.

However, to those who say "what a surprise" today was, we clearly outlined the probability of closing outside the band in Friday's post. No surprise here.

Have a good start to the evening.
TraderJoe

Monday, August 5, 2019

A 2.618 Wave

Prices as measured by the ES E-Mini S&P500 futures on the hourly chart made a clear 2.618 extension today.

ES - Hourly - 2.618 Extension

This ups the odds in favor of the top at the high, but - as the saying goes - it's not over 'till it's over. The last hourly candle of the cash session is an outside reversal candle, up, but, so far in the after-hours, most of its gains have been given up. That being the case, the odds increase to 80% for a top, 20% for the impulse minute ((c)), up. Not impossible, but very hard to see at this point. Sometimes announcements are made the following day which can not be known as of today.

Obviously, this could be part of a third wave down (whether iii or c). The EWO is at a low. There continues to be no counting of upward waves until a higher high day is made.

Patience, flexibility and calm are needed as various nations try to pull the trade rug out from under each other. So silly.

Have a good start to your evening.
TraderJoe

Sunday, August 4, 2019

Weekend Video Update (40/60)

This is the third post this weekend. If you have not reviewed the previous two, you may wish to review them first. Again, to be considerate of your time and mine, this video is limited to about seven (7) minutes.


Thanks very much for watching, and have a good rest of the weekend.
TraderJoe

Saturday, August 3, 2019

Hourly ES

This is the second post this weekend. If you haven't read the first one, you are encouraged to read it now. Below is a chart of the hourly ES E-Mini SP500 Futures. The first thing you will note is that at this time, there are at least 120 candles on the chart for the "wave of interest" - along with the Elliott Wave Oscillator. 

ES - Hourly - Larger Diagonal

Given the usual techniques of The Eight Fold Path Methodology, the pattern seen from the high is very typical of the expanding diagonal. The EWO on wave (ii) just peaks above the zero line, and the EWO on wave (iv) is ever so slightly higher than that of wave (ii). This signature has happened over and over again in my experience. The adherence to trend lines is still outstanding.

Further, I would be remiss if I did not see wave (iii) on the low of the EWO - which it is where indicated at this point. Wave b in a diagonal can be a flat, a zigzag or a triangle. So far, it is a flat. That 'could' mean that we have waves .i, down, and .ii, up of c of (v) or it could mean than wave b will continue for a while in the after hours. It needs to be watched closely, but the diagonal could still finish with a lower low against the daily up trend line at the 100-day SMA.

The very, very interesting thing again is that the last b wave on the chart was a "pre-market" wave occurring after the payroll employment report. It never even shows up in the cash market, but may be important to an understanding of wave structure at this time.  The good news is, if the b wave is over, then the count may be straight-forward to the low. The bad news is that almost nothing invalidates a b wave higher, unless it were to travel over the high of wave (iv). Traveling below the low of Friday means the b wave is likely over.

Since the diagonal currently has the structure of 3-3-3-3-3 it has a fairly high probability of being an ending rather than a leading diagonal.

Have a good rest of the weekend.
TraderJoe

P.S. Please see C's comment around 1:09 PM, below. I completely missed that (iv) did not overlap (i). That is my error, and my apologies. I said I would always let you know when I was incorrect. That mean's with C's, help, and Erik's comments regarding degree's, that the Flat-X-Zigzag I mentioned in previous comments is, in fact, the more likely pattern. Here it is, sketched out.

https://invst.ly/bhznp

Thanks & my apologies.

Friday, August 2, 2019

Second Close Outside Lower Band

Today for the equities market, as measured by the ES E-Mini S&P futures, it was a another lower low day. It was also a second daily close under the lower daily Bollinger Band (18), as in the chart, below.

ES Futures - Daily - Second Close Outside Lower Band

As most know by now from reading this site (see this LINK) price has a random chance of closing outside of the daily bands of about 5% on any given day, at least that is the intent of the construction of the Bollinger Band (assuming prices are distributed in a Bell-shaped, or Gaussian, curve - which they are most definitely not!).

However, a rule of thumb is to subtract 1% for every consecutive close outside of the band. Therefore, with two closes outside of the bands the chances of prices closing below the bands on Monday drops to about 3%. There have been instances of 5 - 7 consecutive closes outside of the bands, and that is why the rule of thumb is only that.

Since the "smart money" usually takes some money off the table at the bands, it is sometimes wise to recognize that fact in wave counting. Notice what happened to prices at the middle of May, and the end of May when prices closed outside of the bands. (Past performance is no guarantee of future results).

Further, the daily slow stochastic is in oversold territory, although it has not curled up yet. It is possible and perhaps even somewhat probable that prices will come down to touch the 100-day SMA on Monday and / or Tuesday. But it does not have to occur. So, once again, it is time for caution, calm and patience.

And a reminder: upward wave counting will not begin until there is a higher high day.

Have a good evening and a good start to your weekend.
TraderJoe

Thursday, August 1, 2019

Lower Low Day

Yesterday, we said there were ways for prices to go lower, and we provided a target. And, at the end of yesterday afternoon, we started counting upward with the .a wave shown on yesterday's chart. Today, we showed in the comments that a .c wave did not even make the .c = .a mark. It was interrupted by another one of those tariff tweets, and it sent stock prices quickly lower. We called it a truncation.

ES E-Mini S&P500 Futures - Daily - Lower Low

As measured on the daily chart, stocks hit the lower daily Bollinger Band and bounced around it for a while. At the futures settlement, the close was below the band. So, today's move did three things.
  1. Price is pushing the lower band downward
  2. Price filled the gap shown by the black circle on the price chart
  3. Price overlapped the May high at the black arrow
When that particular futures gap opened up, we noted the rarity of gaps in the futures to persist. This one lasted a little more than a month.

Wave count attempts should be sure to be cognizant now of the overlap of the May, 2019 high. With momentum clearly to the downside, the risk has increased that we will hit the 100-day SMA shown in green. There might be some backing-and-filling, but as long as price remains below the red 18-day SMA, then the bias is to the down side.

Upward wave counts will not be in effect until a higher high day is made. Please remember that the Payroll Employment report is before the market opens tomorrow.

Have a good start to the evening.
TraderJoe