Tuesday, December 31, 2019

Lower Low and Rebound

U.S. Debt Clock: $23.17 Trillion; prev $23.16
ES Daily Candle: Lower High, Lower Low, Higher Close: Yin-Yang Candle
Market Posture: Neutral
Daily Swing Line: Neutral
Daily Bias: Up (Settle Above 18-day SMA)
Resistance: Upper Daily Bollinger Band

ES futures made a lower low - which could be counted as a fifth non-overlapping wave downward, then whipped around for the remainder of the session. The turn-around was not at all surprising as the "first new trading day of the month" occurs in the next cash session, and it is likely the inflows from the 401k's, pension funds, quarterly and year-end company bonuses, dividend reinvestment plans, etc. will lift the market.

ES Futures - 4 Hr - Some Kind of Wave ((4))

Today's initial lower prices did what they needed to do to get the Elliott Wave Oscillator below the zero line and in position for a ((4))th wave. So, looking at the possible inflows ahead, it is entirely possible the ((4))th wave is over at this time. And it depends how the downward wave is counted. (There is one way to count it that suggests the down wave is a truncated double-zigzag.)

There are ways for a fourth wave to extend. This latest upward wave could be part of a b wave, but if it goes over the top, that seems like it would be less likely. Between now and January 2, one might want to keep an eye on the overnight markets.

Have an excellent end to the prior decade!
TraderJoe

Monday, December 30, 2019

Break of 0 - 2 Trend Line

U.S. Debt Clock: $23.16 Trillion; prev $23.15
ES Daily Candle: Lower High, Lower Low, Lower Close: Follow-through Candle
Market Posture: Neutral
Daily Swing Line: Neutral
Daily Bias: Up (Settle Above 18-day SMA)
Resistance: Upper Daily Bollinger Band

ES futures prices were about 5 points higher overnight, but by 4 AM they began selling off. Stocks traded lower after the open.

ES Futures - 4 Hr - Break of Trend Line

By the close, the cash market came down to 90% of low, but didn't break it. As a result, we can only count three-waves-down. A gap-down open and lower low are needed to count five-waves-down. While we will watch for that, because that didn't happen today, we note that price did get down to the 23.6% x wave ((3)) Fibonacci retracement. If it can make the 'five-down' then it has one of two chances to get down to the 38.2% retracement of wave ((3)).

The first way is to make that lower low, and form an impulse 'a' wave for a zigzag. Then there would be a retracement 'b' wave, and a 'c' wave lower - probably to the 38.2% level at around 3,200.

The second way to extend the decline to that level, and close a larger cash gap, is to form a double zigzag. Today would count as the first zigzag, and then perhaps tomorrow would be a gap up instead for an 'x' wave, to be followed by another zigzag downward.

But, if the 'Smart Money' is done with their window-dressing today, and they can't stand the thought of missing out on the 'first trading day of the month' gains, then perhaps they will begin forming a triangle upward, with today as the (a) wave down of that triangle. If so, such a triangle could start from this level. The Elliott Wave Oscillator, above, is acceptably close to zero (+10% to -40% of the wave three peak).

It is not for me to say which happens: it's The Fourth Wave Conundrum that I have written about before - and it occurs at every degree of trend. By not making a new low today, the Powers-that-Be saved the daily slow stochastic from losing its embedded status. Price is still over the 18-day SMA which neutralizes for the time being a daily swing line that has made a lower low bar.

Over the weekend, we looked at the last (B) wave in the U.S. Stock Market in 2002 - 2007. If you were Holiday-Busy, and did not see that post, you are encouraged to review it now.

Have a good start to the evening.
TraderJoe

Saturday, December 28, 2019

Statements Not Tested

In Glenn Neely's book, Mastering Elliott Wave, there are some statements which are offered with little in the way of clear, realistic examples for the reader to sink their teeth into. Having real price examples - which are largely not present - would be a great way, on the other hand, to build buy-in to the ideas and claims made in the book.

For example, there is one statement made in the book, in Section 5-18, on Flat waves. The following statement appears,

"When the b wave exceeds 138.2% of wave a, there is no chance the c wave will retrace all of the b wave (the c-wave of a Triangle might, but not the c-wave of a Flat)."

So, I decided to put this exacting - either/or - statement to the test with the most famous Flat wave I am aware of : that is the year 2000 - 2009 Flat wave in the Dow Jones Industrial Average. Here is the chart. Notice that Neely says "no chance". That means none in my head: i.e. it won't happen.

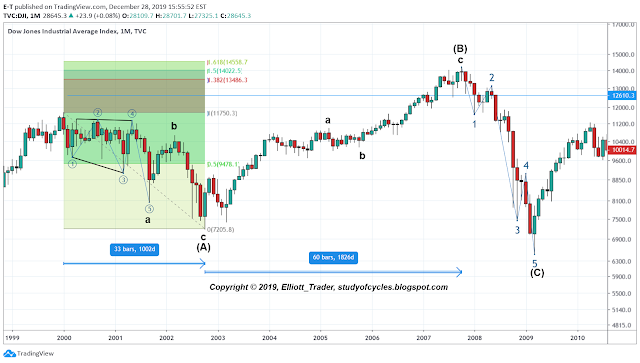
DJIA Cash Index - Monthly - (B) Wave Flat

As the monthly chart shows there is a three-wave sequence down to Intermediate (A), which is composed of an Expanding Leading Diagonal a wave, down. This is followed by a three-wave b wave, up, and this is followed by a five-wave c wave, down, to end Intermediate (A). The five-wave c wave, down, proves that the expanding diagonal was leading and not ending.

Intermediate (A), down, is then followed by a three-wave Intermediate (B) wave, up, to well-beyond the 1.382 Fibonacci external retracement on wave (A). In fact, the wave surpasses 1.500 and is very nearly at 1.618.

The five-wave Intermediate (C) wave, down, ends well beyond Intermediate (A) - meaning that Intermediate (B) is also completely retraced. We  know the only way to have a five wave sequence down, and not make lower waves - which is hasn't - is to end a correction. So, as certainly as we might, we know this whole sequence is most likely a Flat wave.

And, by example, one can see that a statement which contains a categorical denial is disproved. Did Neely say, "for the S&P 500, only". No he didn't. Maybe it works in that case. It didn't for the Dow.

In the first instance, my purpose is to ask you to be a bit leery of categorical statements made regarding Elliott Wave for which an author offers few examples. In the second instance, I want you to note very clearly how long that (B) wave is in time! There are 60 candlesticks in that (B) wave, and, since this is a monthly chart, that means it is five-years long to a first approximation! How long in time is our current (B) wave? From Dec 24, 2018 to the present or just about only one year as things currently sit.

Have an excellent rest of the weekend.
TraderJoe

P.S. This chart was added after the original post and subsequent discussion. I thought it would be helpful to see "how large" a divergence occurred with the $NYAD at the 2007 top. As, you can see from the chart below, assuming this is a (B) wave, the initial divergence occurred on a prior high in price. Then there was a larger divergence before the ultimate price high.

$NYAD - Weekly - 2007 Wave (B)

Prior to the penultimate high however, the $NYAD was literally 'screaming' higher.


Friday, December 27, 2019

Tag of 0 - 2 Trend Line

U.S. Debt Clock: $23.15 Trillion; prev $23.15
ES Daily Candle: Higher High, Higher Low, Lower Close: Yin-Yang Candle
Market Posture: Neutral
Daily Swing Line: Higher
Daily Bias: Up (Settle Above 18-day SMA)
Resistance: Upper Daily Bollinger Band

With 105 candles now on the ES 4-hr chart, and after having slightly exceeded the 1.618 Fibonacci extension level, price came down to tag the 0 - 2 trend line with lower highs and lower lows since wave ((3)).

ES Futures - 4 Hr - Tag of 0 - 2 Trend Line

The presumption (until proven differently) is that this is a fourth wave, and a 38% retracement of wave ((3)) might be expected. The timing may work out if 30 & 31 December are typical month and quarter-end window dressing days, with their concomitant sloppiness. Then, the first trading day of new year might see the typical inflows from pension plans, company bonuses, 401K's, and dividend reinvestment plans, etc. as part of wave ((5)).

There is a high degree of uncertainty in this wave, as wave ((4)) could take the shape of a triangle, or wave ((5)) could take the shape of an ending diagonal - usually not both at once as that would be poor alternation.

The alternate for the ((4))th wave - if price heads more radically lower is that an ending diagonal wave is being made for minute ((c)) of Minor Y of Intermediate (B).

The Elliott Wave Oscillator on this time frame is currently declining after diverging from price. Yet, the daily slow stochastic is still embedded over the 80 level, and the bias is up with the daily close over the the 18-day SMA. The two time frames are fighting each other.

So, we'll take it wave-by-wave, and also look at the technicals again over the weekend. Have a good remainder of the holiday.

TraderJoe

Thursday, December 26, 2019

Still Above 0 - 2 Trend Line

U.S. Debt Clock: $23.15 Trillion; prev $23.14
ES Daily Candle: Higher High, Higher Low, Higher Close: Trend Candle
Market Posture: Neutral
Daily Swing Line: Higher
Daily Bias: Up (Settle Above 18-day SMA)
Resistance: Upper Daily Bollinger Band

With approximately 100 candles on a four-hourly chart, price - in the chart below - can be seen to be nearing a 1.618 extension of a first wave higher.

ES Futures - 4 Hr - Nearing 1.618

All of this is occurring while price is above the 0 - 2 trend line, the solid brown line shown. So, according to The Eight Fold Path Method, the up move must be respected as a third wave. While there are divergences, the Elliott Wave Oscillator has not closed in on the zero line, yet, and would be expected to around 120 candles, possibly in a fourth wave.

A down wave can not likely be ascertained, not even a fourth wave, until the 0 - 2 trend line is broken. A fourth wave might be a 38% retrace of wave ((3)) when wave ((3)) has concluded. As a result, my market posture has gone to just neutral, from neutral-to-negative.

Have a continued good holiday period!
TraderJoe

Wednesday, December 25, 2019

Weekly Gold in A Channel

The chart below clearly shows that GOLD futures are in a shallow up channel since the 2016 low. The channel is shown below as the solid green parallel lines.


The (X) wave triangle - shown as the contracting dotted green lines - is clearly longer in time than the (W) wave, so the (X) wave and the (W) wave must most-likely be of the same wave degree. Since the recent high, there appears to be a consolidation (bull flag) which is resolving to the upside. Notice how, if this is labeled as a "b" wave, it would match the prior "b" wave down - of (W) - to a very similar number of points, shown by the down sloping red arrows. As a (Y) wave, it has already exceeded the (W) wave, so there is no truncation. Further, as the blue rectangles show, the (Y) wave is already as long in time as the (W) wave. This is a good indication that these two waves should also be of a similar degree.

If the market breaks below the latest b wave fractal, it would be an excellent indication of a trend change.

Have a really excellent holiday.
TraderJoe

P.S. This is the second posting this holiday, and, if you have not already read the first one, you may wish to.

Monday, December 23, 2019

New High and Five Down

U.S. Debt Clock: $23.14 Trillion; prev $23.13
ES Daily Candle: Higher High, Higher Low, Higher Close: Doji Candle
Market Posture: Neutral-to-Negative
Daily Swing Line: Higher
Daily Bias: Up (Settle Above 18-day SMA)
Resistance: Upper Daily Bollinger Band

The overnight futures and the cash market made a new higher high, then the futures could be counted as five-waves, down, which was done in real time today. On a short term basis, the ES half-hourly chart looks like this.

ES Futures - Half Hourly - New High and Five Down

The channel was broken lower, and the down wave is longer than ((2)) in price length. So, a new location for ((4)) would be the alternate only at this point or it would seem to violate degree principles. 

As per the discussion yesterday, the daily chart looks like this with an extended first wave of a. This is the only way I can see to keep the degrees of the waves correct relative to each other with the waves made so far.

ES Futures - Daily - Extended First Wave (x1)

And, as long as the channel is holding, it is also the only way I can see to keep all of wave 3 above a line from 0 through 2. If wave 4 is beginning, it could take the form of a zigzag or a triangle - and the triangle 'might' be more likely over the holiday. (Please note in the bottom chart I just used some relative wave symbols to clarify which waves are larger. Wave iii from the upper chart is wave 3 in the lower chart.)

Remember to check the exchange schedule for trading hours during the festivities. Get some rest, have some fun & enjoy the holiday!

TraderJoe

Sunday, December 22, 2019

Measurement - 3 - Nearing 0.618 x W

Sentiment? Check! Bullish overbought sentiment as being shown in the options market is screaming for a pull-back. The 10-day average of the put-to-call ratio is the lowest all year at 0.55!

Put/Call Ratio - Daily - Speculative

Fibonacci? Check! Per the chart below, there should be a vibration off of the 0.618 x W wave at the 3,245 - 55 level in the next few days.

ES Futures - 2 Day - Nearing 0.618 x W

Positioning? Check! The Commercial Trade and Large Hedge Funds are positioned against the smaller funds, and they are more short than they have been all year.

ES Futures - Daily - Commericals shorter than ever

Breadth? No! Uncheck! The NY advance-decline line is making new all time highs, as is on-balance volume.

$NYAD - Daily Cumulative New High

There will "more than likely" be a divergence at an all-time market high which is not seen yet.

Conclusion
Since the October up trend has begun, it has not broken a price channel to the down-side yet. Therefore, this entire up wave is being labeled as sub-wave a of Minor Y, still within Intermediate (B). A down leg for b to test the prior market highs at 3,025 would make sense and possibly provide a dip into January for some stocks to begin to diverge against. Right now, only transports and real-estate are diverging - and only slightly.

I admit to having gone back-and-forth against two counts. If the diagonal I sketched out in the last few days is correct, it could be a 'leading diagonal a wave'. In other words there are ways to see both counts as exactly equivalent.

Have an excellent Holiday!
TraderJoe

Thursday, December 19, 2019

Measurement - 2 - CED 'Finally' Dead

U.S. Debt Clock: $23.13 Trillion; prev $23.13
ES Daily Candle: Higher High, Higher Low, Higher Close: Trend Candle
Market Posture: Neutral-to-Negative
Daily Swing Line: Higher
Daily Bias: Up (Settle Above 18-day SMA)
Resistance: Upper Daily Bollinger Band

If you write a blog (rather than read it), you have to understand how many times the writer shakes his head when readers ask, "well, why can't this be an ending diagonal Primary 5th wave"? Some market technicians - including a recent addition on YouTube - have been carrying that count right until this last weekend. Below are the measurements that show that a contracting ending diagonal is not possible from here.

S&P500 Cash Index - Weekly - CED Not Possible

So, here you see how the top of wave (1) in the cash market is at 3,027.98, and the given where the low of wave (2) is, as they count it, and the height of wave (3), it is no longer possible for a down wave to both overlap wave (1) and be shorter than wave (2) - at least in the cash market. The length of wave (2) subtracted from the current (3?) position, as they call it, is 3,033.44 - and it would not overlap wave (1). So, we can now bury the contracting ending diagonal for Primary wave 5. Dead. Gone. Please don't raise the topic again.

My long term count sees the three down waves into December of 2018 at Intermediate (A). This up wave is currently Intermediate (B). It has just exceeded the 1.382 Fibonacci level, and could head to 1.50 or 1.618, and in rare cases even more. Therefore, temporarily, I have switched my market posture back to neutral-to-negative until it becomes more clear where the stopping point might be. (B) waves can be intractable affairs. This one may be no exception.

There are two other things to note. As a practicing Elliott analyst I have again written to a major Elliott Wave publication confirming that I wrote them earlier to state that their count of an Expanded Triangle for Intermediate (4) was not correct. I had written them months ago as you recall based on their errors in degree labeling as I understand it. It is plain to me that - given the extent of the rise, so far, that triangle is also dead. I also made note of another breaking of the rules for triangles as published. The key point is that - based on degree labeling - I wrote in advance and said it would not work. And so far it has not worked in either price or time. That count expected a high last April. Here it is now in December! That's quite a while to wait for the suspected turn.

Secondly, it is pretty clear to most that this rally is being driven by the U.S. Federal Reserve's "hands on" approach to pumping up overnight repo market, and the almost absolute certainty by the institutions that 1) there will be no interest rate hikes, and 2) and repo market problems will be bailed out. This fundamental expansion goes best with the expanding diagonal count I showed yesterday. These patterns can be very hard on the nerves. It is best to take a patient and cautious approach to them. 

It's not that the FED's action overrules all of the other fundamentals in the market. Readers can see that indicators like the Philly FED Index, and projected GDP, for example, are moribund. But, at some point, just printing money can likely not overwhelm all of the others.

Have a good start to the evening.
TraderJoe

Wednesday, December 18, 2019

Measurement

U.S. Debt Clock: $23.13 Trillion; prev $23.13
ES Daily Candle: Lower High, Equal Low, Higher Close: Inside Candle
Market Posture: Negative
Daily Swing Line: Higher
Daily Bias: Up (Settle Above 18-day SMA)
Resistance: Upper Daily Bollinger Band

There's no denying measurement. I routinely do them and have tried lots of measurements on the up waves in this Intermediate (B). In November 23rd post entitled The FED and the RED (which may be seen again at this LINK) I showed the possibility of an expanding diagonal wave that still had some more time and price to go. Here is an update on that chart.

ES Futures - Daily - A Clear 1.618

There just isn't any denying that a near-exact 1.618 projection can be made from wave (iii) versus wave (iv). And perhaps this is why we will see resistance to further upward price movement at this location. If so, I have not seen anyone else with this count. I developed it myself, and it can fit as part of the Intermediate (B) wave. IF it is a true ending diagonal (and not the interior triangle for the reasons of poor proportions I mentioned in the earlier post), then the entire diagonal would need to be retraced in less time than the diagonal took to build.

Expanding Diagonals like this often - not always - end before tagging their upper trend line as a sign of weakness. Wave (v) - in this case - would end Intermediate (B).

Have a good start to the evening.
TraderJoe

Tuesday, December 17, 2019

Zigzag - 2

U.S. Debt Clock: $23.13 Trillion; prev $23.13
ES Daily Candle: Higher High, Higher Low, Lower Close: Yin-Yang Candle
Market Posture: Negative
Daily Swing Line: Higher
Daily Bias: Up (Settle Above 18-day SMA)
Resistance: Upper Daily Bollinger Band

The minuet (b) wave, up, may have topped today, right around the level of 1.5 x minuet (a), down. There's not much else that can be said, except that after the high was made we were following either a small triangle - upward - today, or a series of 1-2-i-ii, lower within that triangle. However, that potential triangle broke lower today, not higher. We have not seen that in a very, very long time.

ES Futures - 4 H - Possible (b) Top

Futures settled near 3,195 today.

More confirmation of a top would come with 1) a break of futures 3,191 in the after hours tonight which would make a lower low, 2) trading below the mid-channel line, shown as dotted, above, 3) a break of the lower channel line, 4) a successful back test of the lower channel line, and 5) a critical overlap which would also overlap the minute ((a)) wave, up.

Have a good start to the evening. 
TJ

Monday, December 16, 2019

Zigzag?

U.S. Debt Clock: $23.13 Trillion; prev $23.12
ES Daily Candle: Higher High, Higher Low, Higher Close: Trend Candle
Market Posture: Negative
Daily Swing Line: Higher
Daily Bias: Up (Settle Above 18-day SMA)
Resistance: Upper Daily Bollinger Band

Friday was a doji day, requiring a daily confirming candle lower. That did not occur. That is just an excellent example of why the one-day candle patterns require confirmation. Sunday night was yet another gap up in the futures. They tend not to last as long as the gaps in cash. 

Today, there is no clear sign of a downward wave in progress. Big up Monday's sometimes lead to Tuesday reversals. If a Tuesday reversal occurs, then the overall up pattern from the three waves down probably can be counted as a single zigzag with a 1.618 c wave, as follows.

ES Futures - 2 Hour - Zigzag (b)?

From a degree perspective the ((x)) wave up is not longer than the a wave, and may therefore be a sub-wave. What is concerning from the standpoint of regular impulse labeling is the lack of depth to the b wave - when compared to where the a wave ended. Further, the waves are still in a rather regular channel - which is often the hallmark of corrective waves. The length of this (b) wave - at this location - would be about 150% of the (a) wave. This is still within (b) wave guidelines.

Have a good start to the evening.
TraderJoe


Saturday, December 14, 2019

Weakest Hands

U.S. Debt Clock: $23.12 Trillion; prev $23.11
ES Daily Candle: Higher High, Higher Low, Lower Close: Doji Candle
Market Posture: Negative
Daily Swing Line: Higher
Daily Bias: Up (Settle Above 18-day SMA)

As the ES futures daily chart, below, shows. Today was a doji candle - a fairly large one. A sole one-day doji does not itself signal the weakness that one might expect from the three sentiment and breadth indicators we published yesterday. No, a follow-through down side candle would be needed for confirmation, and the more impulsive the better. 

ES Futures - Daily - Doji Candle on Friday

But, we seriously want you to look at the commitment of traders report under the price graph. This chart indicates the entire 33,553 contracts of open interest is being held in the "weakest hands" - those of the small speculators. Both the commercial firms and the large hedge funds have moved to the short side. The last time this happened was back in September and the extent of the market drop that time could be seen.  If a similar drop happens this time, it would take us back to the level of support at the prior highs which might be the reasonable target for the minuet (c) wave of the minute ((b)) wave.

People keep saying, "we are making new highs". Yes, we are. But - in the chart below - look at where we are making new highs.

S&P500 Cash Index - Daily Close Only - Seven or more Closes on Upper Trend Line

Given where these closes were occurring, was it any surprise that today was a mid-range close again right on the trend line? People keep saying, "the market is too strong right now", and "the FED is too much of a player". Well the FED was actively cutting rates and ending Quantitative Tightening in September, too, but that didn't stop that corrective decline.

The last chart is what the best count of the upward (b) wave is - still inside of 1.382 times the downward three-wave (a) wave.

ES Futures - 4 Hr - Inside of 1.382

Not only is price inside of 1.382, but the y wave might have terminated on the exact w wave parallel. Note that there is no strong third wave that goes over the upper boundary of the parallel, and note that the x wave overlaps the previous .a wave of w - a condition we like to see in double zigzags. Remember that the NQ futures made a new high at w, but the ES futures did not. The down wave sure looks like a five wave move, but it has yet to prove itself with a break of the lower channel boundary and an overlap on the w wave. Those are elements of price movement which a confirmation candle might provide - if it occurs.

As a result of the wave analysis, the market posture has shifted again to "negative". This is not to be taken as trading or investment advice of any type. It is merely an indication of what the wave principle suggests is the next directional move in the market. And, it is reflective of price having pierced the upper daily Bollinger band for a second time - with the band often providing a level of resistance to upward movement.

Have a good rest of the weekend.
TraderJoe

Friday, December 13, 2019

Interim Report - The Third Leg of the Stool

Sometimes you wait months - even years - to show just one chart. However, one of the best short term timing indicators I know just fired off a signal, and I want to be sure you have seen it. It is the daily CBOE put-to-call ratio. When used only at the extremes, and interpreted properly, it can be a valuable tool in the sentiment arsenal. I have showed you this chart - last December - when it was at another extreme.

CBOE Put-Call Ratio - Daily - Near Extremes

The last time this chart was shown was back in December 2018 when the ratio was over the 1.00 level in the "Zone of Despair". As many, or more, puts were being purchased as calls - which is a highly, highly unusual situation in the options market. Usually, there are many more calls purchased on a given day. But in this case, investors were panicking because of the stock price plunge in December. My market commentary was that we might expect a turn soon.  The very next day the U.S. Federal Reserve switched from "rate hikes" to "patient mode". As you can see, the ratio immediately dropped within a few days in a fury of institutional led panic buying of calls to respond to the FED's  new actions.

Now, the situation is similar, but reversed. The indicator is now solidly back in the Zone of Speculation. There is once again a panic buying of calls - but this time at or near a market top - as the supposed 'great news' on trade and the U.K. elections forces investors to buy for fear of missing out on the supposed much larger rally to come! We'll see if 'that' happens.

More importantly, this sentiment signal is coming at a time when a key market breadth signal is beginning to roll-over to negative. It is the weekly Summation Index on the New York Composite, shown in the chart below.

NYSE Summation Index - Weekly - Divergence

You will note that both the absolute value of the Summation Index and the Slow Stochastics Indicator of it are on a divergence with the newest all-time-market highs. This indicator does not move quickly or easily. It is weekly, not daily. 

The two indicators above would be bad enough - if they were alone. I think it is worth pairing them at this time with a look at the Chaikin Money Flow, and the the MACD on the S&P500 at this time.

SP500 Cash Index - Daily - Chaikin Money Flow and MACD

One can judge that not only is volume participation diverging from this high, but the MACD is potentially on a double divergence.

These indicators are here primarily for your information. Nothing herein is intended as trading or investment advice. However, to me, taken together - and not separately - these charts indicate to me that the current market advance is at least temporarily mature, and a set back can be expected at any time. 

Have an excellent start to the day.
TraderJoe

Thursday, December 12, 2019

Jammed Up Market

U.S. Debt Clock: $23.11 Trillion; prev $23.11
ES Daily Candle: Higher High, Higher Low, Higher Close: Trend Candle
Market Posture: Neutral-to-Negative
Daily Swing Line: Higher
Daily Bias: Up (Settle Above 18-day SMA)

Tariff tweets - about what was already previously announced, that being a potential Phase I deal -  sent the news reading bots into a frenzy and jammed the ES daily futures up against the upper daily Bollinger Band.

ES Futures - Daily - Into Upper Band

The first touch of the daily band is often (not always) where the Smart Money "takes some off of the table", especially with the daily slow stochastic in over-bought territory and not embedded.

With this being the case, the DOW also came into position where it can be the (b) wave of a flat, as well as the ES futures. While the upward (b) wave may not exactly be done yet, we know that Ira Epstein usually teaches not to "buy new" against an upper daily band (see Ira's Guidelines HERE if you have questions). That is not trading or investment advice from me - just a summary of what Ira teaches.

So we have sketched in, above, how we think the Intermediate (B) wave could eventually come to an end. At the moment we do not see a "five wave up move" from (a). Do you? So, let's take it slow and steady - one day at a time, and recognize the highly choppy nature of this advance.

Have a good start to the evening.
TraderJoe

Wednesday, December 11, 2019

Stuck Up Market

U.S. Debt Clock: $23.11 Trillion; prev $23.11
ES Daily Candle: Higher High, Higher Low, Higher Close: Yin-Yang Candle
Market Posture: Neutral-to-Negative
Daily Swing Line: Neutral
Daily Bias: Up (Settle Above 18-day SMA)

The market appeared to be "stuck" up near the prior highs today. Chair Powell tried to dislodge it as best as he could, but too many people could be heard dozing, as he pumps billions of dollars into the overnight repo market because the banks won't lend as they are supposed to.

ES Futures - Daily - Narrow Day

Once again, prices tried to come down through the 18-day SMA, but they ultimately missed it by about 5 points, and prices traded slightly higher through the FED news conference.

As we noted yesterday, these up waves can still be broadly consistent with a minuet (b) wave, up, of minute (b) down, with a minuet (c) wave lower to follow. Nothing has disqualified or invalidated that count, so there is little to report on today. The daily slow stochastic remains in over-bought territory. Even gold and Crude Oil remained in their ranges.

Have a good start to the evening.
TraderJoe

Tuesday, December 10, 2019

Fighting a Battle

U.S. Debt Clock: $23.11 Trillion; prev $23.11
ES Daily Candle: Lower High, Lower Low, Higher Close: Trend Day
Market Posture: Neutral-to-Negative
Daily Swing Line: Down
Daily Bias: Up (Settle Above 18-day SMA)

ES Futures and cash S&P500 made a lower low day, which was more significant in the overnight session. Prices reversed upward considerably on news that some portions of tariffs might be delayed. We've heard that before. Do they mean it this time? Did they release that news this morning just to blunt the news story about the agreement reached on Articles of Impeachment? Such a cat-and-mouse game. Prices went down to pierce the 18-day SMA where a battle was fought, and prices have settled higher in the futures. So, even though the swing line is down it is neutered by the close being over the 18-day SMA as in the chart below.

ES Futures - Daily - Battle at the 18-day SMA

The daily slow stochastic is still up in over-bought territory, and my understanding is that the FED meeting is tomorrow. Given the propensity for volatility on that day, the best options are that if the market wants to make a new higher all-time-high it would do it with a double-zizag wave for minuet (b) of minute ((b)). If - on the other hand - the market is disappointed in the FED actions and downside prices resume, today might have started a diagonal lower.

Particularly in the NQ futures, there appear to be only three waves down, so far, followed by an overlap upward.

Have a good start to the evening.
TraderJoe

Monday, December 9, 2019

Inside Day Down

U.S. Debt Clock: $23.11 Trillion; prev $23.10
ES Daily Candle: Lower High, Higher Low, Lower Close: Inside Day
Market Posture: Neutral-to-Negative
Daily Swing Line: Up
Daily Bias: Up (Settle Above 18-day SMA)

In the comments section of the previous post, we were only able to count three-waves-up in the NQ 100 futures. These futures made a new daily high. Neither the Dow cash, nor the S&P500 cash indexes nor the ES futures could muster the new high. The result is shown back in the daily chart, below with an inside day.

ES Futures - Daily - Inside Day

The three-waves-up, so far, show the c wave that is less than an a wave in length. But, in the NQ and the ES, the up wave is 90% of the length of the down wave, and therefore can qualify for the "b" wave of a flat wave.

One of those powerful third waves up could not even break the upper boundary of the parallel trend channel in the hourly ES futures. The NQ futures new high was on another divergence.


Readers should now be on alert for a potential critical overlap which may prevent further upward counting as an impulsive wave.

This should still be considered as part of the larger minute ((b)) wave down until or unless something occurs to prevent that count. The daily prior highs in September remain an excellent first target.

Have a good start to the evening, and to the week.
TraderJoe

Saturday, December 7, 2019

Best Daily Count Since Last December

The chart below reflects the NQ 100 futures using two-day bars. This count contains the best upward count out  of the December, 2018 low I can muster. Any other count breaks too many guidelines or rules. A similar count developed on the ES to Minor wave W is and was my preferred count.

NQ 100 Futures - Two Day OHLC - Best Count

On the left-hand-side of the chart, readers will note the overall count up from last December to the May high is not impulsive. I have tried many. many ways to count it as impulsive in the past, and I took a swing at it again today. I simply can not find a good way to do it. Believe me, if I could count it as impulsive I would gladly publish it. 

To prove this point, if you look within the (a) and (c) waves up from December to Minor W, you will see impulsive counts. Further, if you will look on the right hand side of the chart, you will see the recent minute (a) wave is also counted impulsively. The key is without this impulsive count, then wave iv within the new minute (a) becomes too long in time, and creates a degree violation. The reason it works here is that minuet iv can have any time relationship to minuet ii because they are of the same degree.

Now, that should mean we are in a minute (b) wave downward. So far, there have been three waves down. But that seems too short in time to be the completed sequence. Again, if you look to the left of the chart and count the bars, the minute (b) wave within minor W took at least 62% of the time of minute (a) wave.

So what could happen? Unfortunately for those who want a definitive answer, we are again dealing with a "B" wave. And "B" waves can be literally anything from a flat, to a triangle, to a double or triple zigzag downward. Price simply has not yet come back down to test the breakout of the triangle yet. Perhaps it will. It is definitely not required to, but it could. How it gets there - if it gets there - is a darn good question.

If you are a student of Elliott Wave work, you know that this is how Elliott Wave logic works. "B" waves are notoriously difficult to predict - about the worse that there is. But a double-zigzag, triple zigzag or double-combination like a flat-x-zigzag could both waste some more time and provide for the downside test. So, we will take the count day-by-day and do our level best. 

One item readers will note is that even given the flurry of new all-time-highs the Elliott Wave Oscillator remains stuck on a divergence, and now is even declining. That should be telling us something.

Have a great rest of the weekend.
TraderJoe

Friday, December 6, 2019

Three Larger Waves Up, So Far

U.S. Debt Clock: $23.10 Trillion; prev $23.10
ES Daily Candle: Higher High, Higher Low, Higher Close: Trend Day
Market Posture: Neutral-to-Negative
Daily Swing Line: Neutral
Daily Bias: Up (Settle Above 18-day SMA)

Today was higher on the jobs report. Yesterday's "Err on the side of five-up" post was timely. Neither the Dow, the S&P or the NQ futures made a new all-time-high. The S&P500 came within 90% of it's high. Neither the Dow nor the NQ did yet. The Russell 2000 made a higher local high. So now, there are a pretty clear "three-waves-up".

SP500 Cash Index - 15 Minutes - Channel

We said yesterday we would not speculate on the nature of this up wave until things have become clearer. At this point we will only say that there are three-waves up in a channel. The wave labels a/i, b/ii and c/iii should be viewed as equivalent at this point until they are not. The EWO is higher on the second upward series of waves, and there is not a clear fourth wave in evidence. A fourth wave down should not overlap a/i, right? So, we take it a step at a time.

Have a good start to the weekend.
TraderJoe

Thursday, December 5, 2019

Err on the side of Five

U.S. Debt Clock: $23.10 Trillion; prev $23.09
ES Daily Candle: Higher High, Higher Low, Higher Close: Trend Day
Market Posture: Neutral-to-Negative
Daily Swing Line: Neutral
Daily Bias: Up (Settle Above 18-day SMA)

Yesterday we had counted three waves up - with the waves presented. Last night's overnight higher high in the futures, and the subsequent morning higher high in the cash indexes added an additional wave. As ugly as it is (chart below), we should err on the side of "five up" for this wave. Being so ugly, it might just be an "A" wave up. By ugly, I just mean the measurements are not quite correct. In particular, wave ((3)) came close, but did not meet or surpass 1.618 x ((1)). And then ((5)) is a bit shorter than ((1)).

ES Futures - 30 Min - Fifth Wave Up and 38% Retrace

After last night's wave, there was a quick 38% retrace - which is a sufficient retrace in price, but it might not yet be sufficient  in time. In other words a b/ii wave could take longer in time. By showing the time rulers, we are showing this up wave has already take more time than the the down wave. So, this should be a part of a corrective sequence upward.

But there are ways minute ((b)) could have another wave 'over the top' with a compound flat, double combination or other ugly ((b)) wave. Yet, this wave upward could also make a "deep retrace" wave characteristic of a diagonal that makes lower waves, instead. There are too many ways for the waves after a "three-wave-down" sequence to play out. For this reason, the count must absolutely remain tentative. We will count what we see only, until the situation clears a bit; predictions will be avoided. And the market posture has shifted back to neutral-to-negative because of the "five-up" sequence, as ugly as it is. At some point, there should be at least one more five-up sequence.

It would be nice to be more definitive - but those of you familiar with Elliott wave know that this situation occurs from time-to-time.

Have a good start to the evening.
TraderJoe

Wednesday, December 4, 2019

Three Down, Three Up

U.S. Debt Clock: $23.09 Trillion; prev $23.09
ES Daily Candle: Lower High, Higher Low, Higher Close: Inside Day
Market Posture: Negative
Daily Swing Line: Neutral
Daily Bias: Down (Settle Below 18-day SMA)

If yesterday ended what looked and measured like three-waves-down, then today certainly appeared as only three-waves up. The intraday chart of the ES 30-minute is below. 

ES Futures - 30 Min - Three Waves Down and Up

The retrace upwards did not take price beyond the 62% retracement which can be seen as a sign of some weakness. The up waves and down waves are roughly equal in the number of candles. Since wave ((C)) is longer than wave ((A)) in both series, it seems like the waves should be of the same degree. Therefore, it is possible to conclude a downward diagonal may be in the formative stages.

Time will tell. Have a good start to the evening.
TraderJoe

Tuesday, December 3, 2019

To the Bottom Band

U.S. Debt Clock: $23.09 Trillion; prev $23.09
ES Daily Candle: Lower High, Lower Low, Lower Close: Trend Day
Market Posture: Negative
Daily Swing Line: Neutral
Daily Bias: Down (Settle Below 18-day SMA)

With yesterday's key reversal day, the algo's wasted no time in targeting the lower daily Bollinger Band, after only a mere 23.6% upward retrace.

ES Futures - Daily - Hit on Lower Band

With such a small retrace overnight, we initially said it could only be a first extended wave type of the impulse variety or just a simpler a,b,c sequence. For the first extended wave count, the third wave should have remained shorter than the first. It did not, and so the three down waves count currently as a,b,c.

After hitting the lower daily band, prices then began a rebound which initially looked like part of a triangle, but then we warned - if it busted higher instead of lower - it could be an upward diagonal. Here is the intraday chart.

ES Futures - 5 Min - Upward Correction

The intraday expanding diagonal proceeded from about the open until about 13:45, and may very well be an a wave as shown. Following that upward wave, there was likely a downward b wave in three waves that just barely broke the lower diagonal trend line, but just enough to recognize it. And following the b wave, there is a clear five-wave sequence upward which is likely either i of c, or all of the c wave, upward. Since there is a five-wave sequence up following the expanding diagonal, then the diagonal itself may be said to have been confirmed as a leading diagonal. The b wave retrace is not very deep, and that is what may make the diagonal structure just an a wave.

At this point we can do little more than question as follows: a) is the larger minute ((b)) wave down done at this location? If so, it would count as w-x-y. If not, with only three-waves down, it is possible a larger diagonal is forming downward, and b) is ii of c over yet? It would be remarkably short in price length if it were - but we have seen stranger. Regardless, we have shown the invalidation for a second wave of c at the dotted orange line.

Have a good start to the evening.
TraderJoe

Monday, December 2, 2019

OKR

U.S. Debt Clock: $23.09 Trillion; prev $23.08
ES Daily Candle: Higher High, Lower Low, Lower Close: Outside Key Reversal (OKR) Day
Market Posture: Negative
Daily Swing Line: Neutral
Daily Bias: Up (Settle Above 18-day SMA)

Because of the differences in the way that the chart purveyor, below, accounts for the holidays there are some subtle differences between this chart and one based on the way the CME accounts for the holidays. In the CME chart, prices today settled above the 18-day SMA, not below it. Still, the essential ingredients are the same.

ES Futures - Daily - Outside Key Reversal Day

Regular readers will recall we said we expected the regular beginning-of-the-month inflows on Dec 2 which is the first trading day of the month. But, we didn't know if they would result in a new high or just a retrace wave. The new high did occur in last night's futures session, and the futures went on to make new all time highs. The new high did not happen in cash. In the futures, prices headed lower, tagged the 18-day SMA and went down to fill the previously open gap up in the futures from the Sunday night session on November 24th, now shown as the black cicle (Cash did not close it's gap as the session ended.)

Although it was the second largest down bar since the rise from October began, we don't want to make too much of it yet, as the advance decline ratio (without closing statistics yet) was still less than 1:4 which is not as impulsive as some 'kick-offs' are.

The primary purpose of the next chart is to show that the lower boundary of the daily channel we drew in the holiday posts is now being tested, and to show the divergences with the MACD involved at this time scale.

ES Futures - 5 Hr - Lower Testing Channel

Whether the channel breaks first or not, an upward retrace wave (at minimum) is expected at some point. 

Because of the rather precise timing with which this down draft occurred, we want to remind readers of the possible daily count shown over the holiday. Use this LINK.

Have a good start to the evening and the week.
TraderJoe