Thursday, May 31, 2018

Choppy Day Lower

Market Outlook: Now Getting Higher Volatility  
Market Indexes: Major U.S. Equity Indexes closed lower
SPX Candle: Lower High, Lower Low, Lower Close -  Yin-Yang Candle
FED Posture: Quantitative Tightening (QT)

Let's get right to the chart and keep this short and sweet. Prices gapped lower today and did not fill the gap.

S&P500 Cash - 15 Minute - Decline

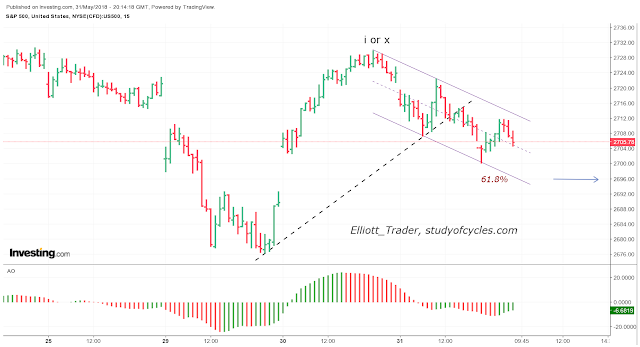
During the live chat room session, we identified the (dotted) three-touch trend line, and it's break lower with the lower lows, and prices currently trading in a channel for the bulk of the day.

Although price made some progress lower, it was a very choppy day, and the 61.8% Fibonacci retracement level (shown) at 2,696 was not attained in the downward direction. As long as price continues in the channel or below it, we must consider a downward trending wave still in force. At this point there can be a double zigzag lower with Y just slightly greater than W. This could turn into a triple zigzag lower, or it's cousin, a leading diagonal. We won't know until we see either more downward price movement, or if price breaks the channel in the upward direction.

Again, this could be wave ii if the minute (e) wave of the triangle ended on May 29th. Or, if a leading diagonal takes hold, then the minute (e) wave can still be continuing, lower. 

Only time will tell. Stay flexible, patient and calm. And most importantly, have a good start to your evening.
TraderJoe

Wednesday, May 30, 2018

i or x

Market Outlook: Now Getting Higher Volatility  
Market Indexes: Major U.S. Equity Indexes closed higher
SPX Candle: Higher High, Higher Low, Higher Close -  Trend Candle
FED Posture: Quantitative Tightening (QT)

Based on yesterday's hourly chart of the cash S&P500 Index, there are two excellent possibilities for today's wave: either it is part of a first wave up, after the minute (e) wave of the larger triangle on the daily chart, or it is wave x of a more complicated double zigzag for wave (e) - still in progress.

Here is a cash chart on the fifteen minute time frame.

S&P500 Cash Index - 15 Minutes - i or x

In order to confirm a minute (e) wave of the triangle is completed, then price would need to get above the minute (d) wave high. That has not happened yet. Yes, the downward wave sequence in the channel was clearly an a, b, c three-wave sequence. Further, there is very poor alternation in the downward wave, so I conclude it is a corrective wave sequence of some type. 

Next, the upward wave sequence that began yesterday and continued today has a "no pullback" look to it. And, while it can very well be the first wave of the thrust out the triangle, the no pullback character can also just mean it is the "x" wave of a double zigzag. For the up wave to survive as the x wave, then it should not make a new high above the (d) wave, as that would invalidate a double zigzag count.

Otherwise, if the x wave survives, the (e) wave can travel more fully lower. I have no preference which occurs, remaining neutral and counting waves.

Have a very good start to your evening.
TraderJoe

Tuesday, May 29, 2018

Diagonal Failure

Market Outlook: Now Getting Higher Volatility  
Market Indexes: Major U.S. Equity Indexes closed lower ; DJUtil Higher
SPX Candle: Lower High, Lower Low, Lower Close -  Trend Candle
FED Posture: Quantitative Tightening (QT)

As we had written about in our previous post, there was no requirement for the potential hourly ending contracting diagonal to make a new high. When a contracting diagonal is a C wave, it's fifth wave may fail. This one did, and it failed badly. So, we hope we prepared you for that eventuality.


S&P500 Cash Index - Ending Contracting Diagonal C Wave Failure

So, we now conclude the (d) wave of the larger triangle is now over, and it ended with the three-wave, .a, .b, and .c to the wave ((5)) of the c wave of minute (d). There are people who may recoil at the truncation. Given the news environment, particularly as it relates to Italy, Korea and China, it seems like the right count from a psychological perspective, as well. The news could have been better this weekend. It wasn't.

So, now we look at the larger potential daily triangle on this index.


S&P500 Cash Index - Daily - Potential Larger Triangle

From this chart, we can see a completed minute (d) wave, and the beginning of the minute (e) wave - or worse - lower. Today's decline was not small potatoes. Yet, the (e) wave has already done everything we suggested it 'must' do - which is to trade on the opposite side of the daily EMA-34 for better form and balance. It can still trade lower. The only thing this down wave can not do, and remain within this particular triangle count, is trade below the (c) wave.

We'll see how it goes, taking it step by step. Remember, the best alternate now is that a minute (ii) wave ended where the minute (d) did - all as shown previously. I hope you are gaining a better understanding now of The Fourth Wave Conundrum, and why this makes wave calling so treacherous at times.

For now, be patient, calm and flexible. And have a good start to your evening.
TraderJoe


Wednesday, May 23, 2018

Follow Up

Market Outlook: Now Getting Higher Volatility  
Market Indexes: Major U.S. Equity Indexes closed higher; DJTran Lower
SPX Candle: Lower High, Lower Low, Higher Close -  Neutral Candle
FED Posture: Quantitative Tightening (QT)

Yesterday's bearish engulfing candle was not confirmed lower with a lower close day, as is typically required of daily candle patterns. From the hourly chart we presented at the top of yesterday's post, we weren't expecting it would be. Today's initial drop was 'testy' but the market came through and did not invalidate the potential diagonal. Here is yesterday's hourly chart updated.

S&P500 Cash - Hourly - Potential Diagonal c wave of minute (d)

For the diagonal to play out properly, then wave ((5)) must remain shorter than wave ((3)). As we said, wave ((4)), by the skin of its teeth, remained shorter than wave ((2)), but overlapped wave ((1)) as it should have. You can see from the Elliott Wave Oscillator, that there is a nice little wave ((4)) signature happening currently.

We must note that wave ((5)) most likely would make a marginal new high, but it does not have to. Because this is likely an ending diagonal pattern, then this fifth wave can fail to make that new high if it wants, and still remain a valid structure. Only in a leading diagonal must the fifth wave not fail.

From an invalidation standpoint, no part of wave ((5)) may be allowed to trade below the low of wave ((4)), and from a time signature viewpoint, wave ((3)) has consumed less time than wave ((1)), and wave ((4)) has taken less time than wave ((2)). So far, the wave structures fit. Now, let's see if they hold up.

Have a very good start to your evening.
TraderJoe

Tuesday, May 22, 2018

End of Minute (d) Approaching ?

Market Outlook: Now Getting Higher Volatility  
Market Indexes: Major U.S. Equity Indexes closed lower; DJUtil higher
SPX Candle: Higher High, Lower Low, Lower Close -  Bearish Engulfing Candle
FED Posture: Quantitative Tightening (QT)

In the daily chart of the S&P500 cash we said it was likely the c wave of the minute (d) wave was underway, and we had stated it could have higher to go. It still could. 

Yet, in the live chat room today, this hourly count was posted.

S&P500 Cash Index - Houly - c wave of minute (d)

So far, we can count this movement as a potential contracting ending diagonal to end the c wave of the minute (d) wave. Interestingly, we called this potential wave structure at today's marginal new high - which makes such a diagonal a potential. Notice how the Elliott Wave Oscillator is declining from wave ((1)) to wave ((3)). We had no assurance that wave ((4)) would begin in earnest, but it did.

As a refresher, here is that larger potential daily triangle.

S&P500 Cash - Daily - Potential Larger Daily Triangle

Clearly you can see why we have a Fourth Wave Conundrum. This larger triangle could play out or the smaller triangle - as we outlined in a previous post on The Russell 2000 Index (with it's new high) could have been the triangle of interest - just apply the same declining trend line from (b) to a, above in the smaller version of the triangle. There simply is not a fool-proof way to tell.

The hourly ending diagonal c wave could be spelling out that the prior b wave low will be taken out by the minute (e) wave lower. That is one excellent possibility. In any event, I would like to see the (e) wave travel below the blue EMA-34 shown for best form and balance. Such a wave would probably generate a lot of bearish sentiment.

And, so that you know, this is now the first time that I can call a legitimate downward alternate to this count - bearing in mind there is little downward evidence for it just yet. However, in the interest of 'an abundance of caution', we're going to show it to you here first.


S&P500 Cash - Daily - Downward ALTERNATE

The above count would be that of a double combination w-x-y whose purpose would be to form minute wave (ii) after a minute wave (i), down, from an Extended 5th wave higher. This count would be the very same in the DJIA as it would be in the S&P500, and might help explain the Dow's lower low at x, which is unconfirmed by the S&P500.

Why have we NOT counted it as the proverbial 1,2, (i), (ii) down as so many web-sites have? Well, remember Neely's guideline that no part of wave 3 should break a line from 0 - 2? That is what would happen if w was wave 2., and if y was wave (ii). So, we are not going that route.

Further, we think that considering this wave as either of the two triangles, above, or as the double-combination alternate count has served us well in terms of predicting just how this wave would stall as it has in the low volume reflecting the tremendous uncertainty as nations elect whether or not to play the "Trade War" game.

And this should be the best written illustration of why The Fourth Wave Conundrum exists in reality. With exactly the same wave structure, you have the clear possibility for the smaller triangle, and the larger triangle which point upward, and this latter double-combination, which points downward. If that doesn't spell conundrum I don't know what does.

We might suppose that with the recent highs in the advance-decline line, that it would be better to have a Minor 4 triangle help finish the Primary 5th wave to end the SuperCycle. That's our bias, but it is just that, our bias. It could also be that the Primary 5th wave ended with the extended Minor 5th wave as a major Elliott Wave firm sees it. And, the evidence for that might be that we are forming an ending contracting diagonal. Will such a structure lead to a complete breakdown of the entire triangle? It could. But, it hasn't as of yet.

Stay tuned, and have a very good start to your evening.
TraderJoe


Friday, May 18, 2018

R2K New All-Time-High

While the rest of the U.S. equity market is currently quite tepid, the Russell 2000 Futures clawed to a new all-time-high yesterday and again this morning, likely proving their case for the smaller daily triangle. The daily chart is below.

Russell 2000 Futures - Daily - New All Time High

So, the smaller triangle appears to have played out on this index, and met all of the requirements for a triangle. Because yesterday's close was above the high of wave 3, this triangle appears complete, and it does not appear as if a larger or more complicated barrier triangle is in progress on this index. Note that the Elliott Wave Oscillator has a clear triangle signature - shown by the trend lines, and each minute wave of the triangle falls on an opposite side of the EMA-34.

This triangle also does not appear as a "running triangle" with a higher (b) wave. The (b) wave is lower than the end of wave 3. Therefore, this triangle could signal that the final five-wave sequence is dead ahead.

Will the other markets follow suit and make new all-time-highs? That is certainly possible, maybe even likely. But it needs to be monitored closely. One common target for the thrust out of the triangle is to add the 'widest width of the triangle' to the breakout point. In no case should wave ii of 5 travel below the low of wave (e) for the thrust to remain in tact.

Have a good day and a great weekend.
TraderJoe

Thursday, May 10, 2018

The Larger Potential Triangle

Market Outlook: Now Getting Higher Volatility  
Market Indexes: Major U.S. Equity Indexes closed higher
SPX Candle: Higher High, Higher Low, Higher Close -  Trend Candle
FED Posture: Quantitative Tightening (QT)

On the previous post, we outlined the case for the potential smaller triangle, and we noted how many pundits and web-sites were beginning to copy our view. The smaller triangle is certainly valid, and continues to be so. But, below, we outline the case for the larger triangle. We do this now, only after the prior a wave high has been exceeded to the upside.

S&P500 Cash Index - Daily - Larger Triangle Scenario

It is interesting how varied the b waves have been in form and structure. Starting from the left, the first b wave is a Flat. The second b wave is a triangle or running flat, and the third b wave is a triple zigzag or diagonal as we have pointed out.

In this larger triangle, the purpose of the minuet c wave of the minute (d) wave was to push out the upper border of the triangle. I have referred to this as the triangle 'breathing" once, or "expanding" once. This up wave does, indeed, seem like a c wave. It has daily gaps in it, and it is at a steeper angle than the prior a wave, upward.

IF a minute (e) wave begins lower, it's purpose will also be to take up time and move price sideways. But, more than that, it's purpose at some point will be to impulse downward enough to scare some people that downward movement will continue, when, in fact, the market would likely reverse and head higher. It might do this by exceeding the prior b wave lower.

It would only be this movement that could distinguish a minute (e) wave lower, from a minuet ii wave lower, if it is the smaller triangle alternate which comes to fruition.

There is no certainty, yet, that upward price movement is completed. The (d) wave may not be done. When the (d) wave does wrap up, and the potential (e) wave begins, remember that the (e) wave could form a triangle all by itself - since each of the other legs of the triangle can be counted as a simple leg of the triangle. Usually, not always, triangles contain one complex wave sequence.

While some Elliott Wave analysts were calling for an outright decline, prices have so far refused to comply. For this reason, I simply remain neutral, patient, calm and flexible.

I hope you will too. Have a good start to your evening.
TraderJoe

Sunday, May 6, 2018

Bullseye for The Eight Fold Path Method

The weekly chart of the S&P500, plotted along with the Elliott Wave Oscillator, shown below, now shows that with 116 candles on the chart (hard to get closer to the recommended 120 candles on any different time frame), the Elliott Wave Oscillator has just peeked under the zero line at -2, to likely indicate a fourth wave location. Bullseye!

S&P500 Cash Weekly - The Eight Fold Path

It is indeed possible to count a completed triangle at this location, and that would alternate well with either type of correction for wave 2 (whether it was a flat or simple zigzag). The chart above is labeled in accordance with three principles:

A. Proper degree labeling.
B. All wave threes must entirely be above their 0 - two trend lines.
C. Each larger numbered wave (1 - 5) should be on an opposite side of the blue EMA-34.

With regards to proper degree labeling, wave minute i of Minor 3, is just short of 100% the length of Minor 1. Because it is shorter than Minor 1, it is of a lower degree. As I wrote in an earlier post, this is the only way I can find to preserve degree labeling in the third wave. Then, each of the minuet waves .i - .v is shorter than the minute i wave. Clearly minute iii of Minor 3 is shorter than Minor 1, as is minute v.

And, with regard to trend lines, clearly, all of wave Minor 3, is above the 0 - 2 trend line. But, importantly, all of wave minute iii is above the Minor 2 - minute ii trend line, as well. Finally, all of minuet .iii is above the trend line from Minor 2 to minuet .ii, and they all work out as Neely's guideline suggests.

Each of the above items is a measurable or observable characteristic of the wave. As such, these criteria are objective in that any person can observe them and replicate them without a "secret sauce", expensive tutorial, or supposed guru needed to interpret them. Furthermore, certain web-sites and other pundits have been calling for a crash which has not occurred just yet (although, granted the risks are exceedingly high with each day that passes).

On the other hand, this site said "a triangle could help even out the point distances between waves 2 and waves 4." And, further, since the a wave down of the triangle is longer in points than even Intermediate wave (4) at the February, 2016 low, "a triangle could help even out the point differences to avoid a degree conflict in terms of the number of points traveled between Minor 4 and Intermediate (4), because a triangle is always measured to it's (e) wave."

Was a triangle the right call? Certainly, the daily whip and foam is consistent with one. And, at this point in time, the structure we have shown certainly looks like a triangle.  So far, so good, and we note that many other web sites are now getting on board with the whole triangle idea - well after we did.

So, as I've written about before, then, this triangle could expand once (or breathe) and create a slightly deeper d wave, to be followed by a more complex e wave, later. That will need to be tracked in real time.

For my part, I'm going to reduce my frequency of posts for a while, and let things play out. While doing so, this might be an excellent chance for you to try your hand at The Eight Fold Path Method for yourself on these waves, and see what they look like. Just remember to give the corrections lots of time, like we did with the most recent (b) wave - or e wave - example.

Ultimately, what would be great to see would be new highs that diverge with the Advance/Decline line, and possibly a real daily outside "key reversal" candle stick that starts a down wave from a new all-time high without the presence of large gaps that currently appear at the former all-time-high in the daily cash chart.

Does this have to happen? No. First, as I said, the triangle might expand more to make the larger version of the triangle. Remember, the very purpose of triangles is to take up time, and move price sideways. Then, some markets might make the new highs, other markets might truncate. It's all part of The Fourth Wave Conundrum that happens at every degree of trend.

Take it step-by-step and let's see how it goes.
Have a good weekend.
TraderJoe


Friday, May 4, 2018

Pop Out of Diagonal / Wedge

Market Outlook: Now Getting Higher Volatility  
Market Indexes: Major U.S. Equity Indexes closed higher
SPX Candle: Higher High, Higher Low, Higher Close -  Trend Candle
FED Posture: Quantitative Tightening (QT)

Yesterday, we showed you a chart of how a (b) wave of the larger potential triangle could have ended. Fueled by today's employment data, stocks retraced narrowly and held the lower (zigzag or...) diagonal trend line. Prices then spiked above the upper diagonal trend line, in what appears as a convincing end to a now nicely proportionate (b) wave.

Here's the updated chart of the 4-hr Dow futures.


DJIA Futures (YM) - 4 Hr - Likely End of (b) wave.

The up move is decently impulse. It cleared the prior ((x)) wave, and we would like to see a clear five-wave sequence before labeling an upward wave at this time. And, it would be more evidence for the two daily triangles if the (a) wave high was exceeded at some point.

Needless to say, both the larger triangle count - where yesterday is the (b) wave, and the smaller triangle count - where yesterday is the end of the minute ((e)) wave, are valid for the S&P500 cash index. The DOW is still in question, even though the example above was used just to illustrate the clean end to a wave.

It would be a sign a trouble if price failed a back-test of the wedge at some point. That's it for now. Perhaps there will be more on Saturday or Sunday.

Have a very good start to you weekend.
TraderJoe

Thursday, May 3, 2018

More Whip and Froth - 2

Market Outlook: Now Getting Higher Volatility  
Market Indexes: Major U.S. Equity Indexes closed lower; DJIA higher  
SPX Candle: Lower High, Lower Low, Lower Close -  Hammer Candle ?
FED Posture: Quantitative Tightening (QT)

Yesterday, we showed good cause why a i, ii up count in the major averages might invalidate. We said  that if 2,623.25 in the futures was exceeded lower, then a i, ii up count would not make sense, and it would make more sense that the (b) wave lower was still continuing. The futures count did invalidate downward, and stocks opened lower.

Early this morning, in the live chat room we posted this chart of the DJIA Futures (YM) on a 4-hour basis to show the likely count of the (b) wave, down, and we targeted the 78.6% retracement level, which coincided with the 200-day SMA on the S&P500. We used the Dow futures just because the chart was 'cleaner' and easier to count. That 78.6% retrace level was hit, and a bit more. But a new low for April was not made. And, then there was a sharp turn higher. Prices for the S&P500 cash index ended above that 200-day SMA.


DJIA Futures - YM 4hr - Triple Zigzag or Ending Diagonal

As an ending diagonal to a flat wave (b), this would make the (b) wave longer in time now than the (a) wave. In the Flat version, the (a) wave ended with the spike mid-way on the 13th, not with the ending print - as shown. As the triple zigzag version, the times of each wave are about equal. Either way, there is better symmetry between (a) and (b), now.

Within the triple zigzag or ending diagonal, the measurements are correct. Wave ((z)) is shorter than ((y)), wave ((y)) is shorter than ((w)), the second wave ((x)) is shorter than the first wave ((x)), and it overlaps wave ((w)). And, they can all be counted as three-wave zigzag sequences.

As spiffy as this pattern is, there is still considerable price risk in the market. It would be best to see the upper declining trend line exceeded to the upside, and then see that trend line hold on a back test. We also would like to see a fifth wave up of the current up wave. That did not quite happen by the futures settlement.

The outright bears reading this might wonder why the pattern is not also a 'leading diagonal' lower. Fair question. With lower odds it could be. But, at this point, there is no new lower than April, and so the odds still favor either the larger or smaller daily triangle.

In the smaller daily triangle, it is possible that this triple zigzag lower is a valid minute ((e)) wave of that triangle. As such, it would be the complex wave. But, there is still not sufficient evidence supporting that case either. Hence, I remain neutral and am simply counting the waves as best as possible - following the rules.

A reminder that tomorrow is the payroll employment report. I'm sure there will be more Whip and Froth.
Have a good start to your evening.
TraderJoe

Wednesday, May 2, 2018

Whip and Froth Continue

Market Outlook: Now Getting Higher Volatility  
Market Indexes: Major U.S. Equity Indexes closed lower; RUT higher  
SPX Candle: Higher High, Higher Low, Lower Close -  Bearish Engulfing Candle  
FED Posture: Quantitative Tightening (QT)

Yesterday we wrote, "None-the-less, do not be surprised by a 38% or greater pull-back beginning tomorrow or the next day." That pull-back occurred today, after a visit to slightly higher highs. But, now there is a potential problem. 

Looking at the ES E-mini S&P500 Futures below, one can see that the count is at high risk of invalidation.

ES E-mini S&P500 Futures - 30 Minutes - Flat or more of (b)?


The futures closed at 2,627. And the prior low is 2,623.25. Since a wave 2 may not go below its wave 1, then even one tick below 2,623.25 - even in the overnight - would invalidate the wave 1, up count of minuet (c) of the minute ((d)) wave of the larger daily triangle.

If it, the 1, 2 count, does invalidate, then one might surmise that the (b) wave is continuing with a further sub-division as we said was certainly possible at least until there is any further evidence upon which to base a count. If the 1,2 count survives, then the structure is a common flat wave. In the cash market, the S&P500 did stop at the 78.6% retracement level on wave 1, even if temporarily. Let's see how it goes.

Have a good start to your evening.
TraderJoe

Tuesday, May 1, 2018

Three Waves Down and Reversal

Market Outlook: Now Getting Higher Volatility
Market Indexes: Major U.S. Equity Indexes closed higher; DJIA, DJT, DJUtil lower
SPX Candle: Lower High, Lower Low, Higher Close -  Hammer Candle
FED Posture: Quantitative Tightening (QT)

Stocks opened lower, and based on the ES futures, during the course of the live chat room session, there appeared to be only three-waves-down before upward overlap. The chart below is descriptive.

ES E-Mini S&P500 Index Futures - Three Waves Down

The ratio between the waves appears to be c = 0.786 x a, and on a divergence of the EWO, and then, in typical whippy potential triangle action, there was upward overlap, likely ruling out a typical impulse downward. The up move came as AAPL was about to release it's earnings. You'll note the highest portion of the b wave, shown, was exceeded in the after hours. 

In terms of extent, a daily gap lower was closed by today's action, and the retrace overall was about 78% of the last 'five waves up' from yesterday's post. (P.S. it was also possible to count that b wave as a triangle.)

So, we may have made part or all of sub-wave two, down, of minuet (c) , up, of minute ((d)), up of the potential daily triangle. The updated daily chart is below.


S&P500 Cash Index - Daily - Potential Larger Triangle

Technically, with cash prices still below the daily blue EMA-34, above, and with daily ES prices still below the 18-day SMA, the line in the sand, then the bias of prices is still lower.

Things will still be whippy, so be very careful. It should be clear by now that patience, flexibility and calm are some of the best wave-counting tools around at the moment.

The NQ futures actually had an outside reversal day up, and are above their daily EMA-34. None-the-less, do not be surprised by a 38% or greater pull-back beginning tomorrow or the next day.

Have a good evening all!
TraderJoe