Tuesday, May 30, 2023

Higher High Unch Close

The ES daily futures have a weird candle on this site because of the two overnight sessions. Once they get resolved, today's candle will look like a "spinning top" candle.


Prices in the overnight sessions went up to attack the upper daily Bollinger Band, traded outside of it for a bit and then closed back inside the band about unchanged, making for the spinning top candle. After-hours prices seem to be hanging below the prior close. There is a way to count a high here (involving an expanding diagonal shown in the comments for the prior post) and it can go on a bit yet, if the market deems so.

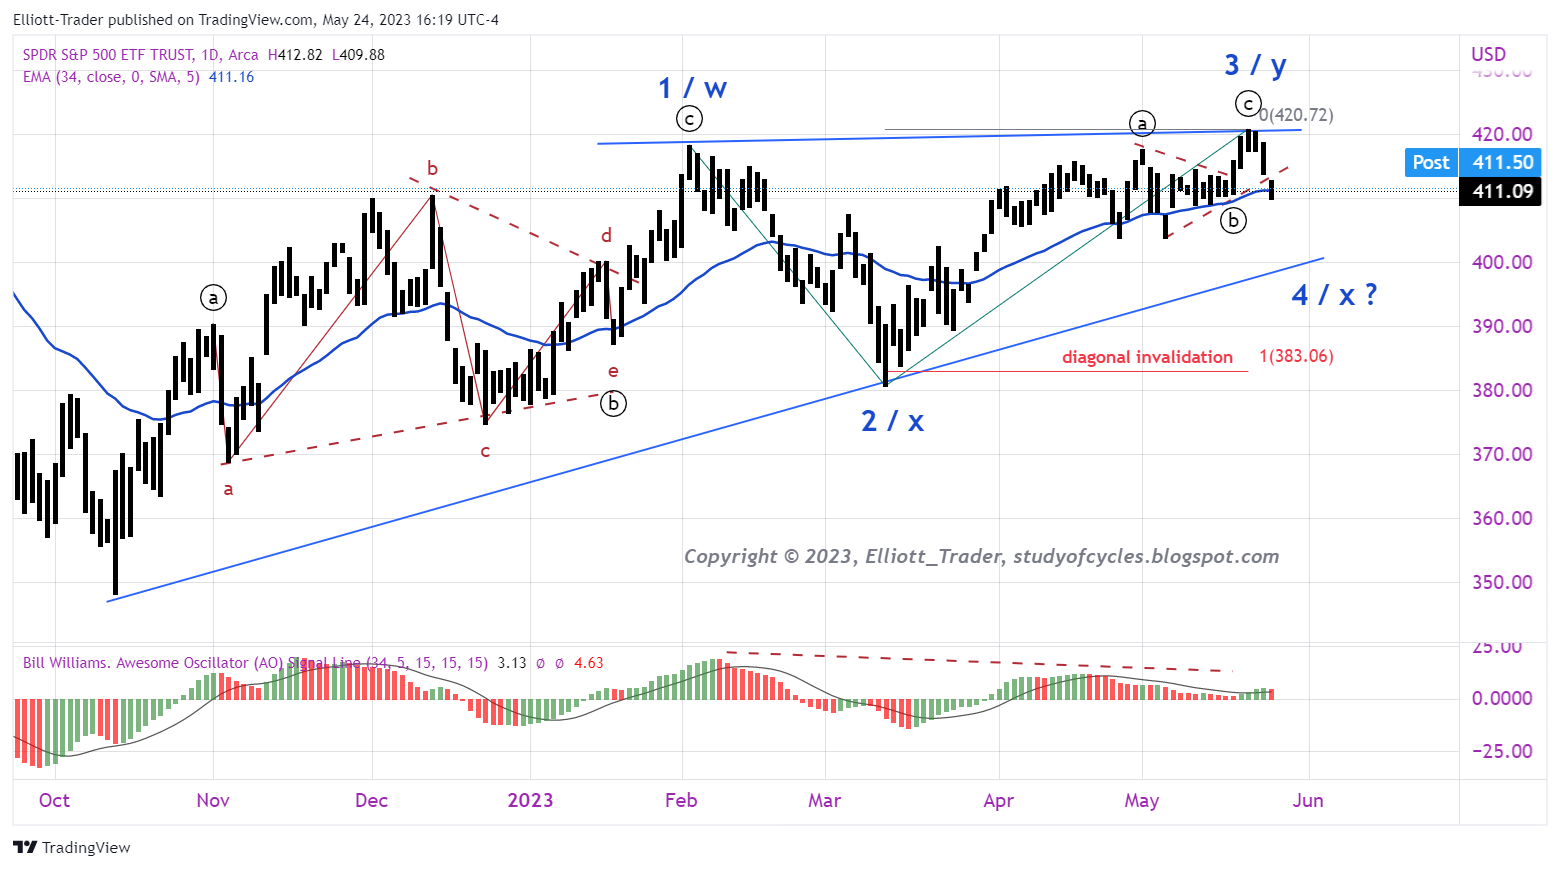
The market is waiting on debt-ceiling news and other important economic indicators due out later this week. With the newer high in the overnight, the w-x-y  or three waves of a contracting diagonal looks like the better count than the triangle. The triangle's odds are falling pretty quickly with each new marginal high.

Nothing yet says we have topped, although we may have. The NQ futures got a dragonfly doji for the sessions. As with all candle patterns a confirming candlestick is required.

It is possible news of a deal or no-deal will come at an inopportune time (sleeping, eating, exercising, working, etc.) so be careful, patient and calm.

Have a good start to the evening.

TraderJoe

Sunday, May 28, 2023

'Should' End in a Five

Here is the daily chart of the NASDAQ 100 futures (NQ). The point of this chart is that any "ending" wave, whether it is a number 5 wave or C wave or part of a 3 wave, should be a five-wave sequence.


From this timeframe I just see three-waves-up to (iii) from B/2. That means there should be a (iv) and (v) to go, even if this wave in the channel is a C wave - which ends the NQ expanding diagonal.

As the statement on the chart says, this wave up from B/2 is already longer than the A/1 wave. A further point of note is it would be very dodgy to suggest downside until the lower channel line is broken, back tested and there is a failure of that back test. A further clue to a turn would be if wave (iv) formed a triangle before the last wave or not.

Have an excellent rest of the weekend and holiday.

TraderJoe

Friday, May 26, 2023

Say That Again, Mr. Elliott ?

Ok, Mr. Elliott I get the part about the parallel channels. It is really helpful to draw those, and we definitely appreciate your observations regarding such. I do find them pretty easy to find & draw, and so they are great. Then, too, we also note those marvelous third waves where prices go berserk and make big gains in bull markets and big losses in bear markets. But something in the theory just doesn't make sense yet. Have a look at the chart below.

NVIDIA - Monthly - Log Channel

Are you seriously telling me that something worth a buck (or its equivalent) in 2004, now should be worth $389, with many analysts calling for $500 or $600 near the top of the upper channel line? Ok, look, before you get dismayed with me, this is not a case of stock envy. Why? Because Look at the chart in 2008; the price decline from $10 to 1.50 is not pretty. There must have been some very worried bankers for the company and investors. I would have been one of them.

No, what I'm asking you to explain is the wave progression since 2013 in terms of degrees. If 2005 to 2008 is the "kick-off impulse", then that wave three is totally out of control. Let's call the kick-off-impulse Primary  for the sake of argument. Then, I could see how five Minor Degree waves 1-5 are of smaller degree than the Primary degree wave. And they would make up the first Intermediate degree wave, shown as (1).

But Mr. Elliott (and Mr. Neely) that Intermediate wave is not smaller in size than that first Primary degree wave. And I've looked over this chart for a few hours now, and I just don't see how to label the internal waves differently for the third Primary wave . (As an aside, I even tried looking at the whole chart as if it is a diagonal or something other, but without overlaps it doesn't work). Mr. Elliott could you comment on this?

Smurgle, smurgle, sigh, groan under his breath. Dear Sir, the chart you are looking at is only of a single stock. I use averages in my work to smooth out the mania stocks and other outliers. And that way I get a better picture of the whole of the market and the psychology of all of the players and whether they sense progress or not. So, please don't just throw one chart at me and tell me my principle doesn't work. 

No, I'm not saying the Principle doesn't work. You correctly described that log-growth could occur in markets. What I'm questioning is this "degree thing". Let me be blunt. There are a lot of stocks out there that are widely followed. This is one of them. There's a lot of investor psychology in this stock. Think of it like a sample from the market. It seems the degree principle should work on this stock - and that of others like Apple, and many others. In other words, it seems like the concept of degree should apply the same whether one is charting the whole market or an individual widely-followed stock.

But all I can say that it is true in this chart that the Intermediate degree waves are indeed smaller than Primary , and the Minor degree waves are smaller than the Intermediate degree waves. But you only know that after the fact. And, again, that first Intermediate degree wave, is larger than that first Primary degree wave, although it is smaller than that third Primary degree wave. Could please help me out more with this topic?

Sigh... You know I wish I could, but I only lived until 1948 before I got to see some additional explosive growth in the U.S. markets - like from 1948 until 1965, or from 1982 to 1987, or from 1987 to 2000, or from 2009 to 2023. I can tell you that some of the phenomenon is due to inflation. Some of it is due to changes in interest rates. Some of it is due to allowing companies to buy-back their stock. And some of it is due to the change in currency values. But, alas, I don't have a really good answer for you at this time, and I'm supposed to be resting now.

Yeah, I get it. 

Have a good start to your holiday weekend if you are celebrating it.
TraderJoe

Wednesday, May 24, 2023

The Potential Diagonal that Does Not Have to Be

Here is the SPY daily chart in Hi-Lo format only. There is - as we have noted several times earlier - the possibility of a diagonal wave here in the SPX/SPY/ES. But, depending on the count that precedes it, it does not have to form beyond this point (just remain w-x-y) or it could fail. See below.

SPY Cash - Daily Range - Possible Diagonal

The local brown-dotted up trend line has broken lower. If there was a triangle minute-b wave, circle-b wave, today broke the e wave low of it. The next target might be the lower blue up trend line, shown for wave 4 or x. 

In terms of invalidation, a fourth wave, 4, could not become longer than the second wave 2. So, it must hold 383.06 but it would be better if it only traveled 62 or 78% of that distance to maintain the "right look" of a diagonal.

There are three counts that diagonal could form for. They are:

  1. Diagonal for Minor C of Intermediate (2), or Intermediate (B)
  2. Diagonal for Intermediate (5) of Primary ⑤ of Cycle V.
  3. Diagonal as a Leading Diagonal
In the first two cases - if the fourth wave forms properly - since these are ending structures the diagonal might complete properly with a higher fifth wave or they could fail. However, in the last case, the case of a leading diagonal, then the diagonal must complete properly with a higher fifth wave.

And, yet still, any second wave or (B) wave could just be a w-x-y wave, the double zigzag as is shown also shown.

There is also a sneaky way that the third wave, 3 / y, is not over yet, and that is if we are still making a complicated minute-b, circle-b, downward still as a flat wave. Then, there would be a larger minute-c, circle-c, wave up. So we'll have to watch and monitor as we do for any potential diagonal.

And it still goes without saying that the diagonal counts are still of concern as ending diagonals as they do not display 62% or greater retraces for their second wave. It's not required that an ending diagonal does, but it is a guideline which is currently not being followed.

So, be cautious, patient and calm and do your best with the local technical like the daily and intraday Bollinger Bands (intraday wave-counting-screen). We'll update you as best we can.

And have a good start to your evening.
TraderJoe


Tuesday, May 23, 2023

Just Asking the Question ... Long Range (Part II)

The other chart I will post for this question is the following one. What happens if one considers just the 'close-only' data for the Dow? Then, we see the following Expanding Diagonal emerges with the correct lengths of waves, and the typical expanding pattern on the Elliott Wave Oscillator.


And 5 > 3 > 1, and 4 > 2, and 4 overlaps 1. And 4 is longer than 2 in time, too. But, while this seems like cheating, it must also be still recognized that it could just as well be three zigzags downward. So, this is kind of a 'pick-yer-poison' situation, But another point to consider is that an important low really hasn't been taken out yet. Nor is there yet a low below 5 or Z. And that is what seems to allow the failure fifth option from the prior post, as well.

Again, I want to re-emphaisze I am well-aware that this count simply does not work if intraday bars on futures are used to pick the terminal points of the waves.

Have an excellent start to the day.

TraderJoe

Saturday, May 20, 2023

Just Asking the Question ... Long Range

I'm just asking the question because no one else seems to be, or seems to care, with a few notable  exceptions from readers of this site (eg: contributor BBRider, reader marc, etc.). Here is the question: 

Is it possible we had the proverbial 5th wave failure at the 78.6% retrace level in the Dow Jones Industrial Average futures (YM) on the weekly chart?

I'll let you be the judge, but it is very compelling that all waves are still in a channel, and that the failure may have occurred exactly at the mid-channel. Here is the weekly chart of the Dow futures so that all the prices are in the chart, including the overnight, etc. Note in this chart, wave (4) does slightly overlap wave (2), causing a guideline exception, but it does not overlap wave (1) and break the rule.


Much of the rationale is listed on the chart. I will reiterate that the downward count from the all-time high is impossible to explain impulsively in the Dow. There is a downward impulse variant that works in the S&P, but it doesn't follow The Eight-Fold-Path Method downward. And the non-overlapping wave upward from October to December 2022 looks like one of the most impulsive waves on the chart. And, if it were to be that (5) = (1), it would have gone over the high. It didn't. Another item of rationale is that waves (2) and (4) would show great alternation in both form and depth. That is significant.

The DOW is supposed to be the 'easiest' Index to get a count in. The Elliott Wave books (The Elliott Wave Principle by Prechter, and Mastering Elliott Wave by Neely) warn us to be on the look-out for a failure in a significant topping wave - often preceded by a deep fourth wave. Well, this is certainly a candidate.

So what is needed? First, the channel would need to break lower. Then there would need to be a back-test of the weekly channel, and then there needs to be a failure wave lower after the back-test. This would all be on the weekly chart so it might take a while.

I have not seen this analysis elsewhere. But one has to ask some serious questions: 1) WHY didn't the Dow form a legit expanding diagonal downward after the all-time-high? 2) WHY did the upward impulse wave in December of last year stop at the mid-channel? 3) WHY did the Elliott Wave Oscillator make a higher high after the running correction (2)nd wave in June - October of 2020? 4) WHY is the fourth wave uncountable as an expanding diagonal which would have made it either a (C) wave or a (1) wave? and 5) WHY is there a numbered wave on each side of the EMA-34 on this time-scale which is now 164 bars as per The Eight-Fold-Path-Method.

Is it a mess? It is. But nearly uncountable waves are often fourth waves or B waves. As a result, the option I have left open as the red alternate is that an ending diagonal (5)th wave still forms. It could. It doesn't have to. 

I keep saying to myself, the Dow is supposed to be the easiest to count. Repeat endlessly.

Have an excellent rest of the weekend.

TraderJoe


Thursday, May 18, 2023

Sloppy, Slippery, Divergent Mess

Today's higher daily high puts the upward contracting diagonal we wrote about in previous posts in solid play. The ES two-daily chart is below in line format to emphasize just the form of the wave.

ES Futures - 2 Day - Close Only

As can be seen from the Fibonacci ruler, wave Minor 3 is still shorter in price than wave Minor 1, and it is currently shorter in time, too. So, again, nothing says the upward wave, 3, is over yet. Wave Minor 3 has only done the 'minimum' it needs to in a diagonal which is make the higher daily high. The price structure of the Ⓒ wave of 3 can become more defined yet.

Price did contact the upper daily Bollinger Band today, and not much happened.  There is also a running fourth wave on the intraday chart, and that still spells some strength present. On the daily chart the slow stochastic is in over-bought territory and is not embedded.

Have an excellent start to the evening,

TraderJoe

Wednesday, May 17, 2023

Thrust from Triangle and Gap Fill

Today was likely a thrust from a slightly longer-term triangle and then a gap-fill on the SPY 2-Hr cash chart, below. The wave-counting-stop from the ES 4-Hr chart was hit today and exceeded. And the prior gap was filled.


There is now likely a 5-3-5 under construction at minimum. It could turn out to be more. The day closed with price over the 18-day SMA, so the bias has turned up. The prior high on this chart, and the upper daily Bollinger Band have thus become local targets unless the up move fails. There is nothing (overlaps, diagonals, etc.) that says the up move is necessarily over. 

However, the algos are making a real mess of the wave structure. For example, in the above chart the triangle's proportions are 90 - 98% which is exceptionally odd but legal. And it is unclear if today's gap was actually inside of the triangle or not. There is a way to see that way from a degree-labeling point of view.

A bit more wave structure is needed to better define the longer-term daily count. The downward pointing larger daily triangle and the upward pointing contracting diagonal are still both on the table. At some point one of these options will invalidate. It just hasn't as of today's close. So calm, pateience and flexibility are still needed until there is better clarity.

Have a good start to the evening,

TraderJoe


Tuesday, May 16, 2023

Parallel - So Far

So far, the down-sloping parallel on the ES 4-Hr chart is holding with a break below the most recent low, as shown below.


Keep an eye on it, and base all measurements on the OHLC version and not the close-only. The close only is shown just for the form of the pattern. From an Elliott Wave perspective remember the C wave of a much larger triangle could be located at the 01 May high.

Have a good start to the day.

TraderJoe

Saturday, May 13, 2023

Weekly Wedges

The four-block, below, shows weekly wedges in a number of different markets including equities, gold and the Eur/USD currency pair.


In each case, while prices are narrowing, there is no resolution, yet. The most likely resolution of an upward slanting wedge is a breakdown below the lower wedge line, and a re-test of the line with a subsequent failure.  GOLD looks to be the closest to this scenario at the moment. Nothing suggests than an upside resolution of the wedges can't happen, but it is the less common scenario on this time scale. 

Upside resolution of wedges happens most often on intraday timescales as first waves and A waves are being built for corrections.

While prices are being squeezed in a wedge calm, patience, and flexibility are required.

Have an excellent start to the weekend.

TraderJoe

Thursday, May 11, 2023

Still Sideways - 2

On the daily chart of the ES futures, below, today was just an inside day with a lower close. It is hard to make too much more of it than this.

ES Futures - Daily - Battle at Line-In-The-Sand

Price is stuck pretty much at the 18-day SMA, ('fighting a battle at the line-in-the-sand'). So far, the daily pattern has lower daily highs, but still would require lower daily lows to establish a down trending swing-line pattern with the bias down.

The Bollinger Bands are traveling sideways as are the 18-day SMA and the daily slow stochastic. The daily advance-decline line lost a bit more ground, and volume is mediocre.

Tomorrow is Friday, and it will be interesting to see if the trend of 'every Friday up' is continued or broken. Economic reports due out include information on import & export prices and Consumer Sentiment.

From an Elliott Wave perspective, nothing yet has broken the pattern of a daily triangle with downward resolution, or the alternate of a daily contracting diagonal with further upside to go.

So far - on the slightly shorter term - the SPY cash 4-Hr tentative channel we have drawn in has been respected. See the prior post for more information at this LINK.

Have an excellent start to the evening,

TraderJoe


Tuesday, May 9, 2023

Still Sideways

Volume dried up a bit in front of tomorrow's CPI report. Prices moved sideways-to-lower for the day. The pattern could be a triangle, or devolve into a Flat, or even further into an expanding diagonal lower. The SPY cash 30-minute chart shows it well enough. Today's opening gap down was not filled in the cash session.


The Elliott Wave Oscillator went below the zero line this morning. Tomorrow's CPI report and Thursday's PPI report may help better define the price movement.

Have an excellent start to the evening,

TraderJoe

Saturday, May 6, 2023

The Daily Triangle Option

Below is the daily chart of the ES June Futures contract (close only) showing the plausible sideways triangle count.

ES Futures - Daily Close - Potential Triangle

This count is suggested at this time (rather than the upward diagonal count from the B wave low) because usually the first wave up of a diagonal occurs over the prior high (the A wave) to show its character as a motive wave. That has not happened yet. So far price has stubbornly refused to stray too far from the 78.6% retrace level of the B wave down. If price does break the A wave high, we will keep our options open and flexible. But further, the third wave in a diagonal is required to make a higher high, and it has not done that yet, either.

Meanwhile, the daily MACD is drifting near the '0' line, which many times is the sign of a triangle. As always, the triangle invalidation level in this count is above the A wave. Also in favor of this count is that in a triangle either the C or the D wave is the complex leg of a triangle. This extremely complex sideways and time-consuming wave seems to fit for a C wave. Remember, the very purpose of triangles is to move price sideways and consume a lot of time.

The D & E waves shown are placeholders only. The D wave might typically be expected to retrace 78% or more of the C leg. That would be a summer swoon scenario. Often, trading gets light and sloppy in the summertime as volume dries up and the big players get busy polishing their yachts before the sailing season begins, and others take the kiddies on summer vacations in general.

IF the triangle plays out, it would be the "running triangle" variety, with the lower B wave, and it would signal a decline following the completion of the Intermediate (B) wave.

Have an excellent rest of the weekend.

TraderJoe

Thursday, May 4, 2023

Gap Lower, Lower Low Day

Prices as measured by the SPY cash 30-min chart again gapped slightly lower today, and then made a new daily low below the level of 26 April, as per the chart below.


After the lower low, prices rebounded a bit but did not close the opening gap before putting on a drift sideways for the last couple of hours of the cash session. This may have been because daily ES futures prices were trading directly on the lower daily Bollinger Band with the daily Slow Stochastic in over-sold territory.

Prices are still below the EMA-34 on this time scale, and the Elliott Wave Oscillator (EWO) is still below the zero line. Wave counting is still a bit of a mess, but the down waves could fit with either a fourth wave today or a nested (i), (ii), i, ii inside a third wave structure, including a larger 'C' wave lower. 

The wave structure can still have some surprises as a number of tech earnings including AAPL are out after the close, and monthly Payroll Employment Report is tomorrow morning. Calm and flexibility are still required.

Have an excellent start to the evening,

TraderJoe

Wednesday, May 3, 2023

Fed FOMC Fuel Fizzles

As was reported in the prior post, CNBC thought the bulls had been thrown a bone in the FOMC statement today, where the wordage in the statement eliminated the near certainty of further rate hikes (see comments in prior post if interested). One would have thought that - if the comments were perceived as overtly bullish - then prices would have at least popped to fill its prior gap lower, if not make an outright higher high. The market participants had different ideas and not only was a new daily high not made, but the gap wasn't even able to be filled. In fact, on the SPY 30-min chart below, prices got no higher than the 62% retrace level before turning lower again.

SPY Cash ETF - 30 min - Lower Low

Prices today traded in the short-term channel shown in a complex wave with local higher highs. A total of three up (green) fractals, and two down (red) fractals were formed in the channel on this time scale. Based on yesterday's end-of-day analysis of a likely 'five-up', we said higher wave peaks could occur. They did. Toward the end of the press conference prices broke the channel lower and then proceed to bust both of the down (red) fractals lower. So, short-term, the market has made lower highs and lower lows.

As long as this continues prices then would be down trending. Let's see if impulsive behavior to the downside can continue to break the 403 level prior low in the SPY cash and begin to form a motive wave lower. Barring that, the alternate is some kind of flat wave or a triangle at this or a slightly lower level.

Have an excellent start to the evening.

TraderJoe

Tuesday, May 2, 2023

Gap Lower - Nothing Brutal Just Yet

The SPY 30--minute chart is below. There was a gap lower this morning, and lower lows followed in fast form. This was not at all unexpected.


But price only got to about the 62% retrace level of the prior up wave before deciding to stall out and start an upturn. So, as of this point, while the downside has been tweaked, there hasn't been too much to write home about yet.

You see, for a 'motive' wave lower, one wants to see it have enough power to break a prior low. So far that hasn't happened just yet. We want to see that prior low undercut as stated before and again shown above prior to labeling the down move.

The up-trending wave after the low can be counted as five-waves-up, so there might be another up wave to follow after some consolidation. We'll see.

Tomorrow is the FOMC report and press conference to follow. So, it can be a day full of whipsaws which argues for patience, caution and flexibility at this time.

Again, for now, nothing to the downside will surprise me. The weekly wave sequence can still be counted as Intermediate (A)/(1), (B)/(2) where (B) can become a triangle, or (2) might end with an ending diagonal C wave. However, this last scenario still needs a higher high third wave in the ES. The NQ ending diagonal can be considered completed however.

Have an excellent start to the evening,

TraderJoe