As we showed in yesterday's post, mighty SPY cracked the high by a 'tiny' amount. And while possibly still in a barrier triangle or a Flat wave four, the higher high was enough to prove the case that, way back in June 2020 we called the correct degree waves. With this higher high, on the weekly chart, this Primary wave up is now longer in both price, and now, time than the prior Intermediate up wave. You can view the original call here in this post called Trillions (LINK1), and see the update on the timing at this post called Primary Week (LINK2). And now we note that some analysts - who didn't even call such things - who didn't go out on the limb to put their reputation on line - sensing a top is near, are now trying to rush the count to try to count a contracting ending diagonal where one is, by Rule, not present!
In our two-day chart, of the ES futures, there is simply no need to break the rules or the definition of wave degrees to count the upward wave in the context of Intermediate (Y) = Intermediate (W) for the Primary ((B)) wave.
 |
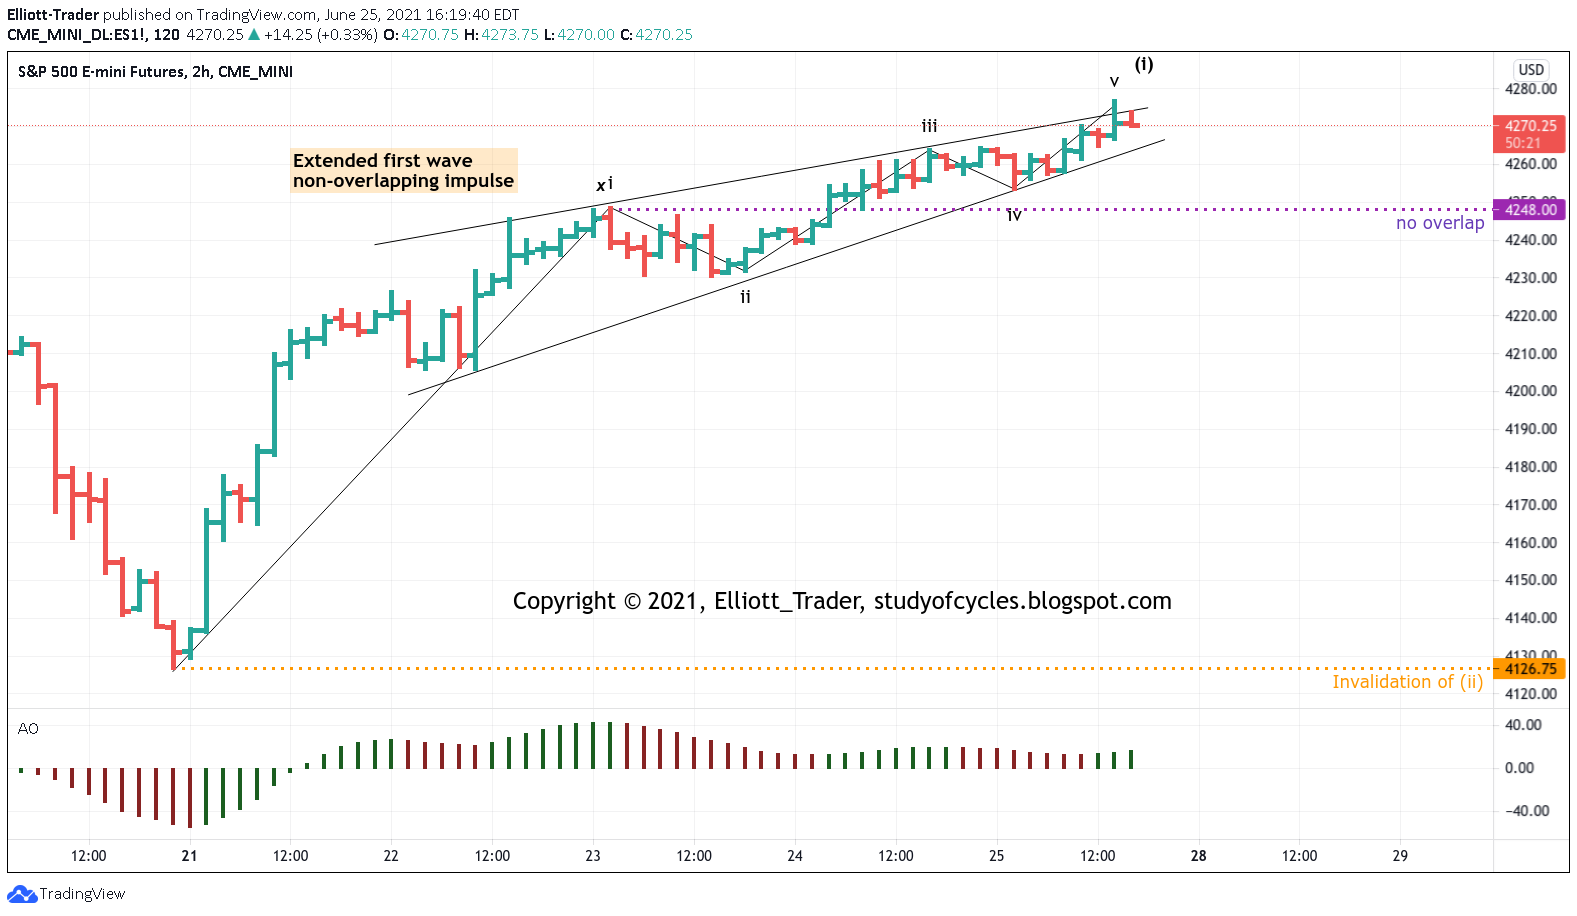
ES Futures - 2 Day - Wedge
|
Note in the above chart, that each wave is well-described and does not break any rules. Further, within Intermediate (Y), wave Minor A is shorter in price and time than the previous larger degree Intermediate wave (W), up, in the same direction as Minor A. So, minor A is a valid subwave. Then, Minor B is shorter in price and time than all of Intermediate wave (X), down, the prior larger degree wave in the same direction (down). finally, minute wave ((i)), and ((iii)), up, are shorter than all of Minor A, the prior larger degree wave in the same direction (up). So, they can be valid subwaves as well.
Further, within Intermediate (W), wave Minor A is an impulse. Yet, in Intermediate (Y), wave Minor A is a contracting diagonal wave. We always called it that way: it was just a question of its starting and ending points. It represents excellent alternation within corrective waves. Now, with Intermediate (Y), since Minor A is a diagonal, Minor C should be an impulse to further that pattern of alternation.
Again, there is no reason to break any rules or degree definitions. And, notice that Intermediate wave (Y) is, in fact, longer in time than Intermediate wave (W). This necessarily means that the two waves 'must' be of the same degree (or else, the former wave is of one degree higher). For now, and primarily because Intermediate (Y) is shorter in price than Intermediate (W), we think the two waves are of the same degree.
This count has been a long time in the making. It has taken an extreme level of patience. We thought some of the corrections might be larger than what they turned out to be. They didn't. But, still, we did not let it affect the wave count. It is still not likely done yet, and we never did call for a crash. Right now we see the possibility of wave ((iv)) of Minor C forming a barrier triangle and, while likely, we will look for other alternates that make sense if any should.
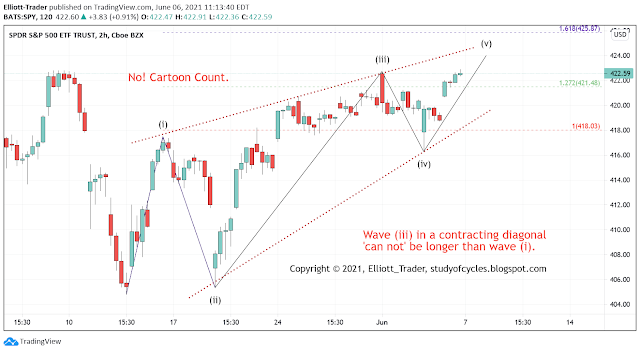
So, where are these analysts breaking the rules? In calling a contracting ending diagonal, they are trying to count it this way.
 |
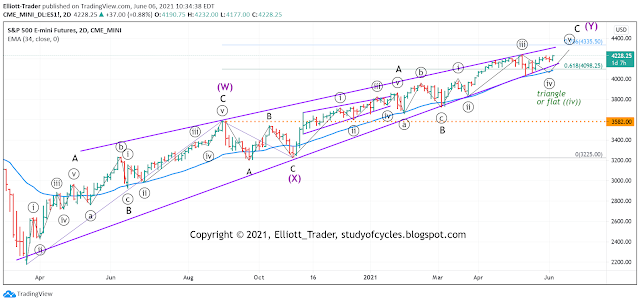
SPY Cash - 2 Hr - NOT a Contracting Diagonal
|
They see a wedge. They see overlap. They want to get the count over. So, they break the rules! In case your eye can't judge it, we show the Fibonacci ruler. Clearly, wave (iii) is more than 1.272 x wave (i), but even one click would do it! It's just wrong.
I dropped a link to a YouTube video showing such a count at the end of yesterday's comments. The real question is IF an analyst is going to break the Elliott Wave rules, then why even bother to say that what one is doing is counting using Elliott Wave at all!
Have an excellent rest of the weekend.
TraderJoe