Tuesday, January 31, 2023

"And I wonder ..." - 2

This is just a continuation of the prior post. The chart below is the ES weekly bar chart. The triangle option mentioned in the prior post is sketched out, below for the ES.


If you were following markets today, you know that almost everything has been slowed down or is very whippy waiting on the results of the FOMC decision and press conference tomorrow. This is possibly a triangle with odds about 50-50 right now. More-or-less make-or-break. The retrace today was on the order of 78.6%, but we don't know upward movement is done. The weekly EWO is quite flat and reminiscent of a triangle.

Clearly, I don't know whether this will happen or not. But a triangle formation often precedes the last wave in a wave set, and a minute ((b)) wave can certainly be a triangle.

Have a good start to the evening.

TraderJoe

Saturday, January 28, 2023

"And I wonder ..."

With all apologies to the Foo Fighters lyric from the song Everlong, the lyrics were rolling around in my head this weekend while a number of us have noted that one of the down-trend lines from the high has been modestly broken to the upside. This can happen in a fake out, and it is not too much to worry about at this time.

However, when such things happen, it is often a sign to look out for triangles or diagonals. Remember, we said the minute ((b)) wave in the ES 'could be' a triangle. There is not much of a sign of one yet, except for the broken trend line. But I decided to look that the Nasdaq 100 and see if it offered and clues. The pattern below on the weekly chart might prove interesting.

NQ 100 Futures - Weekly Close - Contracting Pattern

As far as I can tell, even if there is a modest truncation at the high, or not, then the pattern might resolve as a 5-3-5-3-5 Diagonal. As things stand, the only thing weird about it would be that wave 4 would be relatively long in time compared to wave 2. But the measurements are still ok, for now. And it is in a possible fourth wave position, so one might give it some leeway.

Whether the pattern completes properly or not is probably in the hands of the Smart Money. But one of the things this proposal does is provide a hard cut-off for invalidation. Since in a contracting diagonal wave 4 cannot become longer in price than wave 2, then any weekly close over 13,025 before making wave 5, down, would likely invalidate the pattern.

A new lower low is possible. It could be roughly as long as wave 3 but doesn't have to be as long as a new low were made, and the wave did remain shorter than 3. And it should be made in five-waves. But, at this point it is just a conjecture, not a certainty. Five waves down from here in the NQ would match up well with wave minute ((c)) in the ES, if that is to occur. So, we'll see.

For this pattern to become a "leading" diagonal, it would have to make a new lower low - at least on an intraweek basis. Not so, if it is an ending diagonal (with three-wave segments instead), but still should terminate near the lower trend line.

This is the second post since Friday, and if you have not seen the first one, you may wish to have a look at it now.

Have an excellent rest of the weekend.

TraderJoe


Friday, January 27, 2023

Proposal for (ii)

Today on the SPY 30-minute chart, we were working on a potential diagonal wave. So far, the measurements fit. IFF (and it's never certain) the measurements do, in fact, work out, then in what position exactly is the diagonal wave? The ES 8-hr chart below proposes that today's diagonal would be the micro ((C)) wave, of Subminute y wave, of blue minuet (ii) wave.

ES Futures - 8 Hr - Up Wave Count

There are five reasons for this:

  1. The wave clearly fits in a near perfect channel. This is usually a sign of a corrective wave as we addressed in yesterday's post.
  2. The MACD might diverge on this wave. That remains to be proved.
  3. The ((C)) wave of w is just about 1.618 the length of the ((A)) wave of w.
  4. The x wave is the deepest wave of the lot. So, from a degree standpoint, it has the highest degree of the downward waves.
  5. The MACD signature does not look like the characteristic of an overall diagonal wave.
That's what we conclude and why. Have a very good start to the evening.
TraderJoe

Wednesday, January 25, 2023

Diagonal Detail

Here is the ES Daily Chart in wave format. The waves from Minor 3 have been labeled in detail. Most recently the market has broken the dotted purple uptrend line with an impulsive wave lower. Since then the market has lurched and hacked higher in another choppy channel.


The blue (i) (ii) ? wave labels on the right are tentative until there is a lower low. The alternate is that a slightly higher high minute ((b)) wave might be made, but that alternate is not activated yet, and is not a factor until or unless there is a higher high, first.

Have an excellent start to your evening.

TraderJoe

Monday, January 23, 2023

Slightly Higher High

The daily chart of the ES is below. Today broke the prior high eliminating the nested (i), (ii), i, ii count for now. It is certainly possible that wave (ii) is extending, but it is not for certain.


In other words, today and maybe tomorrow 'may' prove to be a false breakout. But there is nothing lower until the fractals at the lower edge of the up channel are broken and there is a back-test that fails lower.

But, be careful, patient, and flexible.

Have a good evening,

TraderJoe

Friday, January 20, 2023

Just a Chart

This chart of the ES 30-min futures shows wave action so far as it is available at the futures close of the regular trading hours session is below. The purpose of this chart is to attempt to show the wave with degree labeling in tact, with Fibonacci ratios that make sense, and with alternation in a corrective wave.


The b wave is short in both price and time, which makes a zigzag a bit more likely. The wave can travel higher as wave ii provided it does not invalidate.

Have a good start to your evening.

TraderJoe

Thursday, January 19, 2023

Back to the 18-day SMA

On the daily chart, the ES returned this morning to the 18-day SMA, "the line in the sand". Readers of this blog should verify this as they wish. The down move looks impulsive and maybe counted as the extended first wave ("falling knife") count. The SPY 15-minute chart shows this count below. For cash, the day started with an initial gap, lower. Wave ((5)) is then shorter than ((3)) which is shorter than ((1)) in the downward direction.


After the morning low, there were three waves up in a channel, including a diagonal we counted out in real time on the SPY 3-min chart. Towards the end of the day, the channel broke lower, and so we don't know if a longer second wave ii would be made by a flat, an expanded flat or a double zigzag upward - or if it is done already. The overnight futures might be watched for some clues. I don't think the upward wave is a fourth wave as it would seem disproportional and break the wedge shape (the "falling knife" shape) that Neely indicates the extended first wave counts exhibit. And, if it is a second wave it can take more time relative to the downward wave and travel more towards a 38% retracement or higher.

Have a good start to the evening.

TraderJoe


Tuesday, January 17, 2023

ES Spinning Top at 62%

In tracking the hourly wedge upward, we said another new high could be made today. It was. That brings the ES to the 62% retrace level in twice the time (14 days up) of the down wave (7 days down). And there is a "spinning top" candle at the high. The daily ES chart is below.


Yes, there is a possibility of a further high, but not of much length. As Neely indicates, the further beyond 62% the up wave goes, the lower the odds of it remaining a second wave become.

Beyond that there is not too much to say except that like all candle patterns, the spinning top would require a significant closing lower candle to confirm it. The PPI report is currently scheduled for tomorrow morning, so take appropriate care.

Have a good start to your evening.

TraderJoe

Saturday, January 14, 2023

Legal, But Difficult

The lurching, jerking upward wave can be analyzed using The Eight-Fold-Path Methodology as shown on the ES hourly chart below. With 120+ candles on the chart, the Elliott Wave Oscillator (EWO) clearly shows a second wave and a fourth wave with the EWO below the zero line. The type of wave is the First Extension (xi) Terminal, also known as a Contracting Diagonal.

ES Futures - Hourly - Contracting and Overlapping

The first wave, i, is longer in price than the third wave, iii, but the third wave is longer in time than the first. The time taken by iii in this arrangement is atypical and somewhat contrary to guidelines. But the overlapping fourth wave rules the count. 

The pattern gives a clear invalidation for wave iv, and that level is 3,939.75 and it also gives a clear invalidation for wave v in that the fifth wave may not become longer in price than the third wave. At the end of the wave, wave v should also show further divergence on the oscillator. Let's see how things work out.

Have an excellent rest of the weekend.

TraderJoe

Thursday, January 12, 2023

Gap Closed or Not ?

The cash gap on the S&P500 Index was closed today. The cash gap on the SPY ETF was not. So, is the gap closed or not? It's really not a question. The gap could close or not. From a wave-counting-standpoint the SPY wedge did make a higher high today, and then it got very overlapping after mid-day. Here is the hourly chart of the SPY.


This is the same wedge we showed as possible in the ES, yesterday. This chart is just crisper in its look. It is possible a top occurred today. But the overlaps toward the end of the day could as well be a triangle with a further wave up, and possibly the last wave, ahead.

Note the overlap warning has been triggered and a fifth wave ((5)) would need to remain shorter than wave ((3)). Price is up against the daily Bollinger Band, and that is another concern for significant further up movement.

Have a good start to the evening.

TraderJoe

Wednesday, January 11, 2023

Possible Hourly Wedge

We found some interesting shenanigans during the afternoon session that led us to conclude a triangle might be forming on the 2-5 min charts. The triangle did form, and the result was a thrust out of the triangle on the short-term charts. Backing off to look at the ES hourly chart, with the prices we currently have, we note that a wedge shape is currently seen, and this is occurring with the new high on both an oscillator and a volume divergence. The new high on the daily chart did get the ES beyond the 50% retrace level as we suggested might happen. Yes, it could still go further.


We can only see what we can see. The wedge shape has a third wave at 0.618 x the first segment, so far. Because the trend lines are tentative, we don't fully know yet whether the wedge will hold up under the CPI report tomorrow. It certainly could. It does not have to. 

Be patient. After days & days GOLD futures (GC) finally broke down under a fourth wave triangle, and then retraced 62%. See the comments in the prior post for details.

Watch them both carefully. Have a good start to the evening.

TraderJoe

Tuesday, January 10, 2023

Frustrating and Choppy Counting

The daily chart of the ES futures is below. It's hard to be immune from the rather constant chop in both directions, up and down, in the wave count. For perspective, take a step back and recognize that the ES futures have not yet made a 50 nor a 62% retrace on the down wave. They could.


We have only counted two zigzags in the upward correction, so far. We also posted a way for the second zigzag to move a bit higher if this morning's low is labeled as a 'b' wave. That could mean an additional 'c' wave up could follow.

But price has indeed bounced up off the 18-day and 100-day SMA's. Those need to be respected until they should again be crossed below. But the daily Bollinger Bands are beginning to narrow. And sideways, choppy action might be expected until an eventual breakout or breakdown. Further the daily slow stochastic is over-bought without being embedded. So, the way Ira teaches it, the "Smart Money" may look to come out of positions at the upper daily band.

One should not be surprised if prices want to bang around inside narrow bands for a while. If there is to be a decent trend, it often starts out from narrow bands. Price may just be waiting for the economic reports to provide cover for a decent move.

Have a good start to the evening.

TraderJoe

Monday, January 9, 2023

Fumble at the Fifty ?

Overnight the ES futures were higher after only a very shallow retrace. As a result, the cash SPY opened with a gap upward. After opening higher, prices traded higher until about 11 AM. Then, on as light a volume downward as cash prices made their upward move, they began heading downward to ultimately close the gap before the close. The SPY daily chart is below.

SPY Cash - Daily - Spinning Top Candle?

Three things can be noted:

  1. Today's candle qualifies as a "spinning top" candle but needs closing lower validation.
  2. The SPY got up to the resistance of the prior November lows, crossed the 50% Fib & 50 SMA.
  3. The MACD has not crossed above the zero line yet.
So, first things first. Let's see if the high of this daily candle holds, and if gets a substantial closing lower candle. If so, the next step would be to see if the December low is exceeded lower. If so, it may be possible to get a 1.618 wave because the potential wave ii up exceeded the 50% level - at least in cash. Then see if the MACD crosses lower beneath the zero line again.

In a similar situation with Gold (GC) futures which made a higher high and a doji on the upper daily Bollinger Band.

This would seem to be a good time to pay close attention to these markets. Have a great start to the evening.

TraderJoe

Saturday, January 7, 2023

Divorce

I wrote an entire post cautioning that the consolidation at the recent ES futures low could as well break upwards as well as downward. The title of that post (which can be viewed at this LINK) was, "Woo A Potential Triangle, Don't Marry It". Friday was an example of the reason why. Even though the pattern had converging trend lines, until Friday, the dimensions of the triangle having greater than 80% legs certainly raised eyebrows. Triangles typically have 62% or 78% legs if they are contracting triangles. This one didn't.

So now, we likely have a wave (ii) up or a wave b, up. For details on this, read further.

The weekly chart of the ES futures is below. The entire down wave is already longer in price and longer in time than the Covid-19 downwave of 2020. This means the entire structure should be of the same degree or else it is one degree higher than the 2020 decline. If the 2020 decline was Intermediate (C) of Primary [A] down, then this structure should at least be Intermediate (1), down. Intermediate (1) down should be composed of five Minor degree waves, 1-5, and those are what are shown on the chart.

ES Futures - Weekly - Potential Expanding Diagonal

The five minor waves are each composed of Minute degree zigzags labeled ((a)), ((b)), ((c)): remember that (( )) double parentheses is how the circles are shown in text for circle-a through circle-c.

And, of course, there is a rub. Minute ((c)), circle-c, of Minor 5 - if it does complete properly - can either be an impulse or it can be a diagonal. In general, C waves in a zigzag can be diagonals provided that their A waves are not as given by the Principle of Alternation for corrective waves. In this case, Minute ((a)), circle-a, is a regular impulse, so C can be either an impulse or a diagonal. In the case of the impulse, we are showing in the above chart that a 1.618 wave - even from the trend line boundary - could make a lower daily low.

But because the diagonal is also a possibility, we must unfortunately show the confusion, below, until there is more information.

ES Futures - Daily - Ways to make Minute ((c))

The panel on the left shows the impulse count as Minuette degree blue (i), (ii). The panel on the right shows the potential diagonal count in which Minuette degree red (i) is not even completed yet.

Unfortunately, there won't be too much to write about these counts until/unless there is a lower low without invalidation having happened first. All we can say is that the up wave on this daily chart is now longer in time than the down wave, and that it has reached slightly beyond the 38.2% retrace level. For a 1.618 wave downward, one might like to see a 50% or more retrace upward. We don't know if/when/how that will happen, but it certainly can. But it does not have to. Prices could fall straight-away if they want.

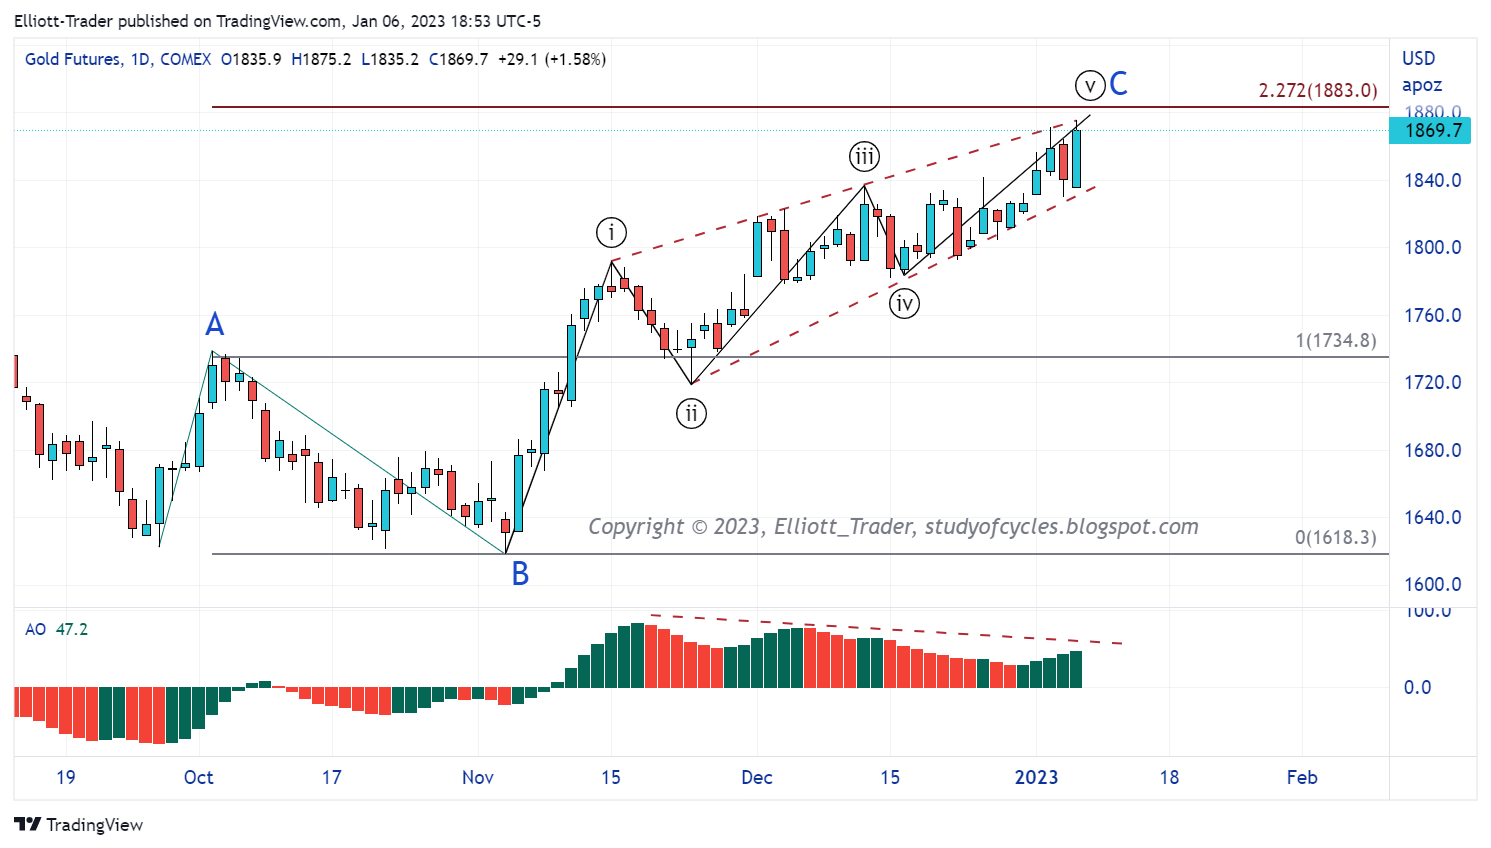
So, we'll move on to GOLD where the daily diagonal is still in play, as below.

GC GOLD Futures - Daily - Potential Contracting Diagonal

The wave is currently near the C = 2.272 x A Fibonacci relationship. If it holds, the diagonal will not invalidate. Invalidation is somewhere near 1900 - 1910 depending on exactly where Minute degree wave ((iv)), circle-iv, is placed. I have it currently placed at the lower-most extreme. It might be the large red bar to the right, as a truncation. Time will tell. Bottom line: a further higher high is possible.

On Thursday, I showed this downward diagonal (picture at this LINK2) and said it could be leading or it could be ending. Because one higher high was made, it is possible to conclude that the diagonal was a Sub-Minuette wave c, of a Minuette wave (iv) of possible Minute wave ((v)), up, of Minor C. Again, this shows how "c" waves can be diagonals, and one has to be flexible with them.

Again, that is what we tentatively conclude. We must allow that even the whole up structure could be a leading diagonal. But regardless of these two cases, there should at least be a retrace of a substantial amount of the rise, if not an out-and-out new low.

From a trading perspective GOLD is above it's 18-day SMA, so the daily bias is still positive. Keep that in mind, even with the divergence on the Elliott Wave Oscillator (EWO or AO), shown.

Have an excellent rest of the weekend.

TraderJoe

Thursday, January 5, 2023

Plausible Count in Daily GOLD - 2

Here is a brief follow-up on the potential contracting diagonal in daily gold. Prices should be watched to see if the current bearish engulfing candle is maintained for the day.


The hourly chart has a valid expanding diagonal off of the highs as below. This suggests - at the very least - monitoring the high to see whether it is maintained or not.


At the present time, the potential daily contracting diagonal is seen as 'ending' at C = 2 x A. Only if price gets above the high should it be considered as a candidate for a leading diagonal. The current hourly expanding diagonal needs to prove it is 'leading' with lower daily lows or it may be ending.

Have an excellent start to the day.

TraderJoe

Tuesday, January 3, 2023

Plausible Count in Daily GOLD

A daily diagonal in GOLD may be done or near done. Right now, a Fibonacci relationship of C = 2 x A can be seen.


Divergence with the Elliott Wave Oscillator (EWO or AO) exists particularly at the new high. Further, price is above the daily Bollinger Band, with the typical ~5% chance of staying above the band.

The ES depends a little bit on the open and possible inflows, but the wave ii count, up, is getting more and more probable in that market.

Reminder: there is economic data until 10 AM ET.

Have an excellent start to the new year!

TraderJoe