I wrote an entire post cautioning that the consolidation at the recent ES futures low could as well break upwards as well as downward. The title of that post (which can be viewed at this LINK) was, "Woo A Potential Triangle, Don't Marry It". Friday was an example of the reason why. Even though the pattern had converging trend lines, until Friday, the dimensions of the triangle having greater than 80% legs certainly raised eyebrows. Triangles typically have 62% or 78% legs if they are contracting triangles. This one didn't.
So now, we likely have a wave (ii) up or a wave b, up. For details on this, read further.
The weekly chart of the ES futures is below. The entire down wave is already longer in price and longer in time than the Covid-19 downwave of 2020. This means the entire structure should be of the same degree or else it is one degree higher than the 2020 decline. If the 2020 decline was Intermediate (C) of Primary [A] down, then this structure should at least be Intermediate (1), down. Intermediate (1) down should be composed of five Minor degree waves, 1-5, and those are what are shown on the chart.
 |
| ES Futures - Weekly - Potential Expanding Diagonal |
The five minor waves are each composed of Minute degree zigzags labeled ((a)), ((b)), ((c)): remember that (( )) double parentheses is how the circles are shown in text for circle-a through circle-c.
And, of course, there is a rub. Minute ((c)), circle-c, of Minor 5 - if it does complete properly - can either be an impulse or it can be a diagonal. In general, C waves in a zigzag can be diagonals provided that their A waves are not as given by the Principle of Alternation for corrective waves. In this case, Minute ((a)), circle-a, is a regular impulse, so C can be either an impulse or a diagonal. In the case of the impulse, we are showing in the above chart that a 1.618 wave - even from the trend line boundary - could make a lower daily low.
But because the diagonal is also a possibility, we must unfortunately show the confusion, below, until there is more information.
 |
| ES Futures - Daily - Ways to make Minute ((c)) |
The panel on the left shows the impulse count as Minuette degree blue (i), (ii). The panel on the right shows the potential diagonal count in which Minuette degree red (i) is not even completed yet.
Unfortunately, there won't be too much to write about these counts until/unless there is a lower low without invalidation having happened first. All we can say is that the up wave on this daily chart is now longer in time than the down wave, and that it has reached slightly beyond the 38.2% retrace level. For a 1.618 wave downward, one might like to see a 50% or more retrace upward. We don't know if/when/how that will happen, but it certainly can. But it does not have to. Prices could fall straight-away if they want.
So, we'll move on to GOLD where the daily diagonal is still in play, as below.
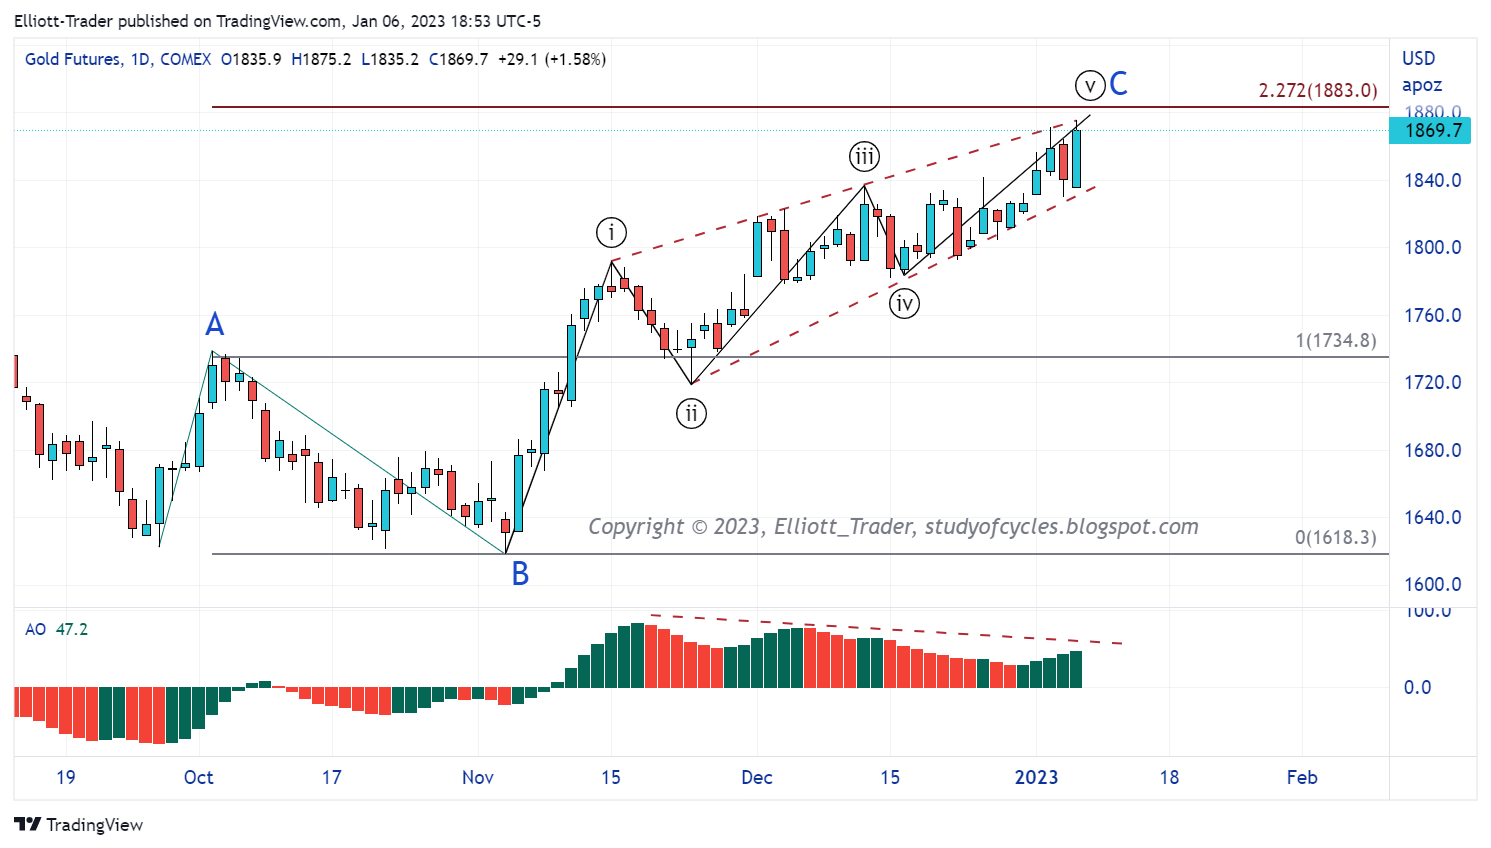 |
| GC GOLD Futures - Daily - Potential Contracting Diagonal |
The wave is currently near the C = 2.272 x A Fibonacci relationship. If it holds, the diagonal will not invalidate. Invalidation is somewhere near 1900 - 1910 depending on exactly where Minute degree wave ((iv)), circle-iv, is placed. I have it currently placed at the lower-most extreme. It might be the large red bar to the right, as a truncation. Time will tell. Bottom line: a further higher high is possible.
On Thursday, I showed this downward diagonal (picture at this LINK2) and said it could be leading or it could be ending. Because one higher high was made, it is possible to conclude that the diagonal was a Sub-Minuette wave c, of a Minuette wave (iv) of possible Minute wave ((v)), up, of Minor C. Again, this shows how "c" waves can be diagonals, and one has to be flexible with them.
Again, that is what we tentatively conclude. We must allow that even the whole up structure could be a leading diagonal. But regardless of these two cases, there should at least be a retrace of a substantial amount of the rise, if not an out-and-out new low.
From a trading perspective GOLD is above it's 18-day SMA, so the daily bias is still positive. Keep that in mind, even with the divergence on the Elliott Wave Oscillator (EWO or AO), shown.
Have an excellent rest of the weekend.
TraderJoe
Nice work TJ, thank you for the update, seeing that ES poked above the daily 18 period moving avg. Friday, we could easily get to the upper Bollinger band post haste and possibly squeeze to test the weekly downtrend line.
ReplyDeleteSuch is possible, not required, & welcome. TJ.
DeleteTJ i'm a long time viewer, first time poster. Thank you for your work !!! I enjoy reading your posts on ES. This bear market has been very frustrating to bulls & bears as there hasn't been any capitulation. It feels like 2022 saw more rallies than the 2000-01 or 2008-09 bear markets. VIX has been between 20 and 33 all of 2022. Do you anticipate a vix explosion / capitulation with this next leg down ?
ReplyDeleteHi Jim, and welcome. Yes, that would eventually make sense. TJ.
DeleteFantastic work, many thanks! 🙏
ReplyDeleteThanks for the update. ES looks to be in a simple corrective channel.
ReplyDeletehttps://imgur.com/c4GsoHA
ES 30-min: intraday wave-counting screen. The intraday bias is currently lower, and the daily bias is currently higher. The two are fighting each other. Let's see if there will be any fractal breaks.
ReplyDeletehttps://www.tradingview.com/x/09Xl1jO2/
It is possible to consider that one wedge (lower trend line from 9 am yesterday to 9 am today) has broken down, which would be an a,b,c. But there would need to be validation of same from an up wave that does not go over the high. The lower band is a possible short-term target. And, yes, it could still get whippy.
TJ
The prior three down (red) fractals have now broken lower. TJ.
DeleteHere is the chart update showing the three fractal breaks, the potential wedge (lightly sketched in for now) and the plausible a,b,c count. To me, the give-away might be the exceptionally shallow overnight retrace.
Deletehttps://www.tradingview.com/x/YeEPZHoC/
Best alternate? b is a Flat, and c would make another high.
TJ
SPY 15-min: the opening gap has not been filled yet, but could. Clearly this downward wave is the longest in price & time since vs cash since the up wave began.
ReplyDeletehttps://www.tradingview.com/x/T7D2mQkz/
TJ
..volume has been pretty light all day. TJ.
Delete..the SPY opening gap is now filled.
Deletehttps://www.tradingview.com/x/4vvoKcCl/
TJ
ES 30-min: fourth down (red) fractal back has been exceeded lower. TJ.
ReplyDeleteLooks like another false breakout like when they jammed it up to 4183.75
ReplyDeleteA new post is started for the next day.
ReplyDeleteTJ