Sunday, April 30, 2023

ES in Triangle or Diagonal ?

If the NQ daily futures can be viewed as an expanding diagonal (see Friday's post link HERE), then it is possible the ES (two-day chart, below) might be in a double-zigzag pattern - which might still be internal to a triangle.


We don't know yet. The upward structure in the ES is still unresolved, and the FOMC results on Wednesday will have a lot to say about it. So, the counts for the double-zigzag (black) and the alternate diagonal (red) are shown. The prior up wave Ⓦ was at the 78.6% level (Fibonacci ruler shown), and a marginal new high would still keep a triangle pattern possible. 

We will have to see, but, at the present time the wave structures appear to be composed of overlapping threes and not impulsive fives. Further, price is still inside the Aug 2022 high. That could change, but it hasn't yet. The trend lines of the pattern are still tentative as there are only two touches on each side.

Have an excellent rest of the weekend.

TraderJoe

Friday, April 28, 2023

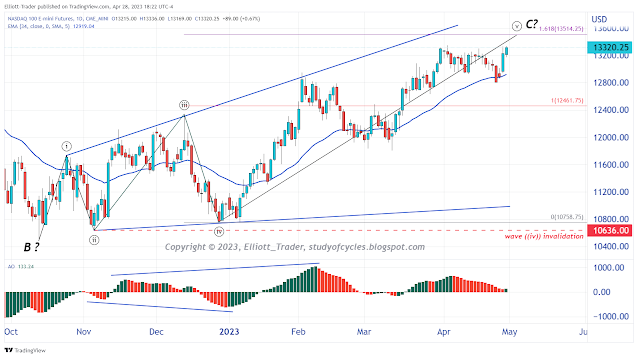
Only in the NQ ? Proximity to 1.618

As the Fibonacci ruler shows on this daily chart of the NQ futures, the current up wave is very nearly 1.618 x the prior up wave. Given, that there is already a valid expanding diagonal pattern visible in this index, I am publishing this as a 'five-count' because there is a valid fourth and fifth wave following a third wave.


Further, with about 135 candles on this daily chart, the EWO does show the characteristic expanding pattern of an expanding diagonal. Given all the overlaps, it is difficult to count the wave structure differently, although one could make a good argument that the diagonal itself ended in February as an A wave, then a B wave down into March and a C wave up to the present. However, it is not needed, and the Fibonacci ruler may be indicating the correct count.

My read on it is a 3-3-3-3-3 diagonal, which might be ending.

Can the ES futures be counted this way? Almost. They need a longer higher high yet, and the pattern looks a bit odd notwithstanding. Still, nothing says definitively that the uptrend is over. Remember, Monday is the first day of the new month and often sees inflows from the typical automatic investment sources we have listed many times, such a pension funds, 401k's, company bonus plans, etc., etc.

Have a good start to the evening.

TraderJoe

Thursday, April 27, 2023

Reason for the Principle of Equivalence

Today, we were counting upward possibly looking for a fourth wave. The market did indeed move upward but it kept on going so far as to invalidate a fourth wave. So? So, as per The Eight-Fold-Path-Method we simply assign A, B, C to the prior downward waves. First, here is the bolded paragraph from The Eight- Fold Path Method (the featured post in the upper right-hand corner of the main blog page). 

IF the potential WAVE 4 breaks the channel, and does not rebound, or the EWO takes on more than -40% of the value of wave iii of 3, on the opposite side of zero, then, most likely, the up wave was only the alternate A-B-C, and there is nothing the Elliott analyst can do except objectively accept the result. 1,2,3 and A,B,C are equivalent until they are not.

The above paragraph was written for the up wave, but the same applies to the down wave. Now here is the chart.


We had written this wave could fail. It did. And we gave the location of the potential failure. Why did we say it could fail? There were two reasons: 1) the down wave started with a diagonal. That means most often these are A waves. And 2) the down wave did stop just short of the 1.618 extension of the now A wave. That was just too suspicious, and it did prove to be foretelling.

Why did I originate the Principle of Equivalence? For just this reason: often inside of triangles and diagonals Fibonacci ratios like C = 1.618 x A, or C = 2.618 x A occur. Heck, I even monitored one instance in a real-time trading room of C = 4.236 x A.

If that can be the case, then the analyst has no business counting 1, 2, 3 .. until there is actually a four and a five. This is the very essence of The Eight-Fold Path Method. It is very, very different than the way the novice analyst begins counting Elliott Waves.

So, to honor this Principle I will generate no more charts showing 1, 2, 3 until there is a very clear fourth and fifth wave. And that brings us to today's wave. Here is the chart of SPY 15-min chart because it is a little clearer than the futures.


First, notice that I have labeled this chart as A/1, B/2 and C/3. This is to honor the Principle of Equivalence. Now you know the why of it. I will, however, express my preference for the count by showing that A or 1 first, depending on the evidence.

So, why did I label it starting with A at this time? Because look at the extent of the longest and deepest retrace. By gosh, it is only 23.6%! This suggests that so brief and shallow a wave is only a B wave, and not a second wave that typically travels between 50 & 78%. Further, once again, there is not yet a 1.618 upward wave. There you have it. Could this be wrong? It could. But it's not supposed to be according to common wave structures.

And, why in the prior post did I not use the convention shown in the prior paragraphs? I thought it would be helpful to re-emphasize this Principle when it was clear what the downward wave forms would be, and where I had also clearly outlined the invalidation level and provided a warning.

Hopefully you can see that The Principle of Equivalence, in particular, and The Eight-Fold Path Method, in general, both fully express the idea that wave counting is always a probabilistic exercise. If your analyst doesn't caution you of this often, there is something missing from their wave education. There will be times when wave counting is a bit more straightforward than this. 

This is not one of those times, and we may therefore be inside of a downward diagonal or one of a couple of triangles. I will have more to say on that later.

For now, have a good start to your evening,

TraderJoe


Wednesday, April 26, 2023

Local Count - 2

Based on the ES hourly chart, and The Eight-Fold-Path-Method, we must allow for some more volatility under the 18-day SMA before a lower low is potentially made again. Here is the chart. The degree labels are for relative indication at this time and are just for illustration. They will be modified later.

ES Futures - 1 Hr - Divergence on EWO


We note that wave 2 was a triple complex wave ⓦ-ⓧ-ⓨ-ⓧ-ⓩ, stalling and stalling and stalling before giving way to a third wave, lower. From what I can tell, the ⓩ wave truncated slightly.

With about 145 candles on the chart, the Elliott Wave Oscillator indicates wave ③ of 3 at the low point and wave ⑤ of 3 at the divergence. We need to see if a fourth wave and a fifth wave are made with proper form. As it stands, the third wave, 3, did not exactly make the 1.618 Fibonacci extension, but it is very, very close, and nothing says there can't be more down movement in the overnight.

Then, it becomes important to see if upward overlap occurs or not in a fourth wave. 

Speaking of overlap, we noted today on the daily chart below, that the third up (green) fractal back from 22 March was indeed overlapped at the 4,073 level. This was mentioned as a second target in yesterday's post. Here is the chart.

ES Futures - Daily - Overlap Warning Triggered

The presence of the overlap now makes upward wave counting extremely, extremely difficult according to the rules.

Have a good start to your evening,

TraderJoe

Tuesday, April 25, 2023

First Targets Reached

The contracting leading diagonal shown in the prior post played out today with a significant wave lower. As a result, the lower daily Bollinger Band (first target) was hit, and in the process both of the first two prior down (red) fractals were exceeded lower. The daily chart of the ES futures is below.


Here are a few items to remember or note: 

  1.  The daily slow stochastic lost its embedded status as we commented on.
  2.  There was an outside day up (ODU) yesterday and its low was exceeded today.
  3.  This creates a trap for the bulls who were expecting upside follow-through to the ODU.
  4.  Price is below the 18-day SMA and therefore has a negative bias, flipped from positive.
  5.  The lower daily Bollinger Band has been contacted; first target reached.
  6.  The daily Bollinger Bands are constricting; Smart Money may have taken some profits.
  7.  Because the bands are constricting, immediate downside follow-through may not occur.
  8.  The daily slow stochastic did not end up in over-sold territory today.
The next two targets likely are 1) overlap with the third green (up) fractal back from 22 March, shown with the purple arrow pointing down, and 2) the 100-day SMA. 

The market is being a weird bird right now. It stalls, and stalls, and stalls some more. And then it lets go all at once. That probably has something thing do with trading inside the expanding diagonal in the cash SPY (for chart see LINK here). The cash and futures are trading a bit differently. That's OK for now.

After the close McDonalds, Alphabet and Microsoft all reported earnings beats. The concern at the moment is for the regional banks.

Have a good start to your evening,
TraderJoe


Sunday, April 23, 2023

Local Count - Diagonal & Flat

The ES hourly chart is below with a count off of the high. It appears to be a 5-3-5-3-5 contracting diagonal followed by a Flat wave.

ES Futures - Hourly - Contracting Diagonal & Flat
 
Within the contracting diagonal, the Fibonacci ruler shows wave v < iii < i. Wave iv < ii and wave iv overlaps wave i. Within the Flat, the lower degree Ⓑ wave down is shorter in time and price than the longest of either of the larger degree down waves, and waves Ⓐ and Ⓒ, up, are shorter in time and price than their prior higher degree up waves, so degree labeling appears to be adhered to.

We'll also note that the pattern shows divergence with the RSI on the subsequent lower lows (there are not sufficient candles on this time frame to use the EWO).

The degree labels shown above are relative and only for illustration. They will likely be adjusted later due to the small size of this overall pattern.

The invalidation level is shown as the hourly high from 18 April. From the daily chart, below, this is also the level of a new daily up - or green - fractal (shown).

ES Futures - Daily - Bands Constricting and Embedded Status Lost

Price got down to touch the 18-day SMA ("line in the sand") on Friday, where it bounced. Note the daily Bollinger Bands are beginning to constrict significantly, and the daily slow stochastic (regular calculation) has lost its embedded status for the second day running.

Have an excellent rest of the weekend.

TraderJoe

Thursday, April 20, 2023

Expanding Diagonal Definitely Validated - 3

The short-term potential triangle we were following broke lower and greatly upped the odds that Red (5) has won the count.


Now, the three-wave portions of the triangle may be portions of an expanding diagonal downward. The top may be forming a head-and-shoulders that technicians will recognize and provide a measured move criteria to the downside.

Still, we need to see the downward waves form properly. The third wave downward is already longer than the first wave. A fifth wave lower also needs to become longer than a third. If it does, the count would have significantly lower implications for equity futures.

It is getting tiring counting diagonals, but that is all the market has been presenting of late. I would rather count impulses, but they are getting harder and harder to find for the time being. Perhaps that situation will change soon.

Have an excellent start to the evening.

TraderJoe

Wednesday, April 19, 2023

Expanding Diagonal Definitely Validated - 2

The ES count is updated below on the 2-Hr chart. The triangle B wave is definitely possible. A 78.6% downward & upward set of waves were made today.

ES Futures - 2 Hr - Potential Expanding Diagonal

The triangle looks weirder on the cash index as this morning's low was again missing some price excursion. If the triangle should prematurely break below the circle-a wave, then a down wave would have to be considered. We are not there yet. Triangles can do some strange things, so it is possible to travel below the circle-c wave marginally to make a better circle-c wave in cash.

The daily bias remains up. The daily slow stochastic remains embedded and the daily swing line trend is also still up.

Have a good start to the evening.

TraderJoe

Tuesday, April 18, 2023

Expanding Diagonal Definitely Validated

The ES 2-Hr chart is below. The potential expanding diagonal we have been discussing today has definitely validated. The only question remaining is whether it is complete. It could be, and there is a scenario by which it is not yet completed. First, here is the chart.

ES Futures - 2 Hr - Expanding Diagonal Validated

As you can see from the Fibonacci ruler, wave (5) has become longer in both price and time than wave (3), and the way it can be considered as complete is if yesterday morning's low was a 'failure b wave'. We discussed this in the comments for the prior post. The pattern will have done its job, and there are five-waves-up after yesterday's low.

IF the pattern is not complete, then a running triangle could form above 4,148 and a higher high would lie ahead. The market may be waiting on some news or earnings to provide a backdrop for a decline. 

However, in no instance could a low be made below wave (4) at 4,110 before a new high and the pattern not have ended. Said another way, "a low below 4,110 would confirm the end of pattern".

It gives me great pleasure for readers of this blog to actually have been able to see this pattern demonstrated and for at least two of us here to have agreed upon it. Again, the expanding diagonal is one of the rarest of patterns, and it is not all that often that people get to see them constructed by the rules. Because they are so rare, they should not always be expected at the end of every pattern. The contracting diagonal is a more common ending pattern. However, if this pattern is correct, since it is the 3-3-3-3-3 variety then it is expected to end a pattern.

Please keep in mind that this pattern is not exactly the expanding megaphone pattern that others often refer to. That is usually the expanding triangle pattern, which is different, and has different implications.

Now we'll see if, when & how this plays out.

Have an excellent start to your evening,

TraderJoe


Monday, April 17, 2023

Waiting on Resolution

Here is the potential expanding diagonal we showed in the prior posts (The Rarest of All Birds, LINK) on the ES 1-Hr chart. So far, we are just waiting to see if the pattern resolves properly.


With 160 candles on this time frame, we have a proper expanding signature from the Elliott Wave Oscillator. The length of the fifth wave, (5), has just barely validated the pattern with a a 100% x (3) wave for the A wave. 

Within the potential (5)th wave, the B wave is either completed downward, is forming a B wave triangle before the last wave of the pattern OR is forming an ending diagonal C wave.

In terms of targets within (5), wave C = A is one. IF a triangle forms, then C could equal the widest width of the triangle added to the breakout point. If an ending diagonal C wave forms there could be less than C = A within (5) with only marginal new highs. 

The market does not like being informative at this point. Part of the fog is the difference between the way cash and futures count within the wave. Let's see what we can glean over the next few days.

Have an excellent start to the evening,

TraderJoe

Saturday, April 15, 2023

Weekly - Evidence?

The weekly chart below looks at the evidence we can find for a wave count. It does not provide the typical YouTube/Internet hysteria about what a count might be that indicates the end of the banking system, the end of the U.S., the end of the dollar, or the end of the world (as one analyst sees it). The weekly chart of the S&P500 cash index is below. Let's look at the Elliott Wave evidence.


Waves Tend to Form Channels

The first point of evidence is that Elliott Waves tend to form channels, so we have drawn a tentative channel around the whole wave. The channel is drawn using the origin of the down wave, and the points currently labeled as (A), and B. Note too, downward expanding diagonal trend lines have been significantly violated upward, so the channel count seems to apply best. It looked like the expanding diagonal was the best way to get the first five-waves-down, but that no longer appears to be the case based on the current evidence.

First Waves require Third Waves

First waves in an Elliott Wave impulse pattern are later defined by their third waves which often extend and a non-overlapping fourth wave. The point labeled (A) in the above chart has no significant wave following it, and certainly not an extended wave. So, there is no evidence to call this a first wave (1). Within this (A) wave, look at the waves labeled 3 and 4, and note how they can define the 1 wave shown. Wave 3 is fast, it is long, and wave 4 does not overlap if wave 2 is a flat wave. This is not yet the case for the (A) wave. But there is a lower low after the wave labeled as (A). This suggests that (A) itself is indeed a five-wave-sequence.

Bear Markets Often Unfold as 'Threes'

If impulse waves are 'fives', corrections or bear markets are often 'threes'. Usually, most-often, the third wave of a bear market, the (C) wave in this scenario, is about as long as its first or (A) wave in this case. So, it is a reasonable assessment to suggest the down move is not over yet as there are not equal-sized waves in the downward direction as of this time. 

The Current Up Wave is Complex

The current up wave since the October low can best be counted as a complex wave - perhaps a triple zigzag. It has not yet exceeded its prior high labeled as the A wave.  Yet, the whole structure cannot be counted as a diagonal in the cash market. That is because the most recent down leg in cash was longer than the prior one, violating the rules for a contracting diagonal, at least. One of the few ways this complex structure can fit into a count is if it is the C wave of a triangle. Often, in a triangle, the C wave or the D wave is the complex leg of the triangle, supporting this view. As well, the up wave is 78% or better than the prior down wave. This suggests more a triangle formation and less a nested second wave formation.

Triangle Supports (A)

If there is a triangle after a down wave, then it, too, would support labeling only (A) at the down wave extreme of the Elliott Wave Oscillator. That's because second waves cannot be triangles.

Hourly Ending Expanding Diagonal Upward

We have been counting an ending expanding diagonal upward on the hourly chart. Assuming this pattern plays out, it should or must end a wave sequence. The diagonal should be entirely retraced in less time than it took to form. And, if it ends a triple zigzag, upward, then, this too, should or must end the entire upward wave sequence since the October low.

That is the best evidence we can glean or surmise from the waves presented. What are the implications? Well, if we are in a triangle, with a complex C wave, then the D wave down should be a simple zigzag. This should be followed by an E wave zigzag, higher before the (C) wave down begins. This might take the correction down to the 62% retrace level of the up wave from the 2020 low to the 2022 high.

Evidence Contradicting

Well, if a significant downward wave develops and extends more than 1.618 times the current (A) wave, we will reconsider this count only to see if a true fourth and fifth wave develops. Clearly, we are nowhere near there yet. But, right now, the actual evidence is against it, and there certainly is no down wave even started yet.

Evidence Not Hysteria

Regardless of what waves develop, we will remain patient, calm and flexible. As suggested by the hourly expanding diagonal, the market may have already made its choices, even if they are not yet complete. A major surprise (upward or downward) would have to occur to invalidate these scenarios - such as a significant change in FOMC policy, etc. But right now, these are certainly not in evidence and the next best data we have are company earnings that come pouring out in the following weeks. We know about the banking difficulties. They are a drag but not an outright brick-wall. So be careful what you listen to on YouTube. Many of these people simply have to take extreme positions to gather viewers so they can make money at your expense.

Have an excellent start to the weekend.

TraderJoe

Thursday, April 13, 2023

The Rarest of All Birds ?

It's still a question but the extent of today's run - without pullback after the cash open - was impressive. The SPY cash index made a higher high. The ES futures came within 1 point! All of this puts into play the last of the Elliott Wave topping patterns - the one that is supposed to be the rarest formation on the charts: the ending expanding diagonal. Below is the hourly chart of the ES futures.


Here you can clearly see the expanding pattern in three-wave sequences. IF the ES futures can get over their prior high - which doesn't seem like much of a feat, then it would better indicate this pattern. And, IF it can get over 4,189.25 level then it would indeed validate the pattern with the lengths of all the waves being minimally correct. Then it is a question of how high and where it stops. This pattern is brutal. It's third wave is 'almost' 1.618 x its first wave. The fourth wave is actually shorter in time than the second wave which is not ideal. Interestingly, this pattern actually invalidated lower in the NQ futures. But we count each index for the stocks it represents, not all indexes together. 

Blog reader and contributor BBRider & I have been discussing this one back-and-forth for a few days. I laid out the condition that there had to be a lower low to wave (4) in the ES that held above wave (2), which there was. He had the foresight to recognize the pattern early, and the tenacity to stick to the count. Bravo! Well, so far. Let's hope there are no more real surprises to this pattern as it has gotten testy enough already.

Tomorrow are some financial sector earnings. IF today was an "A" wave up of (5), then there is a very wide playing field for a "B" wave lower. Perhaps this pattern overall will end on Monday or Tuesday of next week. Hard to say. We'll take it step-by-step. The placement of the c label is a placeholder only and does not represent how high that wave can eventually finish.

Have a good start to your evening,

TraderJoe

Wednesday, April 12, 2023

Recession? Who said recession?

The FED, that's who. Early in the overnight, the IMF (International Monetary Fund) said there could be a recession. Today in the FOMC meeting minutes released of the prior meeting, a recession was also said to become more likely. Surprise? No. The inverted yield curve has been saying it for months. As far as the ES futures go, they first popped to a very marginal new high on the more benign CPI report. Then, prices reversed creating yet another outside key reversal day down as of the cash close. The daily chart is below.

ES Futures - Daily - Outside Key Reversal Day

On the intraday chart, even though the triangle did not work out, we were able to identify one five-up count for the c wave scenario within an hour of the cash open.

Today also adds the 06 April low as a closer-in down (red) fractal. The daily bias however remains up. The daily slow stochastic is flirting with the 80 level after being embedded but - as of this time - it is still embedded. And the usual considerations for an outside day down apply: "IF the high of the outside day down is exceeded higher within two subsequent sessions, then it would constitute a trap for the bears."

Interestingly, if you draw a trend line up from the lows it likely will intersect with the 18-day SMA. We'll see what kind of follow-through develops, if any. Remember, the PPI report is tomorrow, but I suspect attention will begin to turn from the inflation reports more to company earnings reports in the softer conditions.

Have an excellent start to the evening,

TraderJoe

Tuesday, April 11, 2023

Grindy and Overlapping

Perhaps we are getting a pre-CPI/PPI triangle on the hourly chart of SPY. If so, and if the triangle forms properly, it may indicate 'last wave up dead ahead'.


This is a reminder of the CPI report due out Wednesday morning and PPI report due out on Thursday.

Have an excellent start to the evening,

TraderJoe

Monday, April 10, 2023

Gap & Grind

ES futures largely traded lower overnight and created a significant gap for the cash market as the SPY cash 15-minute chart below shows.


Prices got down to the 90% level of the prior up wave. (By now readers of this blog should know what kind of wave formation that measurement allows). Then, after the first cash bar, the market turned and began to grind and grind and grind higher - like a coffee bean grinder that is left on, runs out of beans, is fed with more beans, runs out again, etc., etc.

From an Elliott Wave perspective we can count the grinding as some or most of five-waves-up which is perhaps not complete yet - given that the after-hours cash is even higher. So all-in-all, the day's price excursion gives added weight to the alternate (red) count on the 4-hr chart shown in the prior post. It is interesting that the most impulsive direction (down, in cash) results in higher grinding highs. This is not typical, but it is what it is, and it is why we are so calm, patient and flexible at this time.

It is very clear to me some Smart Money player is "clipping" the lows trying to trap neophyte money for the balance of the day when they assume new lows will occur which don't. Nasty stuff.

Have a good start to the evening,

TraderJoe

Saturday, April 8, 2023

Lower Low Day - 2

Friday (as brief as it was) had a lower low day, too. On the ES daily chart the outside key reversal day down was not exceeded higher within the next two trading sessions, and so it was not a trap for the bears. The ES 4-Hr chart update is below. The situation with a possible continuation of the impulse wave with a fourth wave has not resolved itself, yet.

 
ES Futures - 4 Hr - Optional New High


Again, while a higher high can easily result, it has not yet. Nor is it required to do so. However, if it does, it will result with a better divergence on all three of the RSI, the MACD and Elliott Wave Oscillator. Readers of this blog should plot the ES 2-Hr chart and note the position of the Elliott Wave Oscillator (EWO) for this wave of interest since the b wave low with 120 candles on the chart and compare it to The Eight-Fold-Path-Method as an exercise. This lower timeframe is the reason for the alternate count which now has slightly better odds at this point because of Friday's upward price movement. 

Have an excellent rest of the weekend & holiday.

TraderJoe

Wednesday, April 5, 2023

Lower Low Day

Although the day included a new ES daily lower low, the downside price movement is still mild, at best. That being the case, a prudent look at the alternate suggests this could still be a fourth wave. And there could be a higher high to result. The ES 4-hr chart, below, explains this case in some detail as price is now at the lower end of an internal parallel trend channel shown in blue.


Again, this larger red fourth wave, , does not need to occur. And, in fact, the degree labels might work out better if it does not occur. But it certainly 'could' occur so we explain it here as best we can.

The daily bias is still higher, and the daily slow stochastic (regular calculation) is still embedded. These are other reasons to at least have the alternative in mind. At this point, there is one level of divergence from the high. Another could occur. Nothing says that price cannot drop quickly away from this inner channel, but so far it has not. 

So, we remain patient, calm and flexible until the market tries to make a better statement in the face of a holiday-shortened week including a Payroll Employment Report on Friday.

Have a good start to the evening,

TraderJoe

Tuesday, April 4, 2023

Outside Key Reversal Day Down

ES prices made higher highs in the overnight and then began trading lower before the cash market opened. As the ES daily chart below shows, prices continued trading lower until they undercut the prior day's low and they closed lower. This is the very definition of an outside-day-down but when the action occurs at the highest point in a rally, it is also termed an outside key reversal day.


Readers of this blog were shown yesterday how a turn could occur at the equality measurement from the 13 March low. So far, it has. Prices also turned at the upper daily and weekly Bollinger Bands.

As with any outside day down, the consideration is that if the high of the outside day down is taken out within two trading sessions, then it constitutes a trap for the bears. This could happen if today is part of a fourth wave. If it does, so be it. The next up (green) fractal is the one at the 14 February (Valentine's Day) high. Note that an additional fourth wave is not required in the up count. I am only suggesting what a higher wave would indicate today was IFF a higher high than today were made.

IFF a higher high is not made, then it would suggest the triangle scenario we outline previously in this post (see LINK) might well be under way. In that case, the 13 March low might well be expected to be undercut as well.

Just remember the daily bias is still up on the chart and the regular calculation of the daily slow stochastic can now be considered to be embedded. Further, there is no swingline down trend yet.

Have a good start to the evening,

TraderJoe


Monday, April 3, 2023

Not Very Impressive

Today was the first trading day of the month and the new quarter. We have written many times about some of the sources for the automatic inflows on days like this (pension funds, company bonuses, dividend reinvestment plans, etc.). As the 4-Hr chart of the ES futures, below, shows, there were only relatively minor new higher highs which were not particularly impressive.


The MACD does not show a sign of rolling over, yet. The RSI is showing only the barest divergence at this time. The upper channel boundary and Fibo equality with the first wave set are dead ahead. None of that means anything unless prices actually turn lower in response. Sometimes an "up" Monday is followed by a "turn-around" Tuesday. We shall see.

Have an excellent start to the evening.

TraderJoe