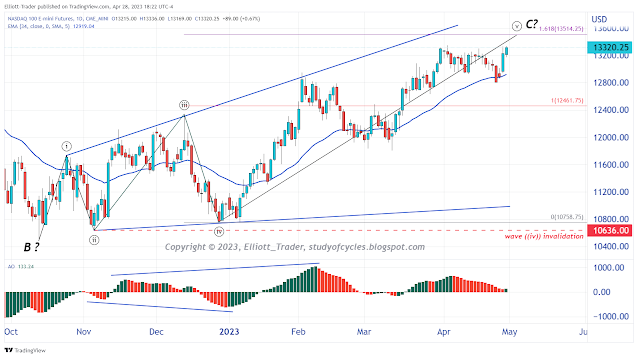
As the Fibonacci ruler shows on this daily chart of the NQ futures, the current up wave is very nearly 1.618 x the prior up wave. Given, that there is already a valid expanding diagonal pattern visible in this index, I am publishing this as a 'five-count' because there is a valid fourth and fifth wave following a third wave.
Further, with about 135 candles on this daily chart, the EWO does show the characteristic expanding pattern of an expanding diagonal. Given all the overlaps, it is difficult to count the wave structure differently, although one could make a good argument that the diagonal itself ended in February as an A wave, then a B wave down into March and a C wave up to the present. However, it is not needed, and the Fibonacci ruler may be indicating the correct count.
My read on it is a 3-3-3-3-3 diagonal, which might be ending.
Can the ES futures be counted this way? Almost. They need a longer higher high yet, and the pattern looks a bit odd notwithstanding. Still, nothing says definitively that the uptrend is over. Remember, Monday is the first day of the new month and often sees inflows from the typical automatic investment sources we have listed many times, such a pension funds, 401k's, company bonus plans, etc., etc.
Have a good start to the evening.
TraderJoe

Thank you for the update TJ, so this could be a wave c of the larger degree wave B expanded flat perhaps?
ReplyDeleteSPY 10-min: here is the update of the A/1, B/2 chart that was started earlier. It tries to follow degree labeling concepts as much as possible. Each sub-wave of (c) is smaller than the (a) wave, at least in cash.
ReplyDeletehttps://www.tradingview.com/x/MIHeEDru/
Be careful, because as a diagonal, the chart does not have the 'typical' 62% retrace levels of an ending diagonal. Therefore, it has elements of a 'leading wave'. Still, there has not yet been a 38% or greater retrace. This 'might' happen Sunday into Monday morning.
There is an alternate on this time scale which might have a similar effect, particularly if the overnight waves bust a diagonal upward. It is as follows.
https://www.tradingview.com/x/SXA6k46q/
In the alternate - on such a short time scale - there is no 'good' fourth wave signature on the EWO. Possible, but less likely.
TJ
Thanks TJ for clarification. Just to clarify on ES futures"They need a longer higher high yet. " Feb 23 high ?
DeleteYw.. in the expanding diagonal count, yes, higher than 23 Feb, but also so that the fifth wave is longer than the third, using the same locations as on the NQ chart. But I will have more to say about the ES on Sunday. TJ.
Delete..posted. TJ.
DeleteA new post is started for the next day.
ReplyDeleteTJ