ES futures largely traded lower overnight and created a significant gap for the cash market as the SPY cash 15-minute chart below shows.
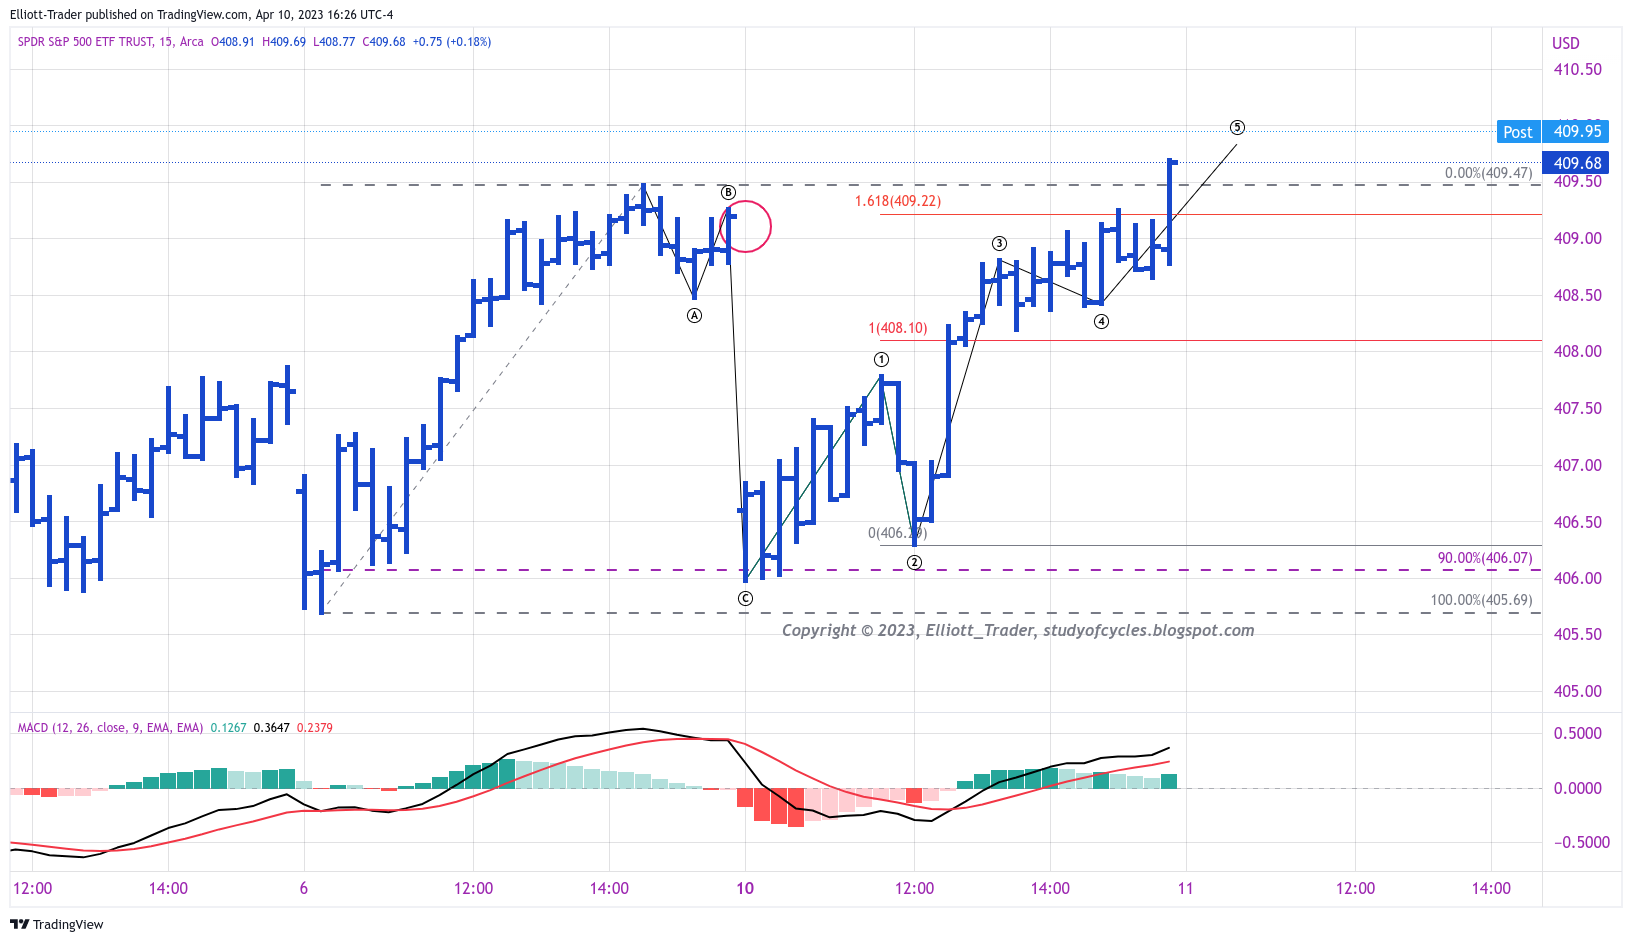
From an Elliott Wave perspective we can count the grinding as some or most of five-waves-up which is perhaps not complete yet - given that the after-hours cash is even higher. So all-in-all, the day's price excursion gives added weight to the alternate (red) count on the 4-hr chart shown in the prior post. It is interesting that the most impulsive direction (down, in cash) results in higher grinding highs. This is not typical, but it is what it is, and it is why we are so calm, patient and flexible at this time.
It is very clear to me some Smart Money player is "clipping" the lows trying to trap neophyte money for the balance of the day when they assume new lows will occur which don't. Nasty stuff.
Have a good start to the evening,
TraderJoe
Thanks Tj,
ReplyDeleteit is looking like markets have digested all issues of bank failures. Inflation date on April 12th should be good enough to suggest no interest rate hikes anymore. Bitcoin already above 30k. I don't understand from where does the fed is funding the markets and crypto.
Respectfully disagree. Yesterday's release of Consumer Inflation Expectations came in at 4.7%, well above previous and forecast. The Fed will be concerned, rightly or wrongly, about inflation pressures becoming entrenched. Tomorrow's CPI data is forecast to be 5.6% at the Core level, actually a tick higher than previous month. Additionally, the CME's Fedwatch tool pegs the May 3rd meeting at a 70% probability of a 25 bps increase.
Deletehttps://www.cmegroup.com/markets/interest-rates/cme-fedwatch-tool.html?redirect=/trading/interest-rates/countdown-to-fomc.html
Clearly, "no more hikes" is not the modal expectation.
I agree. Not sure if all the happy somtalk about rate cuts is gaslighting or unbridled stupidity. Remarkable that the market is "pricing in" this balderdash. The FED has no choice but to follow the market if it hopes to continue selling debt and they have plainly stated their intention. At some point dollar-denominated debt destruction will issue in a spectacular deflationary cycle, but not just yet imo...
DeleteSorry quote is so long and without Ewaves.
DeleteRe: Hartnett of BofA
In his latest note published during the Good Friday lull, the BofA CIO repeats what he said in late March, and says that the "SPX rally from 3.8k to 4.1-4.2k likely run its course" and his recommendation once again, is to “sell the last rate hike” on May 3rd.
It's not just technicals: Hartnett believes there is a simple if fundamental reason why the rally is coming to an end. As he writes in the "The Biggest Picture" segment of his note, with the ISM printing at 46.3 means "manufacturing contraction on full display & prints below 45 always = US recession past 70 years & set to be confirmed by rising unemployment coming months."
Here are the latest weekly fund flows per Hartnett:
Cash: biggest 4-week inflow ($403.4bn) since Apr’20,
Gold: longest (4-week) streak inflow ($2.7bn) since Apr’22,
Credit: IG & HY inflows ($13.7bn) resume, largest since Jun’21 ($4.9bn HY inflow largest since Oct’20),
TIPS: largest outflow ($2.1bn) since May’22,
Financials: largest outflow since May’22 ($1.8bn)
A similar pre-recessionary positioning emerges when looking at BofA's Private (High net worth) clients: here, of the $3.0tn in AUM, 59.9% is in stocks, 21.4% is in bonds, 11.8% is in cash. According to Hartnett, in Q1 private clients bought highest amount of bonds ever (of which T-bills = 40%)...
Think we are in 4 of the CED for red(5).
ReplyDeleteI tried moving the 4 over to yesterday's low and that does not look as good.
DeleteI can make the case that ced is over but i like to rush things
DeleteA new post is started for the next day.
ReplyDeleteTJ