Friday, September 30, 2022

Just Providing "The Number"

We have been contending for months that the all-time-high in the stock market was a Primary ((B)) wave and that the pattern in the downward direction is an expanding diagonal - which might be some or all of the Primary ((C)) wave, downward. The expanding diagonal is one of the few Elliott wave patterns that would explain both the choppiness of, and the unrelenting nature of, the drip, drip, drop decline lower. The ES daily chart, below, shows the schematic of the expanding diagonal wave in a real time, zigzag chart, akin to how Glenn Neely likes to plot Elliott Waves.


Note the blue arrow in the lower right pointing to the left. IF this pattern is correct, and if it is to be an expanding diagonal, then, the blue arrow shows the level at which such a diagonal would be validated. That level in the ES futures is ES 3,335.50 - and that level should be exceeded. IF it is exceeded, then wave Minor 5 would become longer than wave Minor 3, and establish an expanding diagonal that follows the rules.

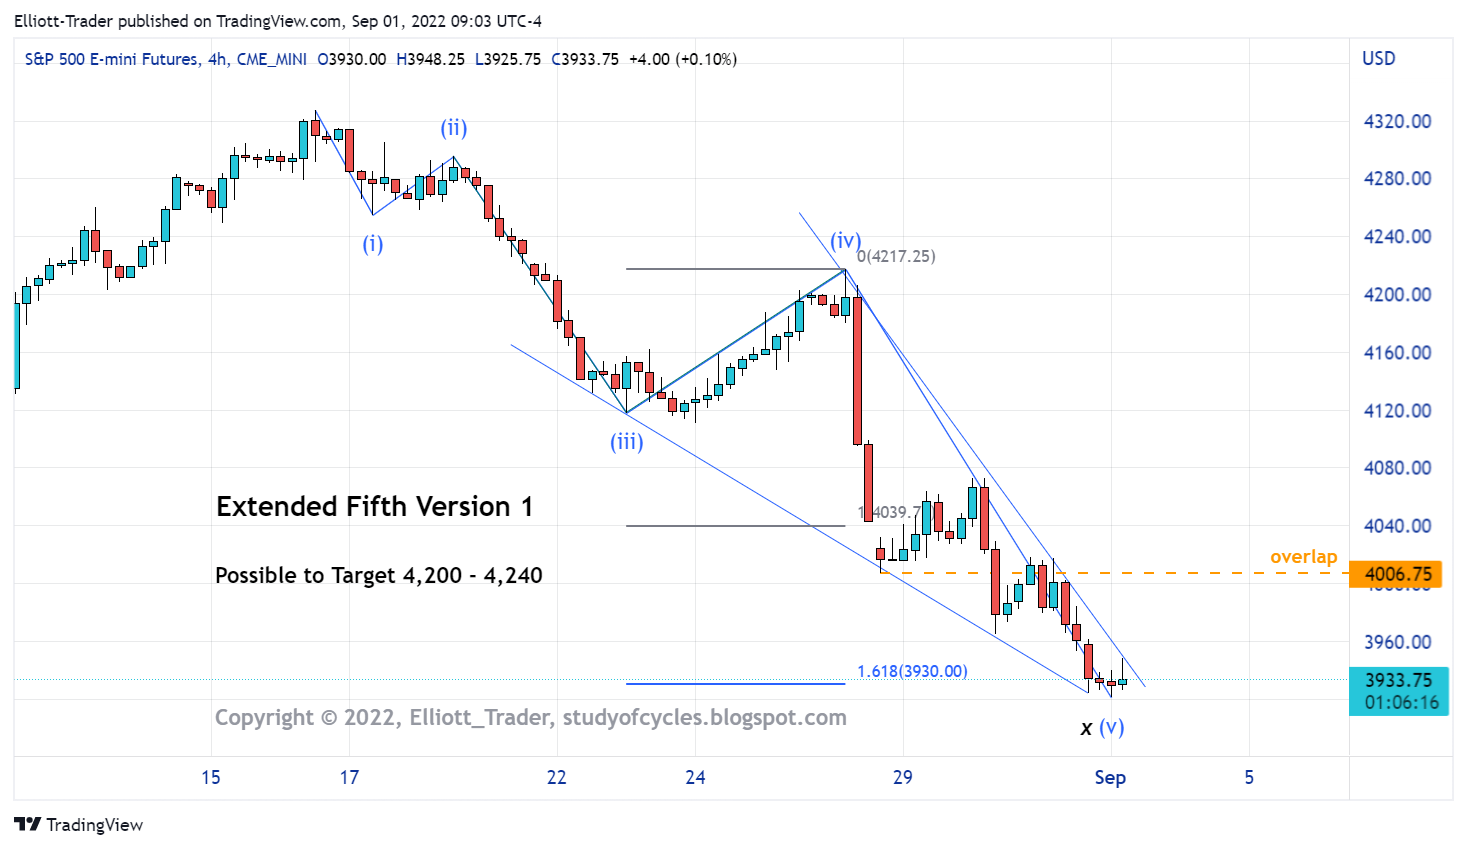
Now because wave Minor 5 is often, usually also longer in time than Minor 3, then this wave can go on (given substantial and frequent bounces along the way) for quite a while. Wave 5 could become 1.618 times as long as wave 3, or even longer.

I will remind those that have read the Elliott Wave Principle by Frost & Prechter, that page 40 states, "This form appears to occur primarily at the start of declines in the stock market (see Figure 21). These patterns were not originally discovered by R.N. Elliott but have appeared enough times and over a long enough period that the authors are convinced of their validity."

Have a good start to the weekend.

TraderJoe

Thursday, September 29, 2022

Just One Way - Could Be Others

There is now at least one good way to count the minute ((a)) wave down within the Expanding Diagonal. That count is shown as the blue/black count in the SPY 30-min chart below.


Because the ES futures have not made a new daily low, yet, wave blue (v) could have more to travel lower. Also, it is possible to get even a larger fourth wave, red (iv), with a further fifth wave down to follow as red (v).

There is a great deal of uncertainty near the lows - just as there always is near highs: It is The Fourth Wave Conundrum - which is present at every degree of trend. I am presenting the first time I could legitimately count five waves down, and there could legitimately be others within reason. So, I do not wish to rush the count, but it is also necessary to count what one sees.

Have a good rest of the day.

TraderJoe

Monday, September 26, 2022

Wave (iii) is already longer than wave (i)

In our previous comments, we noted that the up wave to wave (ii) in September was greater than 62%. Therefore, it could support a 1.618 wave downward. So far, we note that wave (iii) is - in fact - longer than wave (i). This likely makes wave (iii) the extended wave in the sequence. Here is a chart.

ES Futures - 5 Hr - Two Channels

There are two channels of note. Price is currently residing in the steeper acceleration channel. Yet, be careful as within wave (iii), wave ii is much less than 62%. Therefore, wave i might be the extended wave within that sequence.

The Elliott Wave Oscillator on this 5 Hr time frame is on a low. If a series of 4's and 5's are made things could get bumpy along the lower daily Bollinger Band.

Have an excellent start to the week.

TraderJoe

Wednesday, September 21, 2022

Outside Day Down - Holds for Today

Yesterday, we noted the ES daily outside-day down. Today made a significant lower low on the news of the FOMC 3/4 point rate hike. This was after a five-wave up rally failed to take out the high of the prior outside-day-down. The daily chart is below.


According to the above program's calculation of the Daily Slow Stochastic, it is day three of embedding. According other programs it is day two. Either way, the high of today's bar is significant. Near the low, prices were pushing on the lower daily Bollinger Band which was at approximately 3813 - 3820 according to when observed during the day. Nearer the settle, prices were nearing 3,800.

Below ES 3,790 it will become very difficult to call the down wave a "b" wave in a larger flat because of degree-labeling considerations. Therefore, movement below there has a higher probability of being part of a third wave.

While a retrace of part of today's bar could occur at any time, nothing to the down side will surprise me. Regular readers of this blog saw in the intraday count today just how vicious the fifth wave of a downward diagonal could be - even on a smaller degree. See the prior day's comments for more on this topic.

Nothing in the Elliott Wave count is changed at this time.

Have a good start to the evening,

TraderJoe

Tuesday, September 20, 2022

Outside Day Down - FED tomorrow

Yesterday in the ES futures was an outside day, up. It had a lower low, a higher high, and a higher close. And it was day 'one-of-three' of possibly embedding lower. If the low of an outside day up is taken out in the next two trading sessions, it constitutes a trap for the bulls.

Today was an outside day down. It had a higher high, a lower low and a lower close. Thus, the trap above for the bulls was sprung. Further, we note the 18-day SMA has crossed below the 100-day in the daily chart, below.

ES Futures - Daily - Outside Day Down

However, today also being an outside day down, could result in a bear trap if the high of the outside day down is taken out in the next two trading sessions. Today is also day two-of-three of possibly embedding the slow stochastic. So, tomorrow is most at risk for potential reversal and not embedding (usually the daily slow stochastic does not embed. Sometimes it does.)

This flip-flop behavior can still be consistent with a flat correction being sketched out for a second wave, ii, as was suggested yesterday. However, tomorrow is also FED day, and a lot of price movement is possible in either direction or in both directions. Is it possible for the market to just 'give-way' lower here? It is. But, it is equally possible for a larger up wave to be made to make wave ii more proportional with the other waves.

Caution, patience and flexibility are warranted, especially given the nature of the report and press conference tomorrow.

Have a good start to the evening.

TraderJoe

Monday, September 19, 2022

Likely into ii, up.

Compare the chart in the prior post to this one. With today's lower low, and then higher high, it is likely that wave ii, up, began around 6 AM in the futures.


With the lower marginal low, the relationship of the waves in wave i is currently micro ((5)) < ((3)) < x((1)). Wave ii, up, could be any corrective structure (flat, zigzag, multiple zigzag, combination) except a triangle. Note: since a flat is allowed, a further lower low could result, but does not have to.

Wave i retained it's shorter-than relationship to wave (i) as well, allowing it be a sub-wave lower should it come to that.

Have an excellent start to your evening.

TraderJoe

Friday, September 16, 2022

Until or Unless...

Until or unless there is overlap of wave micro x((1)) down, this is the count in the ES futures 4-hr chart. I have simplified this view using only closes so you can concentrate on the form of the waves. There are no overlaps on the OHLC version.


Overlap would be the first indication of trouble, but it just has not happened yet. At present, the down wave from (ii) is shorter in price and time than (i), down, so it can qualify as a subwave. The internal waves were reduced in degree on evaluation after the market close.

As I said, try not to get too cutesy, injecting your own opinions of what should happen for reasons you might have, technical or otherwise. A bear market can give way at any time, and for no apparent reason. One reason that is usually not very apparent to most retail traders is simply the withdrawal of bids.

Have an excellent start to the evening and the weekend.

TraderJoe


Wednesday, September 14, 2022

Two For the Price of One

The cash stock market opened this morning, and after some retracing upwards made not one but two lower lows based on the SPY (and similarly the ES futures) 15-minute chart. In the category of try not to sweat the small stuff that leaves two options available. They are both shown below. Version 1 counts five-waves-down during the bulk of the day to wave micro ((5)), as below. This occurred after a flat correction for wave micro ((4)).

SPY Cash - 15 min - Version 1 Larger Impulse

Version 1 means the upward correction might just be beginning. However, consideration of the first lower low of the day as wave micro ((5)) results in Version 2, as below.

SPY Cash - 15 Min - Version 2 Flat

Version 2 considers that the correction began when the upward parallel was first broken. That means only a (C) wave up is left to go.

Each version has its strengths and weaknesses. Version 2 is slightly favored by degree labeling. The Fibonacci retrace levels are shown, and as you might have guessed 62% just happens to line up with the bottom of the gap area.

In either case, this seems to be more minutia than anything. The task is to try to count with the prevailing trend if it holds. 

Have an excellent start to the evening,

TraderJoe

Tuesday, September 13, 2022

Impulsing Lower

The daily chart of the ES futures is below. The Elliott Wave count remains the same. Price is impulsing lower and today's bar can be counted as five-waves-down on a 5-minute chart.

ES Futures - Daily - Impulsing Lower


The length and steepness of the bar would tend to indicate the wave is part of a third wave, (iii), position, and is likely wave i of that wave. The going assumption is that the overnight high in the ES will not be exceeded higher for many days to come. (If the overnight high should be exceeded higher then it would invalidate the count). 

It is very, very likely that a number of technical analysts will also recognize same, and it would probably be wise not to get to cutesy with the wave. A third wave could break lower at any time and for no apparent reason. And, if the count is correct, this wave can travel much lower than some expect.

Note that, at present, wave blue i is shorter than wave (i) in price & time and therefore can qualify as a valid sub-wave.

What do I mean by not get too cutesy? Say for example a wave count is being worked on and it makes a substandard retrace and a lower low that tends to rule out your count? Well, there may be a flat wave or a triangle involved. So, try not to get too in the weeds about it all.

Further, the prior up wave (ii) did exceed the 61.8% retrace level in the futures. That means a 1.618 downward wave (iii) could easily occur.

We will note that price closed the day below both the 18-day SMA and the 100-day SMA so the daily bias is lower. They might act as resistance to an upward wave which might be the retrace wave. Further, wave counters need to be on watch for a cross of the 18-day under the 100-day. If the waves are this speedy in the downward direction, it could happen in days.

Have a good start to your evening.

TraderJoe


Friday, September 9, 2022

SPY - Because of the gap

In the SPY 15-min chart, below, there is a prominent gap - red circle -which is 'often' in the middle of a third wave. For that reason and the higher Elliott Wave Oscillator (EWO) peak, the blue count is the preferred one.


The blue count has wave ((3)) of iii on the peak of the Elliott Wave Oscillator and wave ((5)) of iii on the first divergence per The Eight-Fold-Path Method. This count allows the EWO to come back near or below the zero line (black circle) for a fourth wave before making a higher high in blue v. The alternate is shown in red. It is 'plausible' but has disagreements with the futures which is a second reason why it is the alternate and not the preferred count at this time. The "running flat", if a second wave, is what allowed us to suggest that today might be a large up day. And, the position of the EWO is what allowed us to suggest there could be a higher high after lunch today. There was.

We'll look to see if blue wave iv can hold a 38 - 50% retrace on blue wave iii. If not, eyebrows will raise. In order to get alternation, wave blue iv could be a zigzag (sharp) or a triangle.

Have a good start to your evening & weekend.

TraderJoe

Thursday, September 8, 2022

ES - Nothing Has Changed

Nothing has changed in our proposed ES 4-Hr wave count. Pick your favorite Fib relationship (shown) for c-5 of possible wave (ii). The chart is below.


The Fib confluences are shown. But a significant moving average (18-day, 100-day SMA) might also be in play.

I can't rule out that the afternoon today wasn't a 'b' wave of a second wave in the up direction as it was between 1.50 and 1.62 in length compared to the Powell inspired down wave this morning. But a significant overnight gap up would likely rule that out. I also can't rule out that the later part in the day wasn't a part of an upward diagonal. Again, a significant upward wave in the overnight would tend to rule that out, as well.

Prior fourth waves, i.e. wave iv, are sometimes targets. Sometimes they are traps, too. Caution is warranted. As long as price is below the 18-day SMA the bias is down even if higher daily highs are resulting.

Have a good start to the evening.

TraderJoe 

Tuesday, September 6, 2022

Not Sure, But Look for Signs (DX)

The third up wave in the U.S. Dollar Index is a very non-proportional 4.236 wave caused directly by the Federal Reserve's "new idea" to hike interest rates to control inflation. The three-day chart of the U.S. Dollar Index Futures is below. I have observed the Federal Reserve when they made me pay as much as 15% for a home mortgage (no kidding, under Volcker), and I have observed the FED when they allowed some people to pay only 3.25% for a mortgage just within the last two years. I have observed the FED when a 3 + 2 home with a garage cost $100,000 in a nice neighborhood, and when a similar house now costs $550,00 in a similar neighborhood.

Their activity can only be described as insanity. It is useless. It is needless. It keeps all the financial markets on edge. It amounts to constant over-correcting. There must be a better way to help stem boom-bust cycles.


With a Fibonacci 144 candles on the chart, the Elliott Wave Oscillator has made a peak and is currently on some lower highs. As of this time, the wave is not travelling in a strict parallel but rather an expanding pattern.

If the wave we are in now is a Minor B wave, then it might be time to start looking for signs of at least a corrective wave that alternates with wave Intermediate (2). The reason the chart is counted this way is that every internal correction can be counted shorter in price and time than Intermediate (2).

There can be no guarantees, but a 4.236 wave is nothing to sniffle at. Unlike some other Elliott analysts, I do not dismiss the activity of the FED from moving financial markets, regardless of my opinion of the utility of the FED.

Have an excellent start to the evening,

TraderJoe

Friday, September 2, 2022

Simplest is the Best

We were expecting some upward movement today, and we got some as the initial reaction to the Payroll Employment Report to ES 4,020 until about noon. Maybe a bunch of traders decided to start their long holiday weekend early. Then around 12:15 ET we said if prices got below 3,983 a failed ending diagonal of the up move could be called, and we showed such in the comments for the prior post. Prices continued to fall off hard, hitting 3,925 by about 14:00 ET. Our original count was reviewed and we find this impulse to be the best and simplest answer to the decline. It is the wedge we originally posited.


In this count, wave v is less than wave iii so that there are no rules violations. Also, there are no degree violations. Wave ((2)) is less than ii, and wave ((4)) is less than wave iv. Further, wave ((1)) is less than the corresponding downward waves, i or iii, in price and time.

There was sort-of a "dead-stick-landing" meaning that wave v was squeezed until there was nothing left to the apex of the wedge. The count overall was a bit of a head-scratcher, but this looks right.

This morning ended three-waves-up, and this might start a Flat wave sequence (most likely), double-zigzag (if the low holds) or other more complex correction.

Have an excellent start to the weekend.

TraderJoe

Thursday, September 1, 2022

Another plausible way to get 1.618

In the prior posts we were following a wedge count downwards, and - because today was the first of the month with the potential inflows from the usual sources - expected it to break upwards. It did that today. That does not mean downward movement is over. Here is another plausible way to get a deeper 1.618 extension measurement on the ES 4-Hr chart in potential agreement with the EWO.


Several wedge possibilities were tentatively ruled out this morning because of the lengths of the waves. A third wave extension is now dependent on making an non-overlapping fourth wave, shown as iv, above. Again, it can not overlap with wave i, at about the level of ES 4,006. And, if there is a lower low on the Payroll Employment Report, that may qualify for wave v of wave (iii). Then a wave (iv) would take over shortly, possibly to head for the upper channel line.

Each of the subwaves sub-minuette i and iii are shorter in price and time that what would be minuet wave (i), and so degree labeling is currently adhered to.

Even though we got what we expected on the day, counting is darn difficult at this time. Let's see how it goes tomorrow.

P.S. You can move wave (i) one trough to the right to insure wave i is shorter than it.

Have an excellent start to the evening,

TraderJoe

There is Now a 1.618 Wave, but, but, but ..

As the ES 4-Hr chart below, shows, there is now a 1.618 wave downward wave. But, but, but ... there is an overlap in the fifth wave, (v). This suggests that if the fifth wave, (v), is a diagonal, that the retrace waves could target over the prior (iv)th wave.


The 1.618 extension was something I called for in real time on the blog. Well, it seems to be here, but because of the overlap it simply can not be a third wave. Third waves can not be diagonals.

But, but, but .. there is a version of this count which can make the whole structure a contracting leading diagonal. It would be counted this way.


This version of the count is much less proportional and would invalidate below a certain level. Keep your eye on the length of (v) versus (iii).

There is an even larger version of this diagonal which places (iii) at the very low, and up wave overlap is still required. Possible.

The issue with the x(v) count AND with the contracting diagonal count is that deep retraces are possible. That's fine. If they happen, they happen.

But, but, but,,there is one version of the extended fifth wave count that has a shallower retrace.


It is still an extended fifth because it is longer than (iii) but, but, but .. there would be a flat wave currently under construction. This view might align more with where the 18-day SMA is currently located. 

The bottom line is this: this is a time for maximum flexibility and patience if you can muster it. We can see different scenarios. In other words, this whole wave can be ((a)) at the minute degree, OR it could only be wave (i) of ((a)) at the minuet degree. I will look for ways to try to sort it out.

But this is what an Elliott analyst does. Remain open and flexible and do your best to count the waves on the way up. I'm telling you that if we are making a diagonal lower, the expanding variety is one of the most difficult to count at every twist and turn.

Have a good start to your day,

TraderJoe