As the ES 4-Hr chart below, shows, there is now a 1.618 wave downward wave. But, but, but ... there is an overlap in the fifth wave, (v). This suggests that if the fifth wave, (v), is a diagonal, that the retrace waves could target over the prior (iv)th wave.
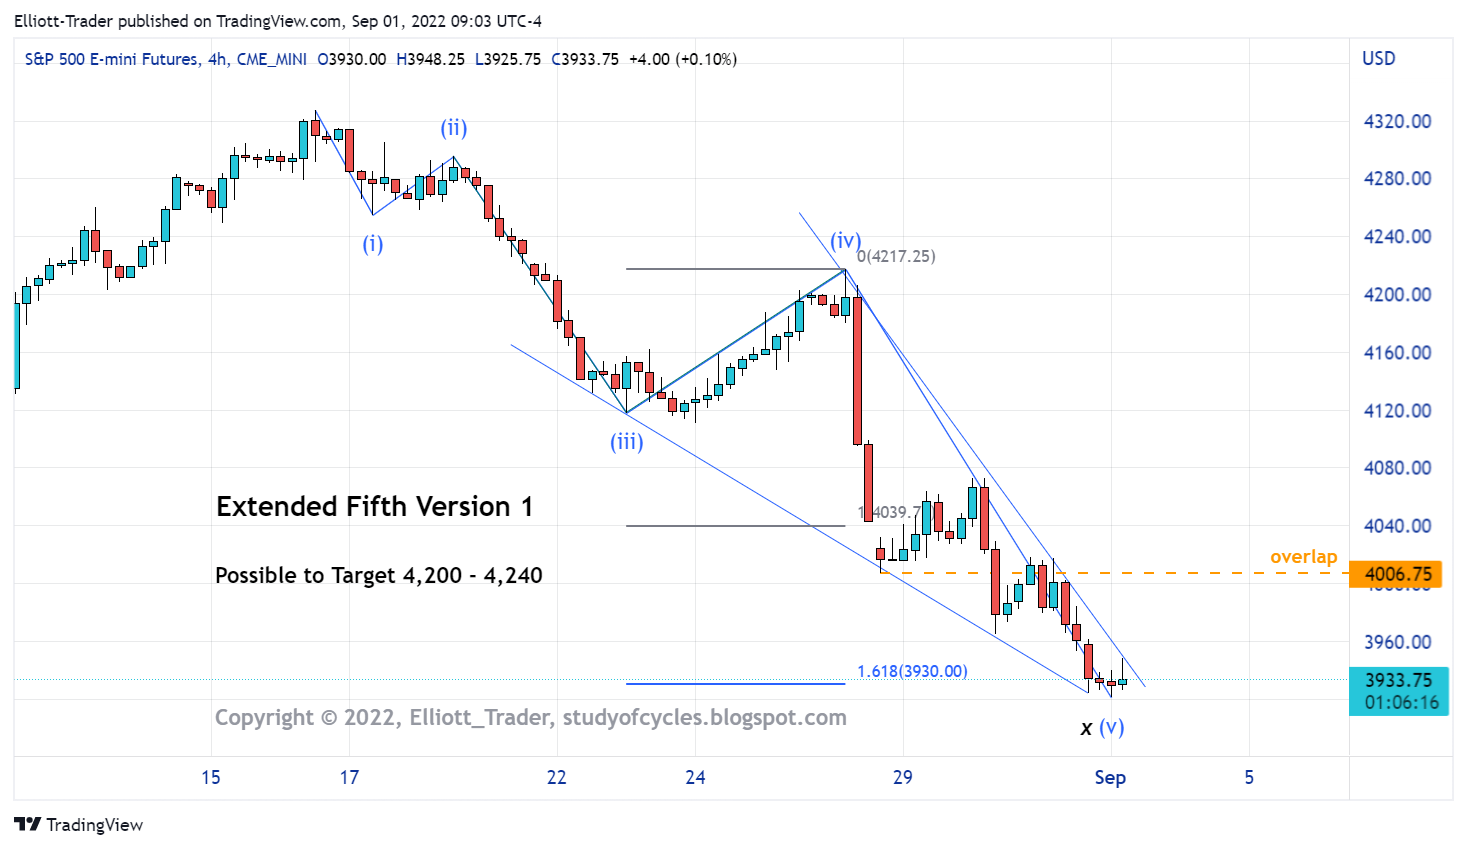
The 1.618 extension was something I called for in real time on the blog. Well, it seems to be here, but because of the overlap it simply can not be a third wave. Third waves can not be diagonals.
But, but, but .. there is a version of this count which can make the whole structure a contracting leading diagonal. It would be counted this way.

This version of the count is much less proportional and would invalidate below a certain level. Keep your eye on the length of (v) versus (iii).
There is an even larger version of this diagonal which places (iii) at the very low, and up wave overlap is still required. Possible.
The issue with the x(v) count AND with the contracting diagonal count is that deep retraces are possible. That's fine. If they happen, they happen.
But, but, but,,there is one version of the extended fifth wave count that has a shallower retrace.

It is still an extended fifth because it is longer than (iii) but, but, but .. there would be a flat wave currently under construction. This view might align more with where the 18-day SMA is currently located.
The bottom line is this: this is a time for maximum flexibility and patience if you can muster it. We can see different scenarios. In other words, this whole wave can be ((a)) at the minute degree, OR it could only be wave (i) of ((a)) at the minuet degree. I will look for ways to try to sort it out.
But this is what an Elliott analyst does. Remain open and flexible and do your best to count the waves on the way up. I'm telling you that if we are making a diagonal lower, the expanding variety is one of the most difficult to count at every twist and turn.
Have a good start to your day,
TraderJoe
SPX Cash Daily - Cash now has the overlap on the prior up wave.
ReplyDeletehttps://www.tradingview.com/x/w3IOmaLO/
TJ
..there is a cash gap just below the overlap. TJ.
DeleteNDX cash and RUT cash do not yet show the overlap. TJ.
DeleteUpdate SPX https://www.tradingview.com/x/atqeG66z/
ReplyDelete$NYMO on Stockcharts.com 2 year Low?
This is remarkable! Your work and effort as well as the situation in the market. The gap in SPX at 4221 may not get filled for years! Unless of course your Version 1 plays out..
ReplyDeleteThanks TJ
SPY (1x2) Potential support area -
ReplyDeletehttps://tvc-invdn-com.investing.com/data/tvc_a80cc6a0ae21d5f25e80b53f0fcfc3af.png
Thx. Was eyeballing the same. Didn't get around to measuring.
ReplyDeleteBy now, the contracting diagonal should be ruled out, because (v) is longer in price compared to (iii). Flat construction is questionable or also ruled out because (b) is more then 200% of wave (a) - max is 161% for an expanded flat. Am I getting this right?
ReplyDeleteyes, both are ruled out at this point. TJ.
DeleteBtw, thanks for your work. Its always a pleasure to follow your thoughts and the comments here!
ReplyDeletewelcome. TJ.
DeleteEchoing others' comments: thank you, Joe, for presenting excellent viable alternatives!
ReplyDeleteWelcome KO. TJ
DeleteNow NDX has the overlap.
ReplyDeletehttps://www.tradingview.com/x/y7eOuOwM/
RUT does not quite yet.
TJ
Anyone else think they can run the S&P all the way up to 5K in time for the midterms? Expanding wedge top.
ReplyDeleteThat would be an interesting EW development. :)
DeletePlausible, but it would likely require a Powell pivot, and that is not in the cards just yet. TJ.
DeleteA new post is started for the next day.
ReplyDeleteTJ