Here is the SPY daily chart in Hi-Lo format only. There is - as we have noted several times earlier - the possibility of a diagonal wave here in the SPX/SPY/ES. But, depending on the count that precedes it, it does not have to form beyond this point (just remain w-x-y) or it could fail. See below.
 |
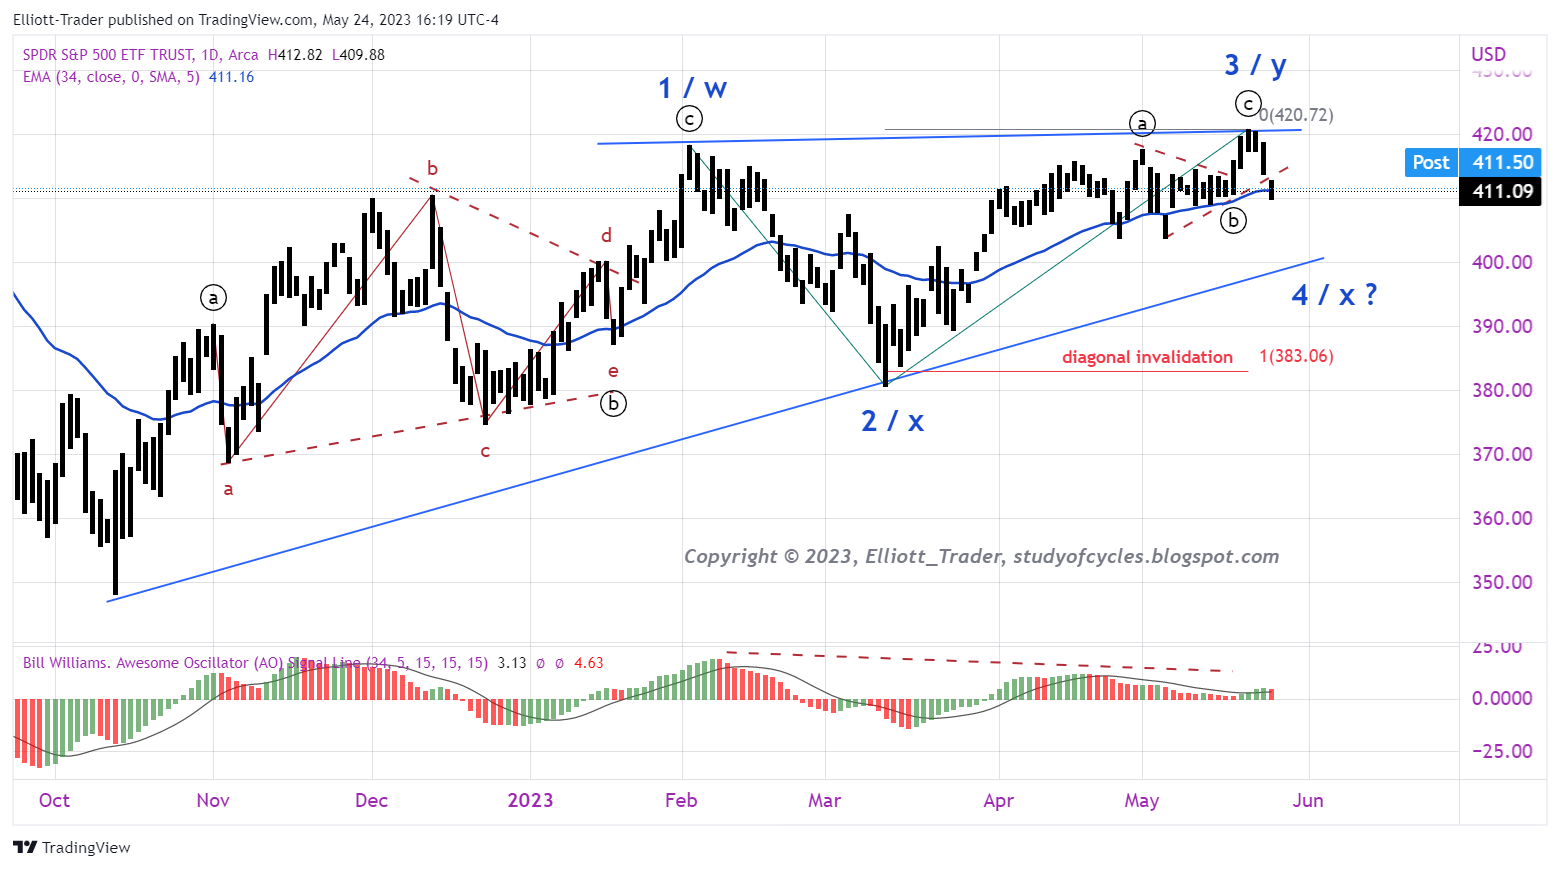
| SPY Cash - Daily Range - Possible Diagonal |
The local brown-dotted up trend line has broken lower. If there was a triangle minute-b wave, circle-b wave, today broke the e wave low of it. The next target might be the lower blue up trend line, shown for wave 4 or x.
In terms of invalidation, a fourth wave, 4, could not become longer than the second wave 2. So, it must hold 383.06 but it would be better if it only traveled 62 or 78% of that distance to maintain the "right look" of a diagonal.
There are three counts that diagonal could form for. They are:
- Diagonal for Minor C of Intermediate (2), or Intermediate (B)
- Diagonal for Intermediate (5) of Primary ⑤ of Cycle V.
- Diagonal as a Leading Diagonal
In the first two cases - if the fourth wave forms properly - since these are ending structures the diagonal might complete properly with a higher fifth wave or they could fail. However, in the last case, the case of a leading diagonal, then the diagonal must complete properly with a higher fifth wave.
And, yet still, any second wave or (B) wave could just be a w-x-y wave, the double zigzag as is shown also shown.
There is also a sneaky way that the third wave, 3 / y, is not over yet, and that is if we are still making a complicated minute-b, circle-b, downward still as a flat wave. Then, there would be a larger minute-c, circle-c, wave up. So we'll have to watch and monitor as we do for any potential diagonal.
And it still goes without saying that the diagonal counts are still of concern as ending diagonals as they do not display 62% or greater retraces for their second wave. It's not required that an ending diagonal does, but it is a guideline which is currently not being followed.
So, be cautious, patient and calm and do your best with the local technical like the daily and intraday Bollinger Bands (intraday wave-counting-screen). We'll update you as best we can.
And have a good start to your evening.
TraderJoe
Remarkable inter-market futures price divergence. I have never seen anything that extreme. Looks like something big is afoot...
ReplyDeleteYeah. Compare NQ and YM. ES is the average of those two.
ReplyDeleteAs I have said before, generative AI may produce a small number of big winner companies and a large number of losers. Due to networking effects. Clearly MSFT and NVDA are the tip of the spear.
I'll leave the analysis of the implications of this for EW patterns to ET who is very good at it. But bottom line, when you traders go long, you may want to focus on NQ. Conversely, when going short, focus on YM or RT.
The divergence will not persist, therefore they key is to determine who is lagging whom; getting that right is the correct objective for traders imho....
DeleteSPY 15-min: looks like the Nvidia results have provided a wave to the channel in a more complex fourth wave between 38 - 50%. By guidelines 'should' hold around here for an impulse with 105 candles on the chart. Will probably get to about 120 candles or so if/when there is a vth wave lower.
ReplyDeletehttps://www.tradingview.com/x/joYylHAY/
TJ
SPY 15-min: I would put a wave-counting-stop around 62% of wave iii/c. Watch to see if this 15-min candle 'engulfs' or not. And then mark the fractals, as shown, as the lower ones as they near.
ReplyDeletehttps://www.tradingview.com/x/lKDxU1o0/
TJ
..the engulfing candle did form properly. Watch for confirmation lower candle. TJ.
DeleteSPY 15-min: the confirming 'significantly' lower candle did occur. Next target would be a break of the down (red) fractal lower.
Deletehttps://www.tradingview.com/x/bpJc9h3h/
TJ
Qs look like a leading expanding diagonal off the top, complete with wave one over-lap.
ReplyDeleteNQ are pending lower trend line break. There is still room on the upside, but not much as ⑤ would have to be less than ③.
ReplyDeletehttps://www.tradingview.com/x/2P0z0F92/
Please keep in mind I don't view it as my responsibility to update everyone's favorite chart. I am here to show what I think are the general principles, and people should apply the principles to their charts.
TJ
While the old wave-counting-stop at 62% x iii was not hit, it is suggested to lower the stop to the new level, as it will be less probable to keep a fourth wave with a higher high.
ReplyDeletehttps://www.tradingview.com/x/TOaiScBd/
Also, the only way to make a new low is with v = 0.618 x net (i through iii), or v = iii.
TJ
Thanks a lot
ReplyDeleteTj quick question in contracting ld , does 3 have to be shorter than 1. Some references say 3 cant be the shortest but it doesn't have to shorter than 1. Thanks
ReplyDeleteBad references. The 'rules' as outlined on page 87 of The Elliott Wave Principle by Frost and Prechter state that in a contracting leading diagonal (or a contracting ending diagonal) wave 3 'must' be shorter than 1. Further wave 5 must be shorter than 3, and 4 shorter than 2. That is very definition of 'contracting'. In other words, the trend lines 'converge' not 'diverge'.
DeleteOnly in the expanding diagonal can 3 be longer than 1, but then 5 'must' be longer than 3 and 4 longer than 2. In other words the trend lines 'diverge' or expand rather than contract.
If you do not have a copy of the 'rules' as published, it's worth picking them up.
TJ
Thanks
DeleteQQQ currently filling a gap dating Back to April 8 2022 I have had this green line here for a year I must say this strength in the QQQ is impressive
ReplyDeletehttps://www.tradingview.com/x/BPOAjXIG/
VIX 7 weeks of testing the multi year green rail
ReplyDeletehttps://www.tradingview.com/x/QbW2ykCG/
Tj,
ReplyDeleteNasdaq is almost @61.8% retracement of its entire fall.
Seems like a paraboli move up.
Waiting eagerly for your views
A new post is started for the next day.
ReplyDeleteTJ