Market Indexes: Major U.S. Equity Indexes closed lower
SPX Candle: Lower High, Lower Low, Lower Close - Yin-Yang Candle
FED Posture: Quantitative Tightening (QT)
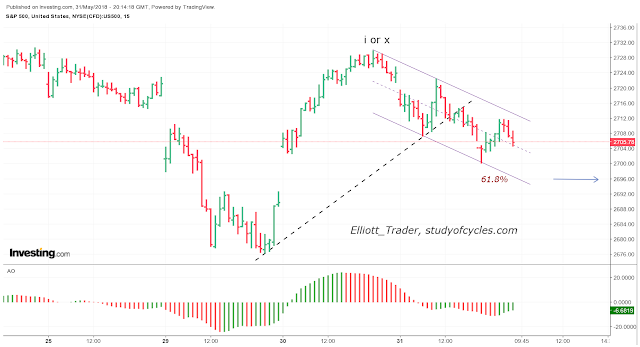
Let's get right to the chart and keep this short and sweet. Prices gapped lower today and did not fill the gap.
 |
| S&P500 Cash - 15 Minute - Decline |
During the live chat room session, we identified the (dotted) three-touch trend line, and it's break lower with the lower lows, and prices currently trading in a channel for the bulk of the day.
Although price made some progress lower, it was a very choppy day, and the 61.8% Fibonacci retracement level (shown) at 2,696 was not attained in the downward direction. As long as price continues in the channel or below it, we must consider a downward trending wave still in force. At this point there can be a double zigzag lower with Y just slightly greater than W. This could turn into a triple zigzag lower, or it's cousin, a leading diagonal. We won't know until we see either more downward price movement, or if price breaks the channel in the upward direction.
Again, this could be wave ii if the minute (e) wave of the triangle ended on May 29th. Or, if a leading diagonal takes hold, then the minute (e) wave can still be continuing, lower.
Only time will tell. Stay flexible, patient and calm. And most importantly, have a good start to your evening.
TraderJoe
Hi Joe. I think the D wave is the complicated one. Considering nasdaq is making an ending diagonal. Might be wrong but from weekly perspective, it seems so..
ReplyDeletethanks Joe, If price breaks above the top channel and crosses above the dotted line does that suggest a wave 3 of x or possibly e is done.
ReplyDelete