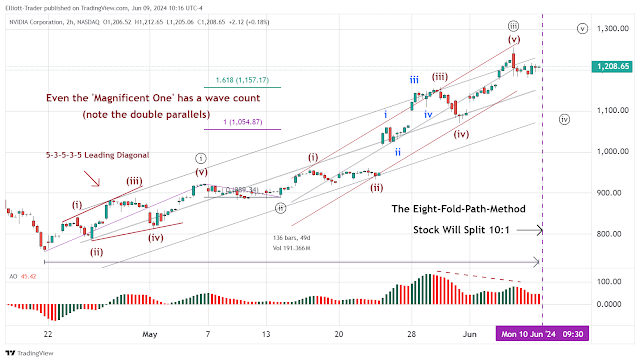
Below is the 2-hr chart of The Magnificent One, NVDA, using The Eight-Fold-Path-Method with 136 candles on the chart (well within recommended range of 120 - 160 candles). A beginner can learn a lot from this chart.
 |
| NVDA - 2 Hr - Local Count Using TEFPM |
Here are some of the typical Elliott-Wave features that can be noted.
- The 5-3-5-3-5 Expanding Leading Diagonal (overlapping) to start the move.
- The double parallel channels within wave minute-iii, circle-iii.
- The clear five-wave-sequence (i) - (v) within minute-iii, circle-iii.
- The clear five-wave-sequence i - v within minuet (iii).
- The gaps in wave (iii) and wave (v).
- Wave minute-iii, circle-iii, "turning to the left" and above the channel.
- The peak of the EWO on (iii) of minute-iii, circle-iii.
- The divergence of the EWO on wave (v) of minute-iii, circle-iii.
But also notice from a "degree labeling" viewpoint, wave (i) is shorter in price and time than minute-i, circle-i. Wave (ii) is shorter in price and time than minute-ii, circle-ii. Wave ii is shorter than wave (ii), and so on as wave minute-iii, circle-iii expands by the smaller degree waves, some of which we can't see because of the gaps.
Now, as we know, the stock will split on Monday, reducing the nominal value of the waves from the 1,200 level to the 120 level. Still, the same count will apply. Meanwhile, as a follow-up to the post from May 25th titled, "An Indicator to Watch", which can be found at this LINK, we suggested that alert readers keep an eye on the number of NYSE net new highs, if there was any further price high. Well, that new price high happened last week. Look where the indicator is.
Clearly there is yet another major divergence from the high. It is not the only such divergence noted. Others include both the McClellan Oscillator, as well as the raw cumulative number of NYSE advances versus declines ($NYAD). Things are not only getting thin out there. They're getting "thinner-than-thin".
This is the second post this weekend, and if you have not read the first one, yet, you may wish to.
P.S. Here's a chart of the 'new' NVDA after the split. RSI divergence in the 3rd wave, too,
Have an excellent rest of the weekend.
TraderJoe


is that a triangle for circle ii wave
ReplyDeleteNo, you can look at it for yourself below, but just looks like a "running flat" with the Fibonacci corrective levels shown. One 'should' expect "running waves" or "downside failure waves" in a strongly up market.
Deletehttps://www.tradingview.com/x/gapzZ4l2/
TJ
TJ,wave circle 3 has extended. Can wave 5 extend also? Another observation maybe we will have a non confirmation in the RUT and the Dow 30 like the year 2000. Also what tends to bring in major tops is the splitting of market leaders because of the multiple times of increase in the supply of shares. Long bull runs end when supply overtakes demand.
ReplyDelete"When wave 1 is a diagonal, then wave 3 is usually the extended wave in the sequence," directly from the Elliott Wave Principle. Can wave 5 extend? Yes, it 'can'. Will it? Lower probability, but 'possible'. TJ.
DeleteIs it a problem that blue I and iii appear larger than red (i)?. I am on the phone, so measuring is next to impossible.
ReplyDeleteAll depends on 'exactly' where blue i and ii ended. Is ii a flat, with i ending earlier? I don't know, and it is too difficult to tell because of the gap. But, the expansion of (iii) started off correctly, so it likely proceeded correctly. Can't say 'for sure' but the EWO takes over and says (iii) is a 'third wave'. TJ.
DeleteNVDA - post split: chart added above, this morning, to main blog post. TJ
ReplyDeleteanyone seeing a running triangle in spx cash since june 6
ReplyDeleteScanning a few other EW sites, I'm seeing various options being presented: "b" wave top (big B); a nearing wave 3 top in line with TJ's recent charts; a straightforward blowoff with extended fifth wave subdivisions; and one other count with multiple sets of 345 unwinds left to go. I'm not seeing the larger degree wave 3 top as imminent (just yet), even though I'd "like" to see that happen to resolve the big picture. Mid July? Patience does seem to be the play, yes. But will the market give an unmistakable clue like this so clearly?
ReplyDeleteA new post is started for the next day.
ReplyDeleteTJ