Saturday, June 29, 2024

Nick the High, Nick the Low: Weekend Update

Thursday's bar on the ES futures was a small outside-range-day up. Price should not take out the low of an outside day up within two trading days or it might constitute a trap for the bulls. Well, Friday started out much higher, with prices up some 40 points from the prior close on reaction to news reports in the morning. When the cash market opened, the SPY cash price nicked out a very minor new all-time high, and then reversed. The reversal was to the full extent of that outside day up and undercut the low of that prior outside-day-up, but not the entire topping formation just yet. In addition to springing a possible trap for the bulls, this created yet another outside-day-down bar which was larger than the one made on June 20th. Once again, now the high of the outside reversal bar down should not be taken out in the next two trading sessions or else it becomes a trap for the bears.

ES Futures - Daily - Lost Embedded Status


With the daily slow stochastic not embedded, the usual expectation is for price and the 18-day SMA to try to come together before a new high is made, which they are attempting to do. Notably, the ES futures did not make a new all-time-high. Whether this created a truncation failure or not remains to be seen. We reminded everyone that today was the last day of the month and the last day of the quarter. Monday would start the potential inflow cycle all over again. The question is whether there is enough gas in the tank to take out the high of the latest outside-day-down or not. So, we remain patient, calm and as flexible as possible on the daily timeframe. Clearly, price is in some whippy kind of a iv, v sequence. It is literally a matter of how it might finish - or whether it has already.

The weekly timeframe chart is below. Not much has changed since the last update. Of note, this week was an inside week and it formed yet another 'spinning top' weekly candle at the upper weekly Bollinger Band.

ES Futures - Weekly - Against Upper Band

While we note that there is not yet good downside confirmation at this time, the inside week does have the potential to turn the swing-line lower temporarily (but not start a down trend, yet). The weekly slow stochastic remains embedded so it is possible the weekly Smart Money players may still try to find opportunities to press for the upper band again - like they did this week. Clearly this won't go on forever and we note that price has not been down to the lower band since October of 2023. We also noted previously, there were a Fibonacci 34 weekly candles to this week's high in the ES.

Because there was not a new monthly high in the ES the monthly chart remains unchanged and can be seen at this LINK.

The Cycle V chart remains the same and can be found HERE. Wave Intermediate (3) did obtain the new high required by this count.

Have an excellent rest of the weekend,

TraderJoe

Thursday, June 27, 2024

ES Sideways

After three daily lower ES closes in-a-row, the ES futures have traded largely sideways with three higher closes in-a-row. With price above the 18-day SMA, there is as yet nothing overtly bearish on the chart. And today was technically an outside-day-up, so we have to watch for two full days to see whether its low is exceeded or not.


ES Futures - Daily - Sideways

But the regular calculation of the daily slow stochastic did lose its embedded status and is now just over-bought again. This normally favors price and the 18-day SMA coming together again. But price really needs to break out of the range for better local trend determination.

Have an excellent rest of the evening,

TraderJoe

Tuesday, June 25, 2024

ES Inside Day

Here is the daily chart of the ES futures. Today's bar is an inside day. The significance of the inside day is that it temporarily turns the swing line indicator up. What this means is that a lower low day would now make a pattern of lower highs and lower low (although we don't know if that would be above or below the 18-day SMA).

ES Futures - Daily - Lost Embedded Stochastic

Further, the daily slow stochastic did lose its embedded status today and is now just termed over-bought. The only day the slow stochastic can get its embedded status back is the next day (i.e. Wednesday). Otherwise, if it doesn't, it is probable that price and the 18-day SMA will try to come together. So, tomorrow is an important day. Let's see how it goes.

Have an excellent rest of the evening,

TraderJoe

Monday, June 24, 2024

ES Daily

Here is the daily ES futures chart. Today was another outside day down. It's kind of rare to see those within a couple of days of each other. Certainly, the trap for the bears (taking out the high of the outside-day made on 24 Jun within the next two trading sessions) was not sprung. In fact, the two lower low days may serve to confirm that first outside candle.

ES Futures - Daily - Stepped Out of Uptrend

Notable on today's chart while the wave-count may have completed, the daily bias is still up as price remained over the 18-day SMA. Further, the swing-line has a higher high but a lower low and is still above the 18-day SMA, so it is not trending downward as of yet. However, the mixed swing-line means the market has - at least temporarily stepped out of its uptrend.

Further, the daily Slow Stochastic this evening is potentially losing its embedded status with a reading of 74 (under the 79 limit). But one must wait until the close tomorrow to verify whether it gets lost or not. If the embedded status should be lost, then price and the 18-day average may try to come together - sometimes on the same day.

Price today made one daily overlap, but not a significant one, yet, in terms of the wave count.

Have an excellent rest of the evening,

TraderJoe

Saturday, June 22, 2024

Weekend ES Review, M-O-B and ALT

Professor Lawrence Krauss (University of Arizona) has often made this statement (paraphrase), "My greatest hope for you is that someday your son or daughter will leave the house, go to college, and have some deeply held tenet of their life completely upended. Because that's what scientists do practically every day. They go to work. They frame a hypothesis. They may work on that hypothesis for years. They may hold it deeply. They test that hypothesis. And if it fails, they don't whine or moan about it. They accept the failure as valid, and they move on to frame a new hypothesis and start the cycle all over again."

While we are not claiming the Elliott Wave Principle is elevated to a science yet, for the last many months we have framed a long-term hypothesis, and we are testing it now. That hypothesis is shown below in the monthly chart of the ES futures contract. The simple hypothesis is that price may be forming the pattern known as the Contracting Ending Diagonal to make a primary th wave.

ES Futures - Monthly - Contracting Ending Diagonal?


Those of you familiar with the pattern know that in such a pattern, by the rules, Intermediate (5) must be shorter than wave (3), and this must be shorter than wave (1). And, if wave (3) holds to this length, then wave (4) must be shorter than wave (2) and likely still overlap wave (1). We are now testing the limits of wave Intermediate (3) because, after about 78% - 80% of wave (1), the contracting pattern begins to lose its 'right look'. It begins to look more parallel than contracting. But, so far, there is the higher high, the MACD on this timescale is diverging, and price is reacting off the 78.6% Fibonacci extension level. The lower trend line has held well, and the question now is, "will the upper trend line hold, too?"

And still, there is a further interior pattern being tested. And that is, within Intermediate (3), IF wave Minor A was an expanding diagonal, then by the principle of alternation, wave Minor C should be an impulse wave.

So, that brings us down to the two-daily S&P500 chart. And while this pattern, shown as the black count, currently works on the ES futures, I wanted to show that it also works on cash at the moment from the point labeled Minor B. The hypothesis in this chart is that minute-i (shown as xⓘ) is the extended wave in the sequence. This is because of the very shallow retrace for the second wave. And the third wave, minute-iii is currently shorter than minute-i.

SPX Cash - Two Daily - x wave

So, this provides us with a cash make-or-break level of 5,536 where minute-v would become longer than minute-iii. Beyond that, we must simply accept the result and move on to a new hypothesis. As you can see, the current cash high is 5,505. That new hypothesis - if required - is shown in red as the ALT wave. We're not going to cover it in detail now because the current wave has not broken. But, if the wave lengths turn out incorrect, we'll drop the old count in a hot minute and adopt the new one.

So, that beings us down to the current weekly and daily charts of the ES futures. They appear below with some points of discussion following the charts.

ES Futures - Weekly - Test of Upper Bollinger Band

One can see that the weekly bar popped up over the weekly upper Bollinger Band and made a candle in the form of a Spinning Top - which would still require downside follow-through confirmation to become activated. But look back for the past 100 candles. How many times has the ES been above its weekly Bollinger Band? And yes! That slow stochastic is still embedded. But here is where we said we would translate the current wave degrees from the weekly to the daily chart. This appears, above, and in the daily ES chart, below.

ES Futures - Daily - Test of Upper Bollinger Band

In case you're wondering, it just doesn't make too much sense to do the weekly chart before the end of the week because it is difficult to assess the type of weekly candle until the weekly close is known, especially given a quad-witching on Friday which can be quite volatile.

So, given the usual caveats of caution, patience and flexibility, let's see how things go this coming week.

Have an excellent rest of the weekend.

TraderJoe

Friday, June 21, 2024

Purpose and Ground Rules

Purpose 

The purpose of this site is to count the Elliott Wave following a 'rules-based' approach and to utilize it to assist in marking market turning points (highs and lows) to the extent possible.  

Not Purpose

This blog is specifically not a 'trading' blog. Topics such as "how much money you made on buying or selling you name it .." are not welcome here and do not belong here. Strategies for how to make money, such as 'which options to buy or sell, which stocks to buy or sell, etc.' are also not welcome at this site. Again, the topic is counting the Elliott Wave. Stick to the topic or please do not post comments here.

This blog is also not about fundamental analysis (GDP, company news announcements, etc.) except as may be specifically related to a particular wave count.

Key Ideas

One

A rules-based approach to Elliott Wave analysis can be utilized to help identify market turning points. One key rules-based approach we have suggested is linked below. It is The Eight-Fold-Path Method for Counting an Impulse Wave.

The Eight-Fold-Path-Method for Counting an Impulse

The above post was the "Featured Post" on this Site for over a Fibonacci eight (8) years before being replaced by this one. It is still central to understanding this blog.

Two

A second key-idea relates to the fact that a number of trading algorithms - rightly or wrongly - help create market turns by adhering to technical indicators other than the Elliott Wave. One most notable is the daily, weekly (and sometimes intraday) Bollinger Bands. And, because we do care about finding turning points - and even trading in the final analysis - we have posted another rules-based approach which we have paraphrased from broker Ira Epstein as in his publicly available videos. It is based on Bollinger Bands and momentum. You can find that approach below.

Paraphrase of Ira Epstein's Rules for Trading

But, again, even though we care about trading and do trade ourselves, we don't outline trades taken via Ira's methods or not. This is again because this site is about counting the Elliott Wave - not about following Ira's system. If a person wishes to do that - they are free to generate their own charts based on his system and proceed as such. We often do it ourselves. Further, we note that many distinguished mathematicians (Mandlebrot, Taleb) have argued that stock market movements are not normally distributed (do not follow Bell-Curve statistics which the Bollinger Bands are based on). So, such an identified turning point often has a chance of being accurate, but not necessarily. And this is an argument against this approach.

Three

Even though rules-based approaches are helpful, wave-counting is still a probability exercise in which wave counters and traders try to assess their best odds for a correct count or a correct trade. To that extent, we have again elaborated a bit on what we mean in this post.

Snake Oil or Not? : Probability In Wave Counting

Four

No one said wave trading was easy. It is prone to mistakes. Glen Neely has summarized The Five Most Common Mistakes that Elliott analysts often make. The full audio interview appears at this LINK. But our paraphrase of it appears in this blog post.

The Five Most Common Mistakes Elliott Analysts Make

Five

Based somewhat on the above summary of mistakes, we have posted what we think is the largest mistake professional Elliott analysts have made in counting the up wave since the depression. This appears below.

The Largest Single Mistake Most Analysts Have Made

Respect

Because we recognize that market returns are to some-extent a game of "odds", people who comment on this blog are to respect each other. No one person, no firm, no wave counter, no trader ever has a perfect assessment of the odds. And, as a result, there is no perfect trade. If you got the direction right, your trade size wasn't large enough. Otherwise, you'd be rich and flying to the Turks in your private jet; not reading this blog. And if your trade size is too large you risk being ruined by getting the direction wrong. So, be as kind to each other as possible within the context of this blog. We are all fallible. We always will be. We are a biological entity. And sometimes these have neuronal, hormonal and other glitches that cause us to be incorrect or have faulty expectations. Please recognize this for all including the blog moderator.

Free Site

Unlike many other wave-counting-sites that try to extract money from you for the privilege of reading, or the privilege of counting to five, this site specifically does not. For this reason, it is easy to be a reader of this site. It is a bit more difficult to be the moderator. We try in every possible way to keep this site open for commenting with regard to the Elliott Wave. BUT, commenting for your own website promotion, for your own ego gratification, or to the detriment of this blog simply won't be tolerated. And the moderator reserves the right to remove any post, to call out those who are not following the ground-rules, to report harassment to the blog operators, or to discontinue comments at any time in order to maintain the purpose of the blog.

Links

There are two easy ways to post Elliott Wave ideas on this blog. The first is use a free charting service like Investing.com, TradingView.com or Barchart.com and use their link feature to post a chart via their link. We often do this and find it most convenient. The second way is to use a free photo site (like Flickr, etc,) to save your chart as a picture and then post a link to the picture/chart from that site. The blog moderator has no vested interest in any of these sites, other than he may be a user at times.

Prohibited Links

Once again, you may not post a link to your own website if you request payment or donations from others. Further, you may not post links to other paid websites. An occasional link to a reputable news site regarding a matter that may have technical relevance (Bloomberg, CNBC, CNN, ZeroHedge, etc.) is acceptable. The moderator may occasionally post a link to a paid site (McClellan Financial, Elliott Wave Intl, etc.) if directly related to the topic at hand, but it is not in any way an endorsement of same nor a statement as to the quality of the analysis provided.

Disclaimer

Nothing in this blog is to be taken as trading or investment advice. The moderator is not a financial advisor. Nothing within the blog or its contents is to be taken as a solicitation to buy, sell or hold any stock, bond, option, or financial instrument or contract of any type. By reading this blog, you recognize that trading or investing can be risky endeavors and cause a loss of some or all of your capital. Further, you agree that any gains or losses you incur are the sole result of your decisions and agree to hold this blog and its moderator free from any claim to the contrary. All information published by the moderator is the sole property of the moderator. It may not be copied or transmitted in any matter without the specific consent of the moderator.

We hope you will join us freely in an experience in wave-counting without distracting from it by lack of adherence to these simple ground rules.

Thanks, and enjoy.

TraderJoe

Thursday, June 20, 2024

September Roll

Here is the requested chart format, rolled forward to the September ES futures contract. Today hit yesterday's upper daily Bollinger Band resistance and the 5 = 3 initial EW resistance, made a slight new high, and then turned lower forming a bearish engulfing candle (or outside key-reversal-day, lower).


I do not wish to repeat items plainly on the chart, but the Bollinger Band resistance and EW resistance have moved up a tad. More importantly, the daily slow stochastic is still embedded and often that means that the Smart Money will buy on significant pullbacks trying to press price back up into the band again. When they do this, they will do it until the red line of the slow stochastic closes back under 79 again, thereby losing the embedded status. That hasn't happened yet. For an example of this, see the May 23, 2024, bar, above. (Caveat, this often happens but not always.)

Further, if the high of the outside key-reversal-day lower is taken out within two trading days, it is said to spring a trap for the bears. Similarly - from a candlestick perspective - although the day's bar is a bearish engulfing, like most candle patterns follow-through in the form a significantly lower close is needed to better confirm the pattern. If not, without significant overlap, it can just be the 'c' wave of a larger fourth wave.

Have an excellent start to the evening,

TraderJoe


Wednesday, June 19, 2024

Experimental - Feedback Requested (2)

Thanks for the feedback, so far. Here is another example which is not so clear and there are ones that even get murkier than this. This is the current daily chart in August Crude Oil. Other features of the chart appear below it (I won't repeat all of what is plainly on the chart).


Features of the chart:

  1. Wave i is an Expanding Leading Diagonal. Readers should prove this on a smaller time frame.
  2. Wave iv does not overlap wave i. Wave v has a lower low.
  3. Wave B is a Regular Flat, a-3, b-3, c-5. Wave C is 78.6% x Wave A.
  4. Wave C diverged on the Slow Stochastic. It was a 'faster' wave than wave A.
  5. Waves A, B and C best fit in a corrective parallel trend channel. Readers should verify this.
Prospects:

The daily slow stochastic is over-bought only, so unless or until it embeds it is not likely to attract much Smart Money buying at this level - perhaps at a pullback. This is not to say prices can't go higher. They can. Price is currently at the 62% retrace level. It could go to 78.6% after time, particularly if the wave formation is part of a triangle. One should note that the C wave did not undercut the prior weekly low - which is one sign of a triangle.

Current Up Wave Since C


Feedback is still requested.

Have an excellent rest of the Juneteenth Stock Market Holiday,
TraderJoe

Tuesday, June 18, 2024

Experimental - Feedback Requested

ES Daily Bias - Up    (Price over 18-day SMA)     

ES Swing Line - Up    (Higher Highs and Higher Lows over the 18-day SMA)

Moving Average Bias - Bullish Configuration    (18-day above 100-day above 200 day)

Daily Slow Stochastic - Fully Embedded    (above 80 for more than three days).


Next Upper Bollinger Band Resistance - 5,518

Next Upper Elliott Wave Resistance - Wave 5 = Wave 3 at 5,518

Next Lower Support - 5,371    (Price returns to 18-day SMA)

Note: wave degrees in the above chart are shown as relative only and will be corrected on the weekly chart. Further, the wave counts are tentative only until such time as the waves make a sufficient retrace that overlap or another problem prevents continuing with this wave count.

IF you are a regular reader of this blog, please let me know if you prefer the constant rehash of the basic trending information or not. If people lose sight of it and find it is useful to help them keep it in mind, I will try to find an even easier way of presenting it. But "buyer beware". You will often AT TIMES have to put up with inconsistencies, like, "Daily Slow Stochastic became unembedded today. Only day it can re-embed is tomorrow." Etc.

I hope all regular readers of this blog will voice their opinion on format. Otherwise, what am I writing for?

Have an excellent rest of the evening,

TraderJoe


Monday, June 17, 2024

Three And One

The ES 2-Weekly Chart with about 114 total candles for the "wave-of-interest" has three price Fibs and one time Fib either here or "due".


 The three price Fibs are:

  1. (3) = 0.786 x (1)
  2. C of (3) = 1.272 x A
  3. Alt (B) = 1.618 x Alt (A)
The time Fib is (3) = (1) or thereabouts. The current up wave is labeled as a third wave as there is as yet no proof that the up wave is concluded, even though we can count it so. Further, the Elliott Wave Oscillator has a near-equal high at this location which is often a sign of a third wave.

Today saw all-day buying from the cash open until about 14:00 ET. Price traded up into the upper daily Bollinger Band and then made a very small down move from there. Likely some of this was due to the "Nightmare Rollover" we wrote about in a previous post. Today saw only a pretty-even split in the advance-decline line, and more new lows than new highs.

Have an excellent start to the evening,
TraderJoe

Sunday, June 16, 2024

Simply

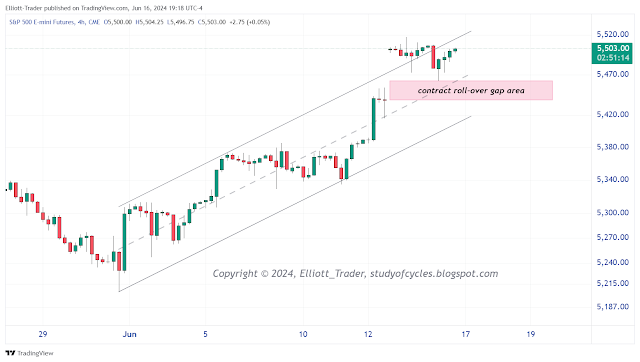
Simply watch the ES 4-hr futures below for either new highs or contract-roll-over gap fill. A complete up count can be counted, but that does not mean that there won't be extensions. There could be, but they are not required.


If the gap fills and the lower channel breaks, we'll have more to say at that time.

Have an excellent rest of the evening and start of a new week.

TraderJoe

Thursday, June 13, 2024

Count - No Alternate at this time

Here is the ES 8-hr chart. No alternate is needed at this time. Price may be trying to wrap up the vth wave.


Have an excellent rest of the evening.

TraderJoe

Wednesday, June 12, 2024

Another Nightmare Rollover

As if just the economics of the day aren't enough to keep traders perplexed, look at what TradingView thinks the futures roll-over will look like tomorrow.

ES Futures - Rollover Concern

On the left is the price of the current contract, ESM2024, the June contract in white highlight over green it says the current price is 5,435.25. Now look over to the right to the first line in the table. See where it says, "500, 5,500 72.7 1.34%"? That means, as of tonight, TradingView is pricing in the September contract ESU2024 at a price of 5,500 or up +72,7 points from the current price.

This is worse than ridiculous. Even though today I said I could see the 5,500 Fibonacci level (55 x 100), to see it in print with such little price discovery action - such little volume - makes a mockery of the process. It makes it completely ridiculous for anyone trying to set price targets.

I don't care about the back-adjustment-button. This is near where the new contract will be priced when it is more actively traded. This is vastly, vastly different from pre-Covid times when the rollover would be 8 - 15 points. As far as I'm concerned, the CFTC needs to look into why this is happening now and why it is different than historical. What has changed to justify this?

Have an excellent rest of the evening,

TraderJoe

Tuesday, June 11, 2024

One Change

On the SPY 1-Hr chart, the fourth wave iv became a little more complex today. The channel was dropped a bit. There are enough waves and a slight new higher high to argue for a completed count. It is now a question of if the extensions are done.


We'll see what Wednesday brings in terms of the CPI and the FOMC results. Have an excellent rest of the evening.

TraderJoe

Monday, June 10, 2024

No Changes

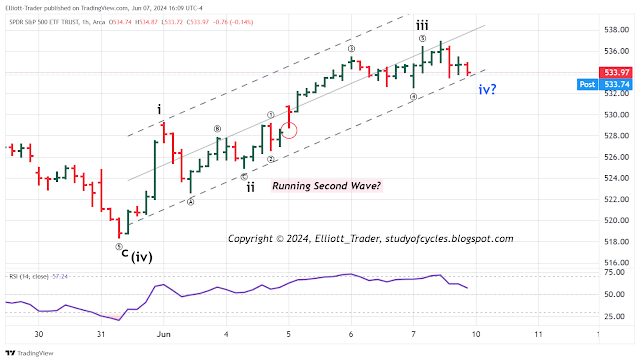
There are no changes to the SPY 1-Hr count at this time. The wave is acting a bit quirky. Look over the chart below and I'll comment briefly.


There is a way to count that blue wave iv as a flat wave. And it would be at the prior wave . And this would make some sense with the break of the Neely 0-ii trend line. Wave  broke it once but recaptured it by the close. Wave iv has now broken it (the Neely 0 - ii trend line) and has several hourly closes below it. This wave iv would now show alternation with wave ii.

What's quirky are now 1) the channel is a 'best fit' channel, and not a strict Elliott parallel. And wave three has not exceeded an upper channel boundary. This suggests weakness in the wave. And 2) today was a very strained wave as well. So, perhaps we are now into a longer triangle ivth wave or into a diagonal wave v. Very difficult to tell for sure.

Have an excellent rest of the evening.

TraderJoe

Sunday, June 9, 2024

Thin & NVDA

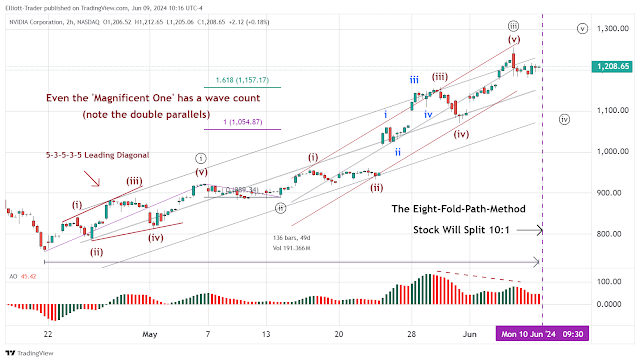
Below is the 2-hr chart of The Magnificent One, NVDA, using The Eight-Fold-Path-Method with 136 candles on the chart (well within recommended range of 120 - 160 candles). A beginner can learn a lot from this chart.

NVDA - 2 Hr - Local Count Using TEFPM

Here are some of the typical Elliott-Wave features that can be noted.

  1. The 5-3-5-3-5 Expanding Leading Diagonal (overlapping) to start the move.
  2. The double parallel channels within wave minute-iii, circle-iii.
  3. The clear five-wave-sequence (i) - (v) within minute-iii, circle-iii.
  4. The clear five-wave-sequence i - v within minuet (iii).
  5. The gaps in wave (iii) and wave (v).
  6. Wave minute-iii, circle-iii, "turning to the left" and above the channel.
  7. The peak of the EWO on (iii) of minute-iii, circle-iii.
  8. The divergence of the EWO on wave (v) of minute-iii, circle-iii.
But also notice from a "degree labeling" viewpoint, wave (i) is shorter in price and time than minute-i, circle-i. Wave (ii) is shorter in price and time than minute-ii, circle-ii. Wave ii is shorter than wave (ii), and so on as wave minute-iii, circle-iii expands by the smaller degree waves, some of which we can't see because of the gaps.

Now, as we know, the stock will split on Monday, reducing the nominal value of the waves from the 1,200 level to the 120 level. Still, the same count will apply. Meanwhile, as a follow-up to the post from May 25th titled, "An Indicator to Watch", which can be found at this LINK, we suggested that alert readers keep an eye on the number of NYSE net new highs, if there was any further price high. Well, that new price high happened last week. Look where the indicator is.


Clearly there is yet another major divergence from the high. It is not the only such divergence noted. Others include both the McClellan Oscillator, as well as the raw cumulative number of NYSE advances versus declines ($NYAD). Things are not only getting thin out there. They're getting "thinner-than-thin".

This is the second post this weekend, and if you have not read the first one, yet, you may wish to.

P.S. Here's a chart of the 'new' NVDA after the split. RSI divergence in the 3rd wave, too,

NVDA - Daily - Post Split


Have an excellent rest of the weekend.
TraderJoe


Friday, June 7, 2024

Count is Maturing

Here is the continuation of the SPY 1-hour chart from yesterday. It's a lot of back & forth and algo action. We 'probably' had the fifth wave of wave iii this morning after the jobs report.

SPY Cash - 1 Hr - Impulse

We may be into either a flat or triangle fourth wave iv. We might dither around until the FOMC report out next Wednesday, we might top earlier. The wave structures are getting very weak intraday. But there are no overlaps of major concern yet.

Have an excellent start to the evening,

TraderJoe

Wednesday, June 5, 2024

Most Expensive SPY in History

The SPY 1-hr chart is below. It reflects the most expensive SPY in history: wonderful for a long-term investment - eh? I though investors were supposed to 'buy low and sell high?'. Well, we shall see. The Elliott Wave count is shown on the chart. Nothing has changed.


We had suggested that wave (iv) in this chart, and the ES 4-hr futures ended at the May 31 low. It did. That is confirmed by today's new highs. The upward count looks like an impulse wave in a channel underway. There may have been a "running second wave" to augur for the gap-up, and strength that followed. We don't know that wave iii is done yet. It does not have to be, and it doesn't quite look like it.

As of the cash close, the ES futures had not quite gone over the prior high, but they could. If wave ii is a running zigzag, when we get there, maybe wave iv will be a flat or triangle for alternation. Time will tell.

Have an excellent start to the evening.

TraderJoe

Sunday, June 2, 2024

Being Patient

This monthly chart of the Dow Jones Industrial Average chart speaks for itself at present. As a wave-counter, I am just being patient to see if it does play out as a "too-far, too fast" wave with a diagonal at the end.


The larger degrees seem to fit well. A log chart is used due to the timespan. The EMA-34 has nice touch points, and the PPO is used instead of the MACD - again due to the long-term nature of the chart.

Have an excellent rest of the weekend.

TraderJoe

Saturday, June 1, 2024

Most Probably - Expanding Diagonal

In the prior post, we gave a likely route (in black) for prices if the ES was still in an impulsion upward on the ES 4-hr chart. We further indicated that prices had headed lower, possibly in a diagonal, and that price movement downward might not have been over. It wasn't - until about noon. After that, prices rallied strongly in what became an "outside reversal day, up". So, can we answer the question, "what form did the fourth wave take?" Based on the cash SPY index, we think the c-wave portion best fits the form of the expanding diagonal, and probably an ending one. Here is the SPY cash 30-minute chart.


If price did made an expanding diagonal, then its form is most likely the 3-3-3-3-3 form which most often would be ending. That suggests but does not confirm that new highs over the start of the diagonal would be made in less time than the diagonal took to form. Favoring this form is the Fibonacci relationship shown of micro- = 1.618 x micro-, which is common in expanding diagonals.

Notice that all of wave (iv) took the Expanded Flat form of an a-b-c Elliott Wave correction. This alternated with sharp second wave (ii) as we suggested, so this is further evidence that a wave (v), up, is being made. Within wave , down, there is yet another expanding diagonal down into the 522 area for wave (A), then a pair of yin-yang candles for wave (B), followed by the (C) wave drop down on the Chicago PMI news release into the 518.50 area. We have purposely not labeled those waves. Interested readers should locate them as an exercise. Remember, Friday was the end of the month - which often sees the window dressing which likely occurred on the decline. 

Since we had a Flat wave for wave (iv), if /when prices get over the high, then we can consider either the impulse for wave (v) or perhaps the contracting diagonal form if the market wants to drag out the exercise.

As a further reminder: if Friday was end-of-the-month window-dressing, then Monday might see the first-of-the-month inflows from the usual sources we have cited in the past (such as company bonuses, 401K, pension plans, dividend reinvestment schemes, etc.). Still, things can be whippy up here at these sky-high levels, so caution, patience and flexibility can still be valuable, too.

For later on, recall that Ira indicates that the low of an outside-day-up should not be taken out within the next two days or else it would constitute a trap for the bulls. So, the low of Friday becomes a very, very important price marker to remember.

Have an excellent rest of the weekend,

TraderJoe