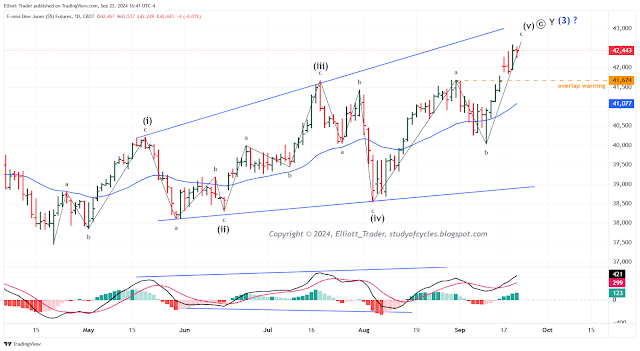
As you know I have long been a proponent of "counting every different stock index on its own terms". That is because of the great differences between both the number of and types of stocks in each index. Nowhen is that truer than now. Readers of this blog will note that both the NQ and RTY stock index futures have overlapped downward as of this Friday. The Dow (or YM futures) and the S&P (or ES futures) have not as of this time. That doesn't mean they won't. Still Elliott used the Dow Jones Industrial Average to represent the best of the U.S. economy. So, we will show that count below and see what it looks like at this time.
 |
| DJIA (YM) Futures - Weekly - In Channel |
Overall, so far, prices remain in a pretty strict channel. This is often a sign that the move is corrective in nature. So, let's deal with the elephant in the room first: with a corrective channel upward, the Principle of Equivalence says we must consider two counts as roughly equivalent. Those two counts are these. First, Cycle V top in 2021, then Intermediate (A), down and Intermediate (B), up. Then would come a large Intermediate (C) down, below the low of wave (A). This is shown in red because it is currently the best alternate count.
Second, Intermediate (1) at the top in 2021. Then, Intermediate (2) down in 2022, and this would be Intermediate (3), up, in 2024. This would be followed by an Intermediate (4), down, that would not exceed the low of Intermediate (2) and likely would not exceed it in length either. This is currently the preferred count as Intermediate (1) did not count well as a 'five'. It counted best as a 'three'. And, if this wave is a 'three' also, then, since it is now also shorter in price than Intermediate (1), then it could be the third wave of a very large terminal ending contracting diagonal. This suggests that Intermediate (4) will at least overlap Intermediate (2) downward, but not become longer than it.
Another reason for preferring the above count is that stock market tops are often a diagonal of some type. In fact, look at the waves above from April through August 2024. These waves can be counted as an expanding diagonal in their own right. And, if that count is correct, it suggests both a terminal move, and a retrace to the start of the diagonal in less time than the diagonal took too build. At least this portion of the count makes a prediction. Whether that prediction comes true depends largely on if we have that count correct or not.
Here are some notes on the degree relationships.
- Within Minor W minute ⓐ and ⓒ are both less than W.
- Within Minor Y minute ⓐ is less than Minor W - just by a fraction, but it is (see Fibo ruler).
- Within Minor Y minute ⓑ is less than Minor X.
- Within Minor Y minute ⓒ is less than W.
- By contrast the down waves as a flat from 2022 to 2023 would be longer in time than the entire down wave counted as either (2) or (B). And this would seem to be a violation of degree labels.
We note that the ES likely does not count in exactly this same way, as the time relationships in some of the waves appear different. And we also note the NQ futures - as we have already explained - have a longer wave up in 2024 than they did in 2021. Further, we will note the Dow futures did have a 'perfect' top last week with a higher all-time high, including a nice divergence on the EWO/AO. Other index futures may not have.
So, the best we can say at this time is that we likely will start down on Intermediate (4) or (C), and then we need to see what the wave lengths look like as we approach sentiment lows.
Have an excellent rest of the weekend,
TraderJoe


