Overnight U.S. equity markets were lower as measured by the ES futures. When the cash market opened it gapped lower and traded lower for about an hour. Then the first-of-the-month inflows started coming into the market and the cash and futures made a new higher high. After that, the market traded sideways to lower. The hourly chart of the cash SPY is below.
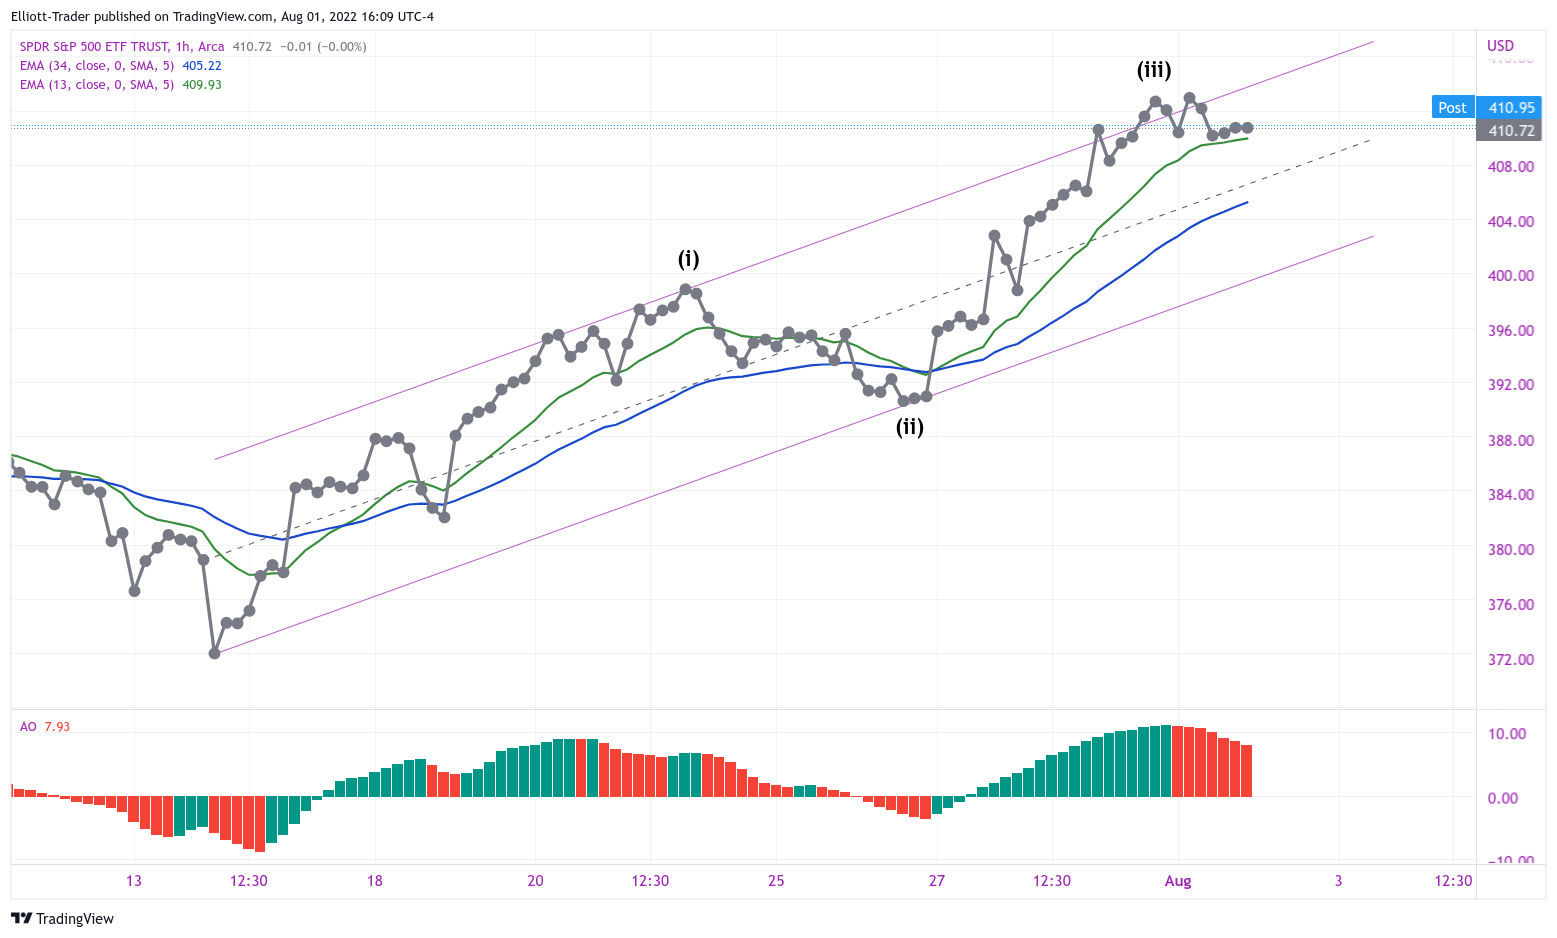
After today's new high, you can observe the hourly closes just "skimming along" the EMA-13. Not even a 23.6% retrace has been made on wave (iii), yet. Because wave (iii) has not exceeded it's length criteria yet, we are either in wave iv of (iii), today, or starting on the larger wave (iv) which might be a Flat to alternate with the sharp wave (ii). The daily slow stochastic is still above the 80-level. Price settled just about dead-on the 100-day SMA. And locally, the hourly Elliott Wave Oscillator is red and declining.
Remember, this wave might form a wedge, so a contact of the lower parallel for a fourth wave might not be in the cards (but it could).
Have a good start to your evening,
TraderJoe
SLV (dly)(0.1x1) - update [if interested]
ReplyDeletehttps://www.mediafire.com/view/out2lz25o9mhbum/SLVrdh0.1x1.PNG/file
From the (daily) Chart Report (free) - an interesting Quote of the Day -
ReplyDeletehttps://www.mediafire.com/view/umekm3nkyvsq4oa/Quote_of_the_Day.PNG/file
TLT (1x1) Structure breakout worth monitoring -
ReplyDeletehttps://www.mediafire.com/view/hetc5j4czg01tu7/tlt1x1.PNG/file
Yesterday after the close CNBC was showing 3m/10y inverting. It’s not now but it will again. This is almost a guarantee we are in a recession or will be soon. We are getting a short squeeze bear market rally and it can go higher but I still think we get a lower low. The fed seems determined to get inflation down even the doves are on board with this. I believe the fed funds rate and core PCE will merge around 3.5% - 4%, add in QT and you have a lot of demand destruction. What we know from history is the fed always raises rates to high, creating the boom and bust cycles we’ve been in forever. What I know about recessions is inflation and yields peak in recessions and then fall after. Have we already peaked? Maybe. Bear markets destroy portfolio's. Capital preservation.
DeleteAnyone noticed what ACTUALLY happened to the FED
Deletebalance sheet last month? Crickets from mocking-bird media.
This comment has been removed by the author.
ReplyDeleteNYAD - Observations
Deletehttps://www.mediafire.com/view/uytrnvfmbhgf2ht/nyad.PNG/file
Thanks TJ, for a wedge formation do we have a time frame to be considered? I mean how to judge that it is in formation?
ReplyDeleteSPY 1-Hr: here is the opening half-hour; punched below the EMA-13 (but remember this hour is not closed yet). Very whippy. Wave (iv) could be a-b-c as a Flat or w-x-y as a Flat.
ReplyDeletehttps://www.tradingview.com/x/kv8m3TXr/
TJ
FYI...https://www.ctvnews.ca/world/pelosi-believed-headed-to-taiwan-raising-tension-with-china-1.6010521
DeleteTo live? (Lol, j/k) TJ.
DeleteAside - 10yr-3mth yield curve (0.10x1)- Are we there yet? [if interested]
ReplyDeletehttps://www.mediafire.com/view/mqwlz24g7roihou/10y-3m%25282%2529.PNG/file
TLT (mthly) - current
ReplyDeletehttps://www.mediafire.com/view/zqrovnv3zh2t68x/Tltthoughts.PNG/file
Transports very weak today, sometimes a leading indicator
ReplyDeleteHSY (dly) Back to back -
ReplyDeletehttps://www.mediafire.com/view/na23rt6vu1b0fdj/backtoback.PNG/file
A new post is started for the next day.
ReplyDeleteTJ