Market Indexes: Major U.S. Equity Indexes closed higher; DJUtil lower
SPX Candle: Higher High, Lower Low, Higher Close - Bullish White Soldier
FED Posture: Quantitative Tightening (QT)
The morning started with a new lower low. That was OK, as we said not to start upward counting until the a wave was exceeded higher. Early in the morning, near the new low of 2672 after downwardly filling the gap shown by the black circle - which I warned yesterday could be filled, I stated it could still be the b wave down. Apparently, it was as the market began tacking on 15 and 20 points, upward, at a time.
So that things don't get too confusing, here is the same ole hourly chart first, so you can see that it is still the c wave up of minuet (ii) we are in.
 |
| S&P500 Cash Index - Hourly - Minuet (ii) Up Likely |
Again, the count is based on measurements, and the EWO is now clearly green, rising and headed upward. I have no more to say today, other than if you are interested in how I made the projection in real time in the chart below based on degree labeling, then please read my comments from yesterday beginning at 14:45 EST, or 02:45 pm.
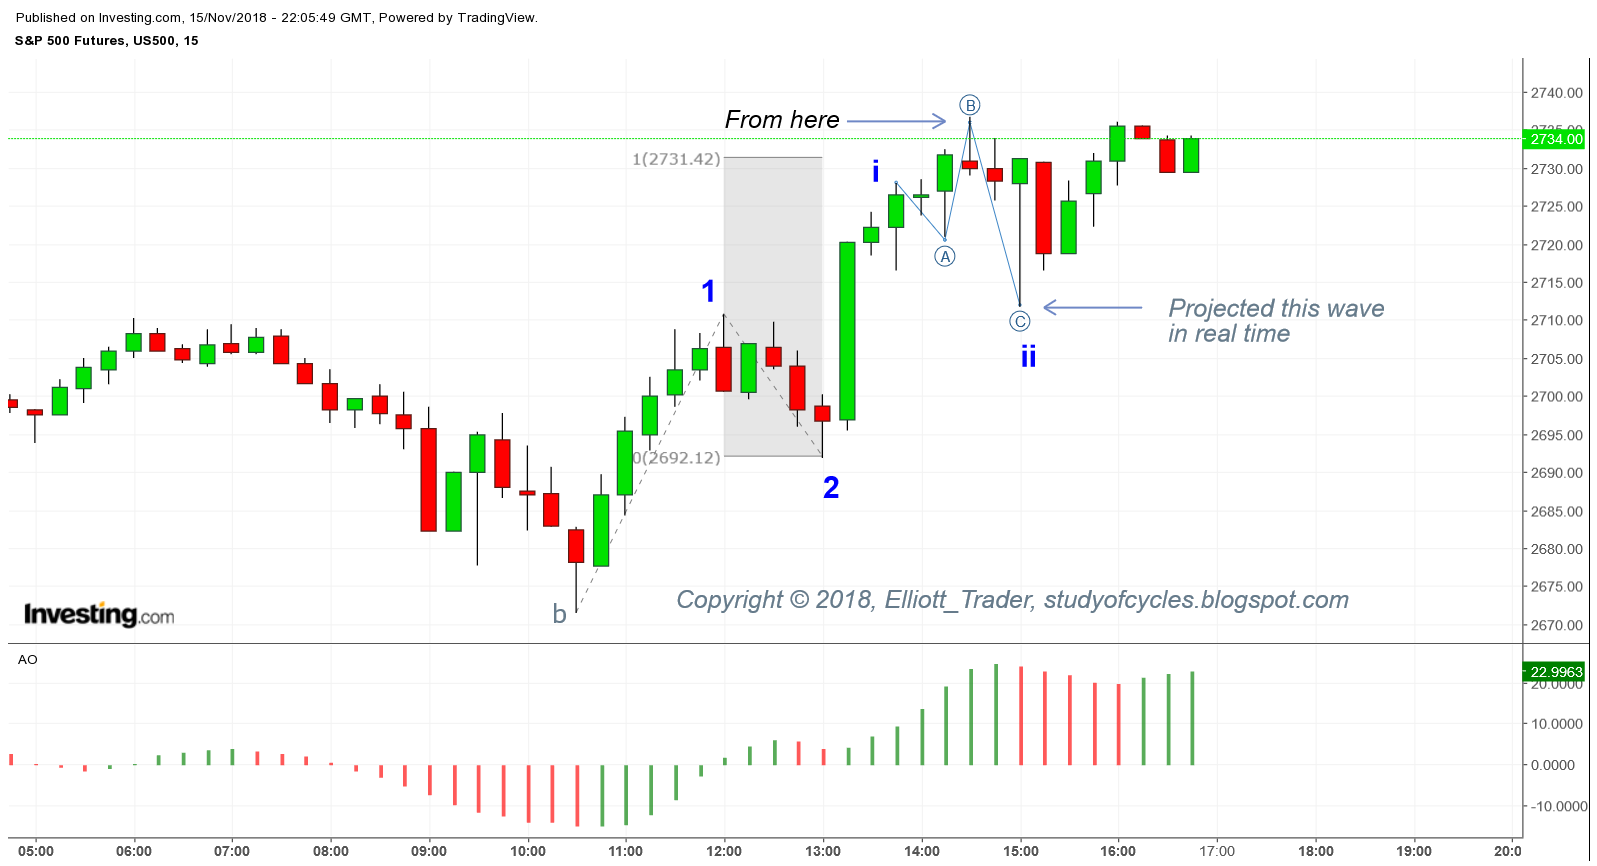 |
| ES E-Mini S&P500 Index Futures - 15-Minutes - Flat Projection |
The bottom line is, as you can see from the Fibonacci ruler, at the location of ((B)), a wave i sub-wave would have become longer in price than wave 1, which is not allowed.
Therefore, it stood to reason that the last waves at the top were part of a FLAT, and, specifically, the ((B)) wave of a flat, and that a strong ((C)) wave down would follow. Which they did - projected ahead of time - although I used cash and not futures for the measurement. From 2,737 the market declined to 2,712; a 25 point decline and it provided a warning to commenters - ahead of time. The down wave came right on schedule. Wave ii had to main 18 points net distance traveled, and it did! I would expect wave 3, up to become a 1.618 extension.
That is the benefit of understanding degree labeling as best as possible. I am still learning about it. I hope you are too.
And I hope it helps.
In subsequent days and weeks as the holiday's approach I am going to be reducing my frequency of commenting during the days and evenings. Again, my only intention is for you is to learn how to use these techniques, not to be performing continual real time analyses. I hope today's intraday chart demonstrates a bit of how to go about it.
Have a good evening.
TraderJoe
P.S. ES futures count of a diagonal (with overlap at the wave ((2)) low is posted below. Such a diagonal could be finished or it may go to 2,753 MAX.
 |
| ES E-Mini S&P 500 Futures - 15 Minutes - Potential Contracting Diagonal |
Awesome ET, yes I am learning ! :). Between the bar which is marked as i (13.45) retraced below its previous bar (13.30) and that retracement is greater than retrace from the top of i to ((A)) (14.15). Why is bar at 13.30 not i ?
ReplyDeleteCould be. As I said, I did the original analysis on cash.
DeleteET, Did not get your comment "As I said, I did the original analysis on cash.". Am referring to same chart you have posted on 15 mins timeframe.
DeleteYes. See my comments from yesterday. I'm not going through it again. The details are in yesterday's comments from me beginning 02:45 pm.
DeleteCool, will do thanks for clarifying.
DeleteThank you so much for the degree analysis, Joe. Great real-time commentary, too. I'll do my measurements from the helpful hints you provided. I bet they work out pretty closely (as long as SPX cooperates - lol).
ReplyDeleteHope so.
Deletethe highest c in this flat can travel has been moved down given the new depth of the b. it is now 2770.92. (2815.15 - 2714.98) + 2670.75 = 2770.92 so filling the gap is not completely out of the question if we are continue to follow current structure.
ReplyDeleteshould read is "now" completely out of question.
DeleteDitto
DeleteGoing to spend holidays figuring out how (i) bottom was 2714.98
Joe -
ReplyDeleteThis means the talk of the holidays will be a wave 3 down? That iii of 3/C is going to feel like a crash!
It's Jerome Powell and the Federal Reserve that have promised to raise interst rates in December. Not me.
DeleteMasterful Guru Joe, the uncanny market giveth and the market taketh brilliantly deciphered - in real time - as it happens. Not even a Copperfield would begin to understand how this all knowing market place's combined actions of thousands of participants could collective produce RNElliott wave counts in mins- hours - days- weeks - months etc . GJ there must be a higher order orchestrating the activity to manufacture these waves. How could you explain it otherwise . These revelations given to 1 solitary personage among al 2.6 billion approx inhabitants. All is in the cards. Even as mind boggobling to enable 1 among 100+ market participants to reveal these
ReplyDeleteConvolutions in reality TV, This genius is to be honoured.
Salutations Guru Joe Make EW Great Again = MEGA ! Where's my cap to be lifted to you as you pass us by.
Well. Things in nature can only grow according to certainn patterns. Man and his or her finances are just a part of nature. If they are not, then what are they a part of? The only task is to diligently uncover the rules of that pattern.
DeleteWhile I do not think it is a formal rule, I have heard quite a few EW analysts opine that in a potential expanded flat,once the b wave exceeds the a wave by more than 2X it should be discarded. That seems to be the case in the second wave charted above. The C wave is also looking like it will be considerably larger than the A wave.
ReplyDeleteYup. Let's discard every wave that people buy, and that goes lower. And let's discsrd every price sold that people get trapped in higher. The only implication of a 2.618 'b' wave is that the 'c' wave is 'prone' to fail. Not required, but prone to.
DeleteET, Thank you for teaching applying Elliott Wave! I found another good book I'll share. "Mastering Elliott Wave Principle: Elementary Concepts, Wave Patterns, and Practice Exercises" By Constance Brown
ReplyDeleteCounting waves is work, looking for something an oscillator or volume etc for a clue.
So the balance line should be support 2762. Or another way to think of it. If the train station is the 13 34 ema and the slope is it's steam. Wait for the train to return to the station before getting on. Fractals works as stops.
I like it!
DeleteSymmetry:
ReplyDeleteMinute((ii)) up retraced 61.8% of Minute ((i))
If I'm interpreting your chart right the 1.618 extension would put 3 of c around 2753. So a 4 down and 5 up could easily get to 2765 which is a 61.8% retrace of minuet(i) by minuet(ii). Wouldn't that be great symmetry?
Sure would.
DeleteThank you Joe, I especially appreciated showing the measurement and the following logic. I had not seen that at all.
ReplyDeleteMay you have a wonderful time of celebration with family and friends! I will miss your more frequent post, but will rejoice with you.
Thanks. May your eyes see only the most peaceful and worthwhile of sights.
DeleteJoe, on the 11th you did a post on the contracting diagonal and expanding diagonal I was wondering if you could put something together for the expanding triangle and barrier triangle. Perhaps, you can find them in the chart of the SPY or IWM where they were valid patterns and hold up to date. There some on the interweb who, from what I understand, do not even now the expanding triangle is a valid Elliott pattern. It would help me to see both.
ReplyDeleteThe best count from 2814 to 2671 is a double zigzag, with perfect trendline and almost equal size to the tee. Your count will be proven wrong tomorrow when the extended fifth surpass 2780--as indicated in your bull nest count, the realistic end point of this structure would be way over 2800+; and it would come real fast.
ReplyDeleteWhat are the terminal points of your dzz?
DeleteI’m looking at (W) = 2719, (X) = 2747, (Y) = 2670. The (Y) is messy, but with the help of a running flat in (a) and triangle in (c) for the fourth waves it is possible to count (Y) as zz? Would explain the deep ewo?
DeleteJoe, you mention the aspect that i to ii must be less in points traveled than 1 to 2. would this also apply to the aspect of time? i believe you are going to say, it does, but i ask regardless. We do see in the 5 min chart of spx that 1 to 2 is 13 bars while i to ii is 12 bars.
ReplyDeleteYes. Time too.
DeleteThanks Joe, I ask your support because I probably missed out something about the degree analysis commented yesterday and when you say "a wave i sub-wave would have become longer in price than wave 1":
ReplyDelete1 - so could that wave be a "3" instead ?
2 - the following 4th wave should then respect the alternation rule. Is it correct to count a contracting triangle after "3" (see 5 mins chart) ?
1 - yes, but shorter than 1
Delete2 - don't think so (yet); not enough wave, already have a flat/
Joe, how do you reflect the sentiment for the current scenario? Just checked the market-harmonics NDSI chart and that one looks quite pessimistic.
ReplyDeletehttp://www.market-harmonics.com/free-charts/sentiment/nasdaq_sentiment.htm
I don't understand the question. The 'current scenario' might mean one thing to me and one thing to you.
DeleteJoe,
ReplyDeletePlease tell me the best textbook to read for EWT reference. I've gone back and read your early posts, including the interesting and humorous "Snake Oil or Not?".
Is the best textbook that encapsulates your method "Elliott Wave Principle" by Frost & Prechter? Does that book refer to and/or use the EWO, or is there a supplemental/alternative text that contains explanation of the EWO and the excellent Eight-Fold Path Method?
Unfortunately, expense is a concern, so if there is one "best" textbook that includes all of the above, it would be helpful. Thank you very much!
I hope to be able to answer this question more fully in a few weeks.
DeleteThank you, Joe.
DeleteThis comment has been removed by the author.
DeleteET, is your coming out in few weeks ? I remember you were very close.
DeleteGood morning Joe, the overlaps of the sp futures at night invalidates the counts in sp cash ?
ReplyDeleteFutures invalidates futures. Cash invalidates cash.
DeleteThank you !
DeleteImpressive the use of time degree from yesterday until this morning. Each correction shorter than prior. Really nice.
For measurement reasons, and nothing else, 5-min cash stepped slightly outside the 0-2 initial trend line. That suggests we have seen a wave four as the FLAT. It does provide good alternation. Any higher high, or failure high, is likely 5. The EWO did go below the zero line. The shorter wave may have been 3, which limits how high 5 can go.
ReplyDeleteOpening gap closed ...
DeleteThere's a new high for the up move. As far as I can tell, up move limited as a wave 5 to 2,748.13; doesn't have to get there. That would be a maximum.
DeleteEWO is green, rising and above zero, but currently on a divergence. Looks like a fifth wave signature, so far.
DeleteOne note of caution because I may not be monitoring all day is if the wave sequence gets ugly and start overlapping - now that we have had the new high, and not before - one might also watch for a potential ending contracting diagonal fifth wave. It may or may not leave prices at the high of the session.
DeleteSince wave 4 looks like a complex flat - based on the EWO - and not a triangle, then a diagonal could likely occur.
In no case in a contracting ending diagonal 5th wave, could prices go below the low of this morning (in the cash market). This may be the reason that futures overlapped last night - futures may make the whole wave a contracting diagonal c wave up.
DeleteFor degree reasons, wave (ii) of a diagonal may not be longer in price or time, than wave 2, right?
Deleteand now it is longer, so, diagonal invalidated
DeleteMatteo .. I don't know what measuring tools you are using, but I have 65 minutes possible. We are only at 45 minutes.
DeleteThis comment has been removed by the author.
Delete..but it is getting ugly with all this morning's important upward waves being overlapped.
DeleteNo, I have wave 2 at 17.8, and wave (ii) at 13.2 Wave 2 was at 13:00 yesterday. Wave 1 was at 12:00 - 12:05 pm yesterday.
DeleteSorry Joe, actually I was looking at an S&P500 CFD where wave ii is longer than 2
DeleteNo problem .. Matteo ..
DeleteOnly way to continue to make new highs, is if 1,2,3 is a-b-c of (i); and this morning is (ii) down; the higher high is (iii), up. And this might agree with futures. Otherwise goose is getting very cooked.
DeleteFor this latter count, cash can not go below 2,714.80 by measurement.
DeleteNow by measurement, that could only be wave (iii) of such a diagonal; too long for (v)
DeletePotential wave (iii) still 'shorter in time' than potential wave (i). Let's see if potential wave (iv) can remain shorter in time than potential wave (ii).
DeleteMissed crossing over that a wave up, of Nov 14th, on the 15-min chart by 0.05...
Delete..required downward overlap on wave (i) of a potential diagonal just occurred.
Deletejust signed in to say you are amazing !
DeleteThanks korhan ..
DeleteBy measurement, wave (iv) of a potential diagonal may not go below 2,723.66; otherwise there is 'some' smaller probability the up wave ended as a barrier triangle in cash, and a thrust out of it. But, let's give wave (iv) a chance.
Deletehope this plays out and you can do a post on it :)
DeleteWave (iv) violated to the downside. Possibly ended as Expanding Diagonal. Checking measurements now. So far, looks good!
DeleteMeasurements for an expanding diagonal 5th wave of an impulse look good. There is a possibility of one more leg up, but it does NOT have to occur or could occur in the futures after hours, and not in the cash.
DeleteES futures look like they COULD BE DONE with a contracting diagonal.
DeleteThanks Tim.
ReplyDeleteI have added a Post Script (P.S.) chart, today only, to show how the futures may have finished as a diagonal. There 'could be' one more wave up, time will tell.
ReplyDeleteI know that diagonal is correct but it isn't winning any beauty contests. LOL
DeleteWhat the others think about year end's close of the S&P 500:
ReplyDelete2500 - SocGen
2750 - Morgan Stanley
2800 - BofA/Merrill Lynch
2850 - Deutsche Bank, Goldman Sachs
2855 - Jefferies
2875 - Credit Suisse
2900 - UBS
2950 - BMO
3000 - Oppenheimer, J.P. Morgan
Great stuff! And very interesting way to learn by following. So is the stock market toast now?
ReplyDeleteHappy Thanksgiving!
stuffed turkey, maybe?
DeleteIf you squint and try hard, the SPX 4hr chart since the Oct 10th looks like a turkey.
ReplyDeleteWhat an ugly structure. Kudos to your ability to derive a count out of it.
Thx.
DeleteLooks like 5 may truncate if it doesn't get moving quickly. Can already count 3 up.
ReplyDeleteOr, in cash, i down to 13:30 EST, as a diagonal, and ii up as a deep retrace? Still speculation as of this time...
DeleteWish I had the you know whats to short this pop when it finishes but do not want to hold over the weekend.
ReplyDeleteES currently at 2,740, below 2,721 and the up trend loses a big battle, as best as I can tell.
ReplyDeleteThanks, good to know. Perhaps Monday if not today.
Deletetoday looks like an expanding diagonal that just completed at 2743.68
ReplyDelete