Daily ES prices continued to close above the 18-day SMA. Therefore, according to what Ira teaches in his public videos, the price bias remains up. The daily slow stochastic is still embedded. Therefore, the so-called Smart Money may still try for the upper daily Bollinger Band. They didn't do it today. They might have but it didn't happen. So, let's go down to the Intraday Wave-Counting-Screen, which mirrors on the 30-minute timeframe the same guidance as for the daily chart.
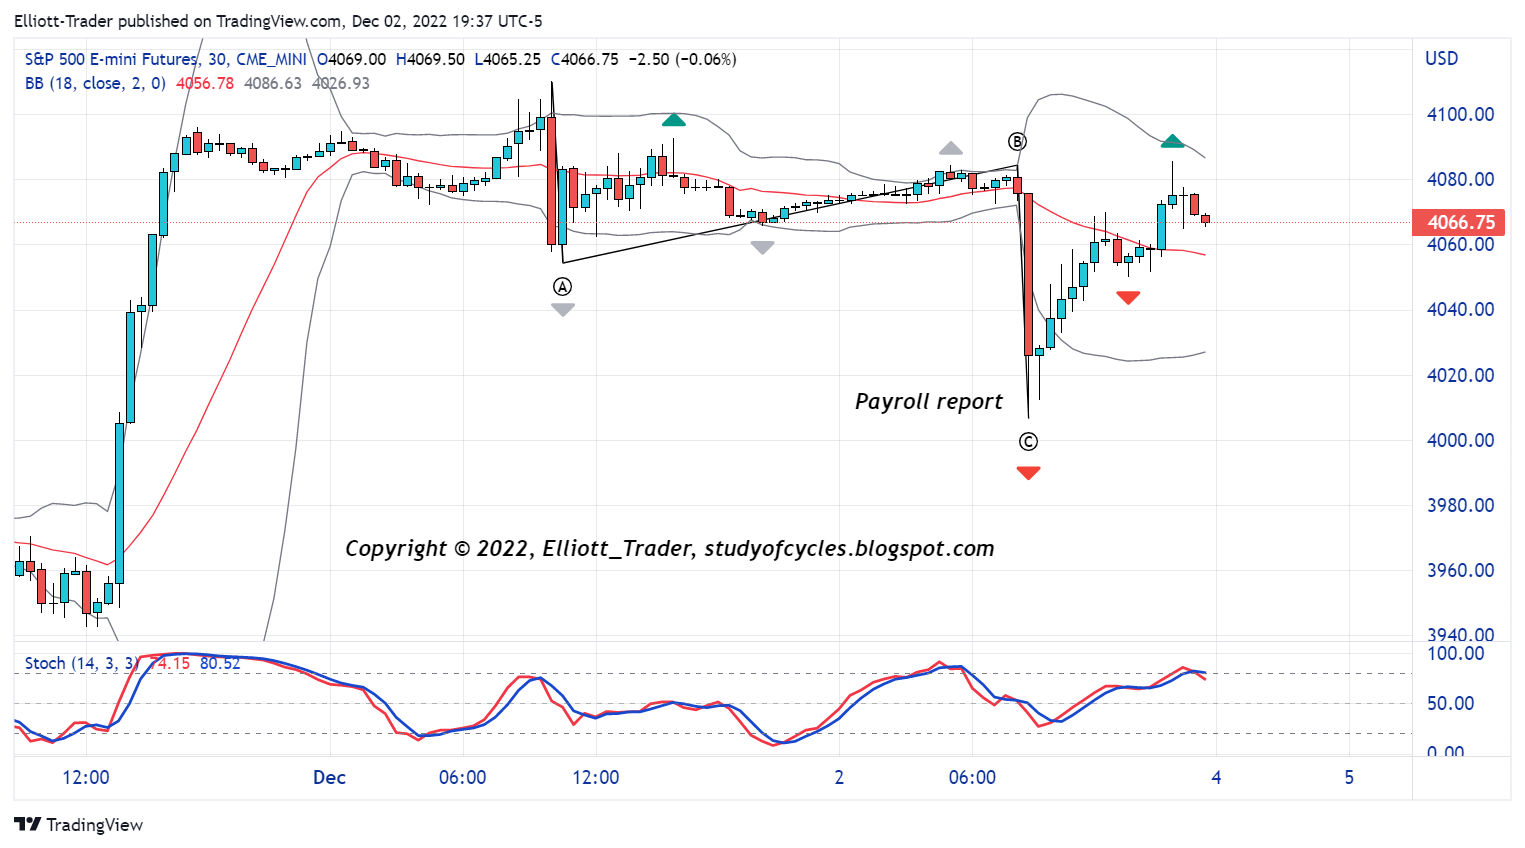
Here you can see the spike down in the futures which accompanied the Payroll report. Following this wave which was only about 1.27 x as long as the first wave down, there was not a fourth and a fifth wave down. The payroll candle took out the two previous down (grey triangle) fractals.
When prices turned and hacked & hacked higher, they initially created an upward wave which is followed by a down (red) fractal. However, price ended over the 18-period SMA, and so even the intraday chart ended with a positive price bias. The intraday slow stochastic is over-bought and not embedded at this time.
In the futures - besides the top being its own up (green) fractal - there are two other up (green) fractals that have not yet been broken.
We have tentatively labeled the down move as an ((A))-((B))-((C)) down. That's all there is. A fourth wave higher that did not overlap did not form, as neither did a fifth wave lower.
At this point, if one were to draw Ira's swing-line on the intraday chart, it would be indecisive because there is a lower low and a higher high at the end of the day. Because of this indecision, one of the best strategies is to Let The Market Decide at the moment which way it wants to go.
Yes, we can make arguments that we may have started a diagonal downward, as in ((A))-((B))-((C)) of a wave i, downward, and that the afternoon high is a wave ii, upward. But the upward wave may be completed, or it may not be. The jury is still out.
And, just like we can make an argument for a downward diagonal, we can make a good case for a triangle pattern, too, that might lead to higher highs.
So, watching those fractals for a bit might be an excellent strategy. If the first down (red) fractal back is broken it is only of minor significance because until the morning low is broken, a FLAT wave could also occur - still making new highs eventually.
Fractals are the location where the markets make decisions. You can try to out-guess them if you want. That is up to you. But remember where the daily bias is pointed. And if you chose to fight it, then at least recognize clearly you are fighting that bias, and it is you that decided to.
Otherwise, although today is known as a "hanging man" candle day, there is no confirmation of that candle until a new daily low is made. Isn't it interesting how that fractal at ((C)) and the confirmation of the hanging man would likely be at the same place??!!
Also, keep in mind that if a diagonal downward takes place, it could have two forms: either a contracting diagonal or an expanding one. And, typically, if the third wave lower is in the contracting form, then it would be shorter in time, while if the third wave lower is in the expanding form it would be longer in time - another excruciating drip-drip-drop.
But, further, looking at daily seasonals, since Tuesday is often (not always) a turn-around day, then if there is a triangle into Monday, the prices could pop on Tuesday to then make a better full-reversal bar. Nothing like that exists on the daily chart yet.
So, be cautious, be careful, be patient, keep your wits about you. The volatility is difficult to deal with, and the wave count is only of secondary usefulness right now to outline some of the shorter-term risks. Hopefully, some clarity will be provided soon.
And remember, Ira does not recommend outright short positions until below the 18-day SMA. This is in order to get the wind at your back if at all possible.
Have a good start to your evening and your weekend.
TraderJoe
Definitely felt like a C today in the morning, thanks for the chart and have a great weekend !
ReplyDeleteMr. Market has accomplished what he does so efficiently during bear markets, namely, dispirited and shaken out all the bearish traders, and enticed back in all the bullish ones. Nothing new, under the Sun...
ReplyDeleteGold
ReplyDeletehttps://imgur.com/JJOaBM5
Thanks TJ. Fyi: Hongkong market is almost 15 % up in last 5 days and none other asian markets alligned.
ReplyDeletei was going to ask about this - bullish engulfing candle on monthly chart and hidden bullish monthly divergence on the RSI. Was that just a very large ABC completing? M Burry tweeted last night he "liked Hong Kong". Getting close to 200ma on daily so watching closely HSI.
DeleteSPY 1-hr: has a lower low than i; here is a countable view in SPY (not in ES).
ReplyDeletehttps://www.tradingview.com/x/hrykcb4Z/
TJ
ISM - Services went 'up' to 56.4 from 54.4 - further complicating the FED's task.
DeleteTJ
SPY 5-min: what 'looks like' a clean impulse down suggests that a 'wave-counting-stop' be placed above wave (2), meaning a down count likely has to be reassessed beyond that point.
ReplyDeletehttps://www.tradingview.com/x/vHKDbu5V/
TJ
SPY 5-min: there is now 'at least' a leading diagonal upward which may be part of a corrective wave.
Deletehttps://www.tradingview.com/x/vqxzU77p/
TJ
SPY 5-min: break of diagonal trend line indicates 'b' down or 'ii' down likely started. Watch the low.
Deletehttps://www.tradingview.com/x/JvvKGPlq/
TJ
SPY 5-min: the low was exceeded marginally lower. Watch to see if a fifth wave forms downward. Could be a 'long in time fourth wave' with the diagonal as the end of 'c' of four. Could also be a 'flat'.
Deletehttps://www.tradingview.com/x/Wu1FKNj9/
TJ
At gold around 1781 is c=1.618xa and .618 retrace on the wave from 1758.
ReplyDeleteThis would also end up on the trendline from 1618.3
DeleteSPY 5-min: breaking the lows again. TJ.
ReplyDeleteSPY 5-min: some things to watch for. See chart notes.
ReplyDeletehttps://www.tradingview.com/x/zBaNf5yf/
TJ
SPY 5-min: now there is upward overlap. Flats are a little more common than diagonals. But this is sort of no-man's land. Good luck.
Deletehttps://www.tradingview.com/x/dwDPUN0C/
TJ
SPY 5-min: there is a valid lower low, so a diagonal has been validated, but a 'flat' is still possible.
Deletehttps://www.tradingview.com/x/fAVyD3yI/
TJ
ES Hourly - there are some notes on the hourly chart for you to view.
ReplyDeletehttps://www.tradingview.com/x/rhVSwDiy/
TJ
ES has hit the lower channel.
DeleteA new post is started for the next day.
ReplyDeleteTJ