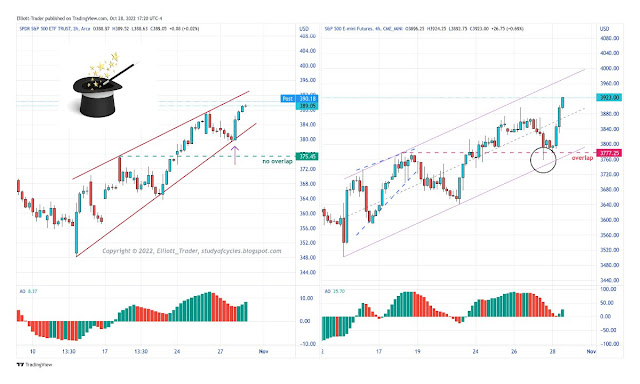
Most of us typical people can be literally amazed by a good sleight of hand or more elaborate magic trick until we know how it is done. Then, we just say, "oh!". If you followed the comments in the prior post, you know that when we went to bed, AMZN had given guidance lower which dropped the ES futures -60 to -80 points, depending on where you are measuring from. The spike down in shown circled in the diagram on the right.
It is also shown overlapping a prior wave. But Presto-Chango! Open the cash market (diagram on the left at the arrow) and By-Jingo the offending little overlap magically disappears! Not even a point of the AMZN news appears in the cash market. Astonishing.
Is the result such that some Elliott wave analysts will count the diagram on the right as five-waves-up? It might be.
How do such things happen? What is the secret behind the trick? Well, on Wall $treet, talk is the cheapest thing there is. Action is what really matters. And all you did was have one of the Corporate CEO's under-promise so he can over-deliver. It is one of the oldest tricks in the book. And it does get tiring. Meanwhile, the Smart Money AI (Artificial Intelligence) algo's just read who is short in the light overnight volume, and by how much, and then execute a program to inflict max pain. It happens all the time. It's a reason why I seldom, if ever, take overnight positions home with me, or trade through news reports.
From an Elliott Wave perspective cash-only wave counters might indeed view the diagram on the left as 'five-up'. Is it wrong? There is no definitive ruling, although it does not seem correct from a degree perspective as I have noted earlier. Those who also respect the futures prices might just say, "well, the parallel up trend is still in force until it isn't." Such a count can be (w)-(x)-(y) or it might have more legs yet. It is very difficult to say. The only counts that look like they have invalidated for the minute ((b)) wave are the Flat, and the triangle. It looks like if this wave is corrective, it would be a double zigzag (most likely) or a triple. As I said before, "B" waves are notoriously difficult. If this is still a "B" wave, then it is a case-in-point.
Have an excellent start to the evening and to the weekend.
TraderJoe

https://linksharing.samsungcloud.com/pT1EbrjCnNq8
ReplyDeleteHello Tj,
I have tried to replicate the monthly counts on Dow.
Is this accurate ?
Please view.
My count remains the same as it has been per the prior link, below.
Deletehttps://studyofcycles.blogspot.com/2022/10/legal-reminder.html
Has the minute ((b)) wave, circle-b, up ended? Best to wait for some downside confirmations like the break of hourly & 4 Hrly channels, followed by a back-test that fails.
TJ
Once we break hourly n 4 hourly
DeleteDoes it confirm ((b)) done.
Or Fall after back testing is the confirmation?
In this case, 1) break 4-hr lower, 2) back-test 4-hr, and 3) fail below back-test and likely overlap 3,720 - the first up wave. TJ.
DeleteThanks again for the update TJ, as always your posts are informative and entertaining to boot.
ReplyDelete..welcome. TJ.
DeleteSPY 15-min: testing for triangles; a smaller one (shown) is already potentially valid.
ReplyDeletehttps://www.tradingview.com/x/PA2iIR7f/
Larger triangles can easily also occur.
TJ
..now up over prior ((D)) wave. TJ.
DeleteA new post is started for the next day.
ReplyDeleteTJ