The first scenario is 'as counted' and is the most optimistic as it implies a SuperCycle Wave [IV] yet to form that could be either primarily sideways, or make a new high, after a significant (62% - 78%) downward correction.
 |
| S&P500 - 1 Month Closes - As Counted |
It assumes that SuperCycle [III] has already been made, as have the first Primary ((A)) wave down as shown above. This scenario has going for it that 1) all wave degrees have been accounted for and there are no degree violations that I can detect, and 2) while the PPO for the Primary ((B))-3 wave looks out-of-line with recent waves, it still currently diverges with the PPO from the year 2000 top. (Note: the PPO is often used in place of the MACD when log scale charts are used over a multi-year time frame.)
The second scenario is much more pessimistic.
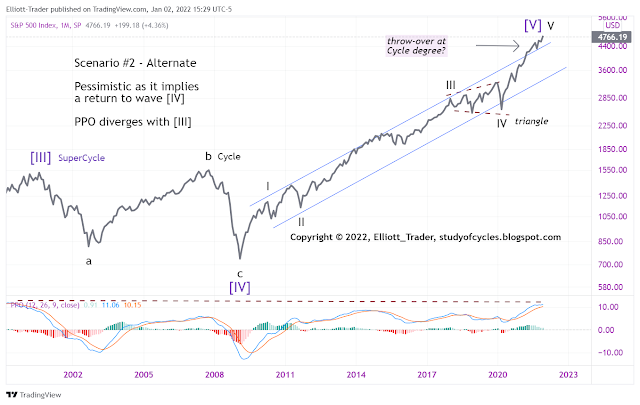 |
| S&P500 - 1 Month Closes - Alternate |
This scenario assumes the whippy movements from 2018 to 2020 were part of an expanding triangle which should indicate 'last wave directly ahead'. Some difficulties with this scenario are that 1) Neely indicates he has never seen an expanding triangle in a fourth wave position, 2) there has been no five-wave movement down from the high yet to prove even a Primary wave, downward, let alone a Cycle wave downward, 3) there 'may not' be alternation in waves II and IV as they both have higher internal waves, although wave IV's triangle did not fail to make a lower low as wave II's wave did, 4) it is very hard to distinguish on this scale where the Primary waves would be within the Cycle waves up to SuperCycle V, and Fibonacci 5) there are degree-labeling problems both within the Cycle c wave down to SuperCycle [IV], and within the Cycle III wave up within SuperCycle [V].
In favor of the second count, this SuperCycle [V] up wave could have divergence with the PPO from the SuperCycle Wave [III] if it formally curls over. And there could be a throw-over of a Cycle degree trend channel.
Finally, a reminder that Monday is the first trading day of a new month and a new quarter which often, not always, sees inflows from pension funds, 401k's, company bonus plans, dividend reinvestment plans, etc.
Have an excellent rest of the weekend.
TraderJoe
A possible issue with the Primary exp. flat location of ((C)) as shown above -
ReplyDelete(click to sharpen)
https://www.mediafire.com/view/y6plcyuwsz68fln/Wheres_%2528%2528C%2529%2529.PNG/file
I can only say if you check the last (A), (B), (C) wave in the ES, the (B) wave exceeds 1.618, also. Yet, the (C) wave made a lower low. This is in contrast to the dogmatism of the measurements. Try to remember the FED is literally 'stretching' the measurement ruler (the dollar) by printing money. $1 today is 'not' the same as it was two years ago because of the additional debt creation.
DeleteTJ
Happy New years TJ.
DeleteIn reference to your above chart, There is a "what if" scenario and i.e
Within you Super Cycle III, if internal degrees were lowered- Then we could only be Cycle 3 of your SC3.
Thanks TJ,
ReplyDeleteHappy new year.
Amazing analysis for someone looking long-term.
I tend to favor Scenario 1.
Don't know how much is the throw over though.
Thanks Manu. Stay tuned.
DeleteTJ
Hi ET ... could you please elaborate on the meaning of the bold a-3 and b-3 in your primary? I assume they are legs of [IV] that in all will span decades, but the "-3" portions have me puzzled. Thanks and Happy New Year!
ReplyDeleteFlat waves (3-3-5) and triangles (3-3-3-3-3) start with 'three-wave sequences'. Thus, ((A))-3 means an A wave in three waves, as opposed to an A wave in five waves. Thus, for the present ((B))-3 is also a three-wave sequences.
DeleteIf you are not familiar with flats or triangles, you really need to read, "The Elliott Wave Principle" by Frost & Prechter. If you have not read at least this book there is little else I can help you with.
Regards,
TJ
Why no use of ewo and 8 fold path? Shouldn't they be used? Thanks
ReplyDeleteBy definition, Bill Williams designed the EWO using linear arithmetic i.e. simple moving averages only, not exponential). As a result, the EWO is not as relevant on long term log charts. So, the EWO is not used. In log charts, exponential MA's would work best. The PPO is a 'percent' price oscillator and deals with this problem better.
DeleteTJ
Just an FYI, market is open normal hours Monday. Per NYSE rules, there will be no New Year’s Day holiday for US markets.
ReplyDeleteThanks. I corrected the text above.
DeleteTJ
Thanks for the great analysis as always Joe. Crazy how long in the tooth everything is. Happy New Year
ReplyDeleteHello all. Here's what there is, so far, in the SPY 30-min.
ReplyDeletehttps://www.tradingview.com/x/lVZYOGHp/
TJ
At today's cash close, this is SPY 30-min.
ReplyDeletehttps://www.tradingview.com/x/58jsfhat/
The 'first-of-the-month money' made itself seen. As of the cash close there are only three-wave sequences. Watch in the overnight for higher or lower waves, especially any exceeding the prior all time high.
TJ
SPX - stocks above the 20 dma were at 90% last week now 79% today.
DeleteNYAD not confirming new high. Something is brewing and it don’t smell like coffee.
SPX - we still have open gap area close to 20 dma around 4700
DeleteSPX 30-min: cash gap filled.
ReplyDeleteTJ
Gap 'n crap, and dly pivot reached.
ReplyDeleteI assume an a wave can be a diagonal since it can be 3 or 5 waves. Is that correct?
ReplyDeleteSPY 30m - current
ReplyDeletehttps://www.mediafire.com/view/57rdk9gypm2hnrd/spy30m.PNG/file
SPY 30m - this week's wkly pivot sits less than a 1/4 pt below yesterday's daily pivot.
ReplyDeleteBoth have been hit.
SPX (mthly) - January range (click to sharpen)
ReplyDeletehttps://www.mediafire.com/view/qznrecf97k35cft/JanuaryRange.PNG/file
There is a new post started for the next day.
ReplyDeleteTJ
Joe, I always enjoy your education. However has there ever been in the history of the market where a corrective pattern(ABC) resulted in the market doubling before a Primary wave C corrected it back down so the market essentially went nowhere from a bull market top. I’m using your 1st chart bases on your presumed illustration of what might happen. Thanks Sam
ReplyDeleteHas there ever been a time in history when the FED has kept interest rates artificially so low for so long? Has there ever been a time in history when corporations have bought back so much of their own stock?
DeleteTJ