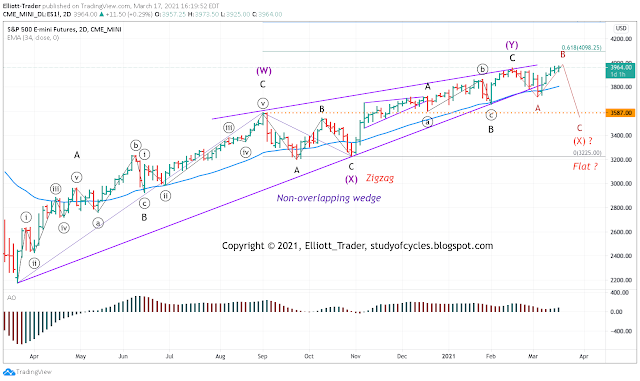
A lot of hot air went into FED Chair Powell saying, essentially, "the economy will likely rebound from pandemic conditions, and we're not changing rates while it does." Simple enough. Stocks made another marginal new high on the move. So, yesterday's price chart remains the current count.
 |
| ES Futures - 2-Day - Still in the Wedge |
So, now we'd had the fact of a third stimulus stimulus, and the FED's statement and news conference. Let's see (tap..tap..tap..). What else is on the horizon? Well, there's the possibility of an infrastructure bill, but that is probably down the road a bit. It's not that prices can lift off on their own, I'm just looking for possible announcements to keep in mind.
Meanwhile, in the comments we were only able to count "three-waves-down" on the smaller ES 15-minute time frame. We posted that, and even posted that most likely the one-minute diagonal we counted yesterday was 'most often an A wave'. It was. Then, on the ES 4-hr chart, this possible count to a Minor B wave was suggested.
 |
| ES Futures - 4 Hr - Possible Minor B Wave? |
Again, because this count involves a possible diagonal - just for the minute ((c)) wave - then it must form properly in every detail. Such a chart would look better if there is some digestion of today's gain, and then the length of a fifth wave v would have to remain shorter than wave iii.
Well, we'll see how it goes. Have a good start to the evening.
TraderJoe
Im sticking with medium top very close..perhaps 4k...see if they can take out that Neg D on the 60ty tom..I think we all know T supply will be increasing by the week..at some point has to take its toll...last I heard 600b a year in interest being paid at current rates. Joe as always thanks much for all your input. Gl all
ReplyDeleteThks TJ !
ReplyDeleteCurrent NQ 4hr. -
https://funkyimg.com/i/3bAe6.png
As long as NQ holds 12600 area, we have a double bottom or inverted H & S set up.
DeleteI think any idea about a barrier triangle can now be eliminated with closes above top line.
ReplyDeleteThanks for all the work TJ.
Been hard to count but in the larger picture it should be.
A late look at the YM (hrly) -
ReplyDeletehttps://funkyimg.com/i/3bAgy.png
Early look at the 4hr -
ReplyDeletehttps://funkyimg.com/i/3bAkY.png
https://schrts.co/rbpIfRSh
DeleteI want to see TL. from 3233 to 3723 hold on pullbacks.
We might be forming a CUP & HANDLE from feb. high.
DeleteBonds to 130 area? Would you mind taking a look at the bond count sometime? Many thanks. https://invst.ly/u6vvt
ReplyDeleteSee the chart on Sun 21 Mar 2021, now posted.
DeleteGood morning all. Here is the ES 30-min intraday wave-counting-screen, with updated daily pivots (classic calculation) and nearby fractals. One question would be if prices make a full daily reversal bar today.
ReplyDeletehttps://www.tradingview.com/x/U4mJtF1I/
TJ
ending of C looks perfect so far - thank you
ReplyDeleteIf B done SPX 3900 will fall quickly. They seem to think throwing a few hundred billion at the 30 stocks in the DOW can stave off bearish sentiment...never mind NDX, lol!
ReplyDeleteSPX cash 5min -
ReplyDeletehttps://funkyimg.com/i/3bArX.png
How long will it take the fed to announce they will be buying long dated treasuries? Lol, not long I suspect.
ReplyDeleteQ’s - if 311 doesn’t hold then a measured move takes you to 283 area.
Update for NQ 4hr -
ReplyDeletehttps://funkyimg.com/i/3bAu3.png
SPX cash 5min update -
ReplyDeletehttps://funkyimg.com/i/3bAvo.png
Rejected at 60 level, evening star reversal.
DeleteES futures and SPX cash now down thru the morning lows.
ReplyDeleteTJ
ES futures ..daily .. outside day, so far.
DeleteSPX cash beats low of "FED Day".
DeleteES 4-hr: length of the current down wave at 3,913.50 exceeds length of prior wave (ii) of potential diagonal.
ReplyDeletehttps://www.tradingview.com/x/zh2EXOJo/
TJ
Kick back to "kiss good-bye" underside of diagonal trend- line would be picture perfect!
ReplyDeleteNQ daily (in progress) -
ReplyDeletehttps://funkyimg.com/i/3bAxy.png
They really are amusing; literally foaming at the mouth trying to arrest a five down...
ReplyDeleteET, did you sell all your oil tankers this afternoon? Thank you for posting that oil chart a few weeks ago showing oil at 66.
ReplyDelete