Market Indexes: Major U.S. Equity Indexes closed lower; DJUtil Higher
SPX Candle: Lower High, Lower Low, Lower Close -Trend Candle
FED Posture: Quantitative Tightening (QT)
As if to underscore that the market did not like the Federal Reserve decision yesterday the market, as measured by the S&P500 cash index, opened lower, filled the gap but made a lower high, traded significantly lower, and closed lower although off of the lows.
By the futures settlement, with three days in-a-row of both the %K and the %D lines of the slow stochastic indicator closing below the 20 level, this indicator has now technically "embedded". This means until the red line in the indicator panel of the chart below crosses back above the 20 level, the chances to make a retrace to the 18-day SMA are now quite limited.
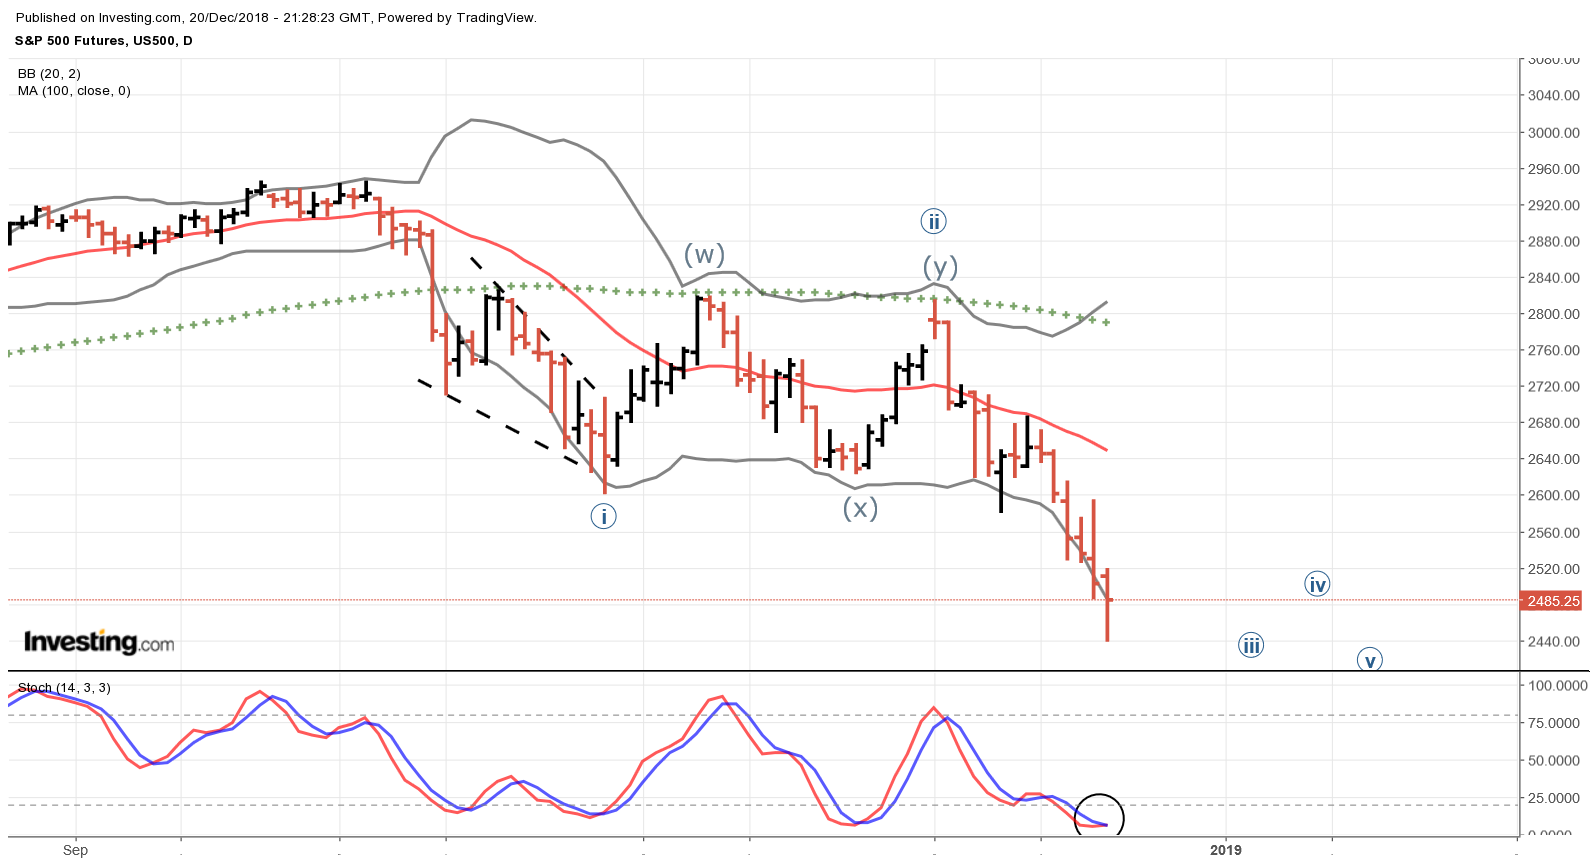 |
| ES E-Mini S&P500 Futures - Daily - Embedded Slow Stochastic |
And after three-days in-a-row of closing outside the lower band, right at the settlement price sneaked inside the lower band. This allows for a reset of the number of consecutive closes. Prices are currently 'riding the band' lower. We asked readers to be on watch for this yesterday.
The embedded slow stochastic is the most powerful indicator of direction on the chart. 1) The trend is down because of lower lows and lower highs, 2) the bias is down as price remains under the 18-day SMA, and 3) the momentum is down as given the embedded reading.
And while there will be "backing-and-filling" just as there was today a backing off of price (from five waves down that we counted lower in real time, and actually caught the low bar), there is currently nothing friendly to the bulls on the chart. One would have to take out the high of yesterday to even neutralize the trend lower.
Since yesterday was the outside range day down, today counts as the first day after it that it's high was not taken out. Tomorrow is, thus, the last opportunity to set that so-called "bear trap".
Have a good start to your evening.
TraderJoe
Thanks Joe. Should I pay any credence to the 2 counts I just posted?
ReplyDeleteRUT https://imgur.com/a/PHiQwoU
SPX https://imgur.com/a/F9wRuZD
Joe, any thoughts?
DeleteDid your count survive the after-hours futures? Is it in reference to any particular momentum oscillator to help clarify the count?
DeleteThe Russell has survived but not the SPX futures
DeletePlease see chart below for reference to momentum oscillator
https://imgur.com/a/WAQROT7
But you have made no reference to it in the count. Therefore, it is only 'numbers and letters on a chart'.
DeleteI'm sorry Joe, I assumed (stupidly) that it would be implied within the count.
DeleteYou will note at the "awesome oscillator" is deepest near wave 3. You will note that it rises up to the zero line at wave 4 and continues to diverge. You will also note that the channeling approach (2-4 and 1-5) gives you a nice channel. The diagonal for a supposed wave c of a expanded flat has been retraced rather quickly and we see continuation of that in RTY. You're feedback is appreciated and thank you for your time.
I was referring to the SPX oscillator which you are not showing.
DeleteMy apologies - here you go
Deletehttps://imgur.com/a/sBDGs5z
Joe, since we are down to whisker hairs away on the lower Bollinger Band I just wanted to confirm that you are using a length setting of 18 as Ira does and not the standard 20.
ReplyDeletejoe. I believe we have complete 123/ABC off the October high - take a look if you want. Or we can wait for violations of current working count if you want to explore. I know you are busy and certainly dont expect anything. It seems to me using different time frames EWO not tracing out impulse for entire period - looks more like series of threes. While we cant rule out current count this would be an option - or a step in right direction - , as would some diagonal. I can see a move back over 2600 or degree violations which disallow current count absent of immediate re-acceleration. Better to prepare than be surprised. Also thanks for everything. https://imgur.com/a/we6Vm53
ReplyDeleteNot for nothing, but what 'exactly' is your chart predictive of? I have shown you my prediction - which is on-track as we speak.
DeleteMarc, Ya had me goin for a minute. However your ((c)) wave of the expanded flat is 3 waves. C waves must be 5 waves unless in a triangle.
DeleteThabks guys... Its not predictive. Im on board with ET and have been right there with you for sone tine now.. .Im looking for an alternative condtional on higher degree up waves.. At that point it becomes predictive.
DeletePT -
Deletei can move labels, add x wave, etc.. and 100% sure there is a measured count that works. the main point is the sizes of the moves make sense in overall scheme as alternative if needed. thanks for spending time to review
Sub-waves of ((C)) flat is bigger than whole of ((A)) = degree violation? Same for WXY
DeleteMarc,
DeleteA couple of things I'd like to mention.
5's and 3's are the same until they aren't and the 3 becomes a 5.
It sounds like you are seeing a visual pattern or prediction and trying to retrofit an alternate count that works. It can't be done like that in a reliable way. The count has to be built from the bottom up, not the top down. Of course there are always alternate counts and counts morph from one thing to another. What is so incredible about Joe is the integrity of his counts. Is he always correct in his forward looking thoughts? Of course not, for the reasons I just mentioned. However he takes great pains to follow the rules from the bottom up and if the count is wrong it's because of human things like not noticing something or mis-interpretation but not because of breaking rules or misapplying them. The integrity of his work is what separates him from the pack of pundits selling things who will break or ignore rules to make the count fit their premise.
I agree 100%.
DeleteThere is a limit to bottoms up - rules may break down as you drill down into smaller periods - what may look like a good count at 15 mins may have waves at 1 minute intervals that violate the rules, or you will find a "5" counted as a "3" which Elliot said can not happen. The work that ET has shared with us applied as "guidelines" has changed the way I use EW for the better. My point is simple: IF in the near future we need a new count then it will come from the family of diagonals and/or similar to what I presented. My point was to demonstrate the Fibonnaci relationships and make sure that we ae aware if need be to go bac and revisit.
and possibly there is no alternate that works because it wont be needed
Deletehonestly speaking....I've been reading the post and chats for months now and I come to a conclusion I am too dumb to understand all these. It's fascinating and it seem to work but I just don't understand the details that goes into it and like you said the intervals 1 min, 5 min, 15 min, 30 min, hourly, daily, weekly, monthly....there seem to be so many different ways to analyze....it confuses me so much. I wish I was as smart as you guys ....which I am not!
DeleteIF the larger degree waves are a,b,c then the down smaller degree ((B)) is larger than a - which is a definite degree violation. No smaller degree sub-wave can be claimed to be larger than the larger degree wave.
DeleteFor those who may be unaware, the concepts Joe is discussing here are from a gentleman named Ira Epstein. He records a free video on financial markets at the end of each day where he discusses exactly what is mentioned above. For those who are interested here is the link.
ReplyDeletehttps://www.youtube.com/results?search_query=ira+epstein+financial+report
PS It usually isn't available until 6 or 7 PM Eastern time.
DeleteThanks TS
Deletejoe, i want to give back to you so here is a treat. Neely suggests you make charts using highs and lows, knowing the proper order of the data, and then plotting them according to different time frames. I have chosen to look at periods less than a week but more than one day. So i could take monday and tuesday as 1 period and rest of week as other period. The program is rather complex, and rather than just include partition of MT vs WRF (days of week) i ran variations of grouping 2 consecutive days. here are the plots, I hope you find them interesting....
ReplyDeletehttps://imgur.com/a/aZqhtxr
here is weekly since ATH
Deleteand bull market 6 month periods
i hope you like
https://imgur.com/a/Zd6LTTu
clearly by the time you count 5 up on 6 month chart there is degree change
Deleteand i believe it reconciles well with your count of wave 1 of bull market. correct?
ReplyDeleteIt is challenging to believe. At this point on my Cash chart, all I have are 1-2s from the early Oct high. From the early Dec 2 wave high, we have
ReplyDelete(1) down at 217 pts into Dec 10
((1)) down at 155 pts into Dec 18
If today was another 5 down, I have that at 144 pts - smaller than ((1)). Either we are still building 1-2's or this W3 is going to be 1>3>5? Seems odd to me but I do not have as much experience as others on this board.
Right on the money Paul!
DeleteThe presumed third wave down has so far failed to exceed distance and momentum of wave one, which means three is likely subdividing, despite deeply oversold conditions. Perma-bulls are about to learn that just as bearish signals are often negated in bull markets, so are bullish ones in bear markets!
You can learn a lot about sub-wave degrees by trying to label a correction or potential correction. Do you see how a,b,c are smaller than A? Then, the smaller degree i, ii is smaller than A, but iii can be allowed to be the length of A.
ReplyDeletehttps://invst.ly/9lan7
Happy Holidays.
Notice that B takes more 'time' than A, too.
DeleteThe longer B is why I did not endorse V's alternate last night.
DeleteMany thanks for this textbook example.
DeleteHappy Holidays to you and the people that follow you. I hope we will continue riding waves next year too.
zigzag on track C=A @2503.01 exceeded
ReplyDelete50% retrace @2513
DeleteC is only 3 waves so far so 2513 is a realistic target
Deletethe initial up move a has been overlapped so it is confirmed that the whole move off of the bottom is corrective and not an impulse.
Delete1 of c has been overlapped which means we are looking for an ED for c. A reminder that c is allowed to fail but is not required to.
DeleteWatch out for B as an expanding/descending triangle with a short e leg.
ReplyDeleteFurther overlap of i, up, could mean that C will be a diagonal, but only if it holds the low.
ReplyDeleteLOL Joe, Typing at the same time. Question: Is a c failure more bearish as regards the post pattern behavior than a conventional completion?
ReplyDeleteyes, but so is a potential diagonal - because a potential diagonal broadcasts its message far and wide.
DeleteHi is there a chance for a reboud at 62% retracement here or it's going down ?
ReplyDeleteLooking at a 1 min chart. I'm seeing that there was a chance that there was a very small 4th wave at the top of c and a 5th wave failure which if so means we are in 3 down.
ReplyDeleteIf 17/12-19/12 was higher degree 2, this (ii) should be 55 pts max but are now 64 pts which mean we might get another running correction to shorten net distance travelled
ReplyDeleteThat's a nice catch Erik
DeleteThe running flat would need to finish below 2096
Deleteb of lat would have to get down to 2447
DeleteSee my comment below.
DeleteOr we are looking at a flat for B
ReplyDeleteMy 'suspicion' is we are going to get a low volume "Christmas Triangle" including moves in the overnight, that will capture the range and we may be in only the (a) wave of it now, with the smaller a, b, c up. Just waiting to see if the c finishes as a diagonal, or not.
ReplyDeleteIf a triangle forms, it would resolve the 'degree conflict' at 2,498 cash.
Deletethank you! Was going to ask about that.
Deletea of A at the high today and now in b of A down with c of A to follow?
DeleteSorry, am a little confused on this.
Yes, I see your point PT.
DeleteJoe, would there be any possibility of seeing an image of this assessment?
Yes, but a moment, DOW just invalidated a diagonal.
DeleteWhat about a triangle from 2518 ES? We would be working on the D.
ReplyDeleteThat's what I just published .. lol.
DeleteLook for 78.6% down ?
ReplyDeletehttps://invst.ly/9lc3o
TJ
Joe, another way to resolve degree conflict is:
ReplyDeletesubmin i down from 2685 (minuette(ii) was an extended wave
submin ii up at 2585
yesterdays low @2441 was a short submin iii
Now in submin iv
possible 4 done and in 5 down.
DeleteAlternation is there with flat ii and sharp iv
'Suspicion' denied.
ReplyDeleteMight be forming flat ?
DeleteOn SPX.
DeleteRUT acting nicely (even if its the wrong count, it's working so far)
DeleteWatching for a flat as Joe mentioned above. Maintaining shorts with a "few stops" above red trendline (keeping it simple) Check link for image
https://imgur.com/a/T6gI3tA
Will have to see if it gives us expanded or running flat, hopefully length of i of C will lets us know whats coming.
DeleteCurrent up wave greater than one in downward move.
DeleteGood point EDT. Thanks
DeletePotential "barrier triangle" left; should not close below (b) before forming (e)
ReplyDeletehttps://invst.ly/9lcwh; this is light volume algo stuff - so caution, caution.
TJ
(e) should not end above 2,498 in a triangle.
DeleteThanks for posting Joe. Appreciate it.
DeleteJoe. Is it possible for wave D to be greater than wave B in a barrier triangle?
DeleteDoe this work? - https://imgur.com/a/wWKiR2E
Wave ii can 'never' be a triangle. This would be a wave four triangle.
Deleteyes I am fully aware of that....my question was , Is it possible for wave D to be greater than wave B in a barrier triangle?
DeleteThanks ET.
Deleteslightly, yes.
DeleteFor a properly constructed triangle, wave (e) 'must' close back up over 2,480, basis the futures. It should be limited to 80 - 98.
ReplyDeleteHow ya gonna draw this on the cash?
ReplyDeleteGuess it will be a running flat on the cash?
DeleteThis would be 'acceptable' on cash. Alternate would be an expanding diagonal. Ugly stuff.
Deletehttps://invst.ly/9ldhl
im seeing us finished with 3 down from dec 3 fwiw
ReplyDeletei think wave 5 knew to be shorter than 3 in last wave
Yes, that is what would make this triangle a 4.
DeleteJoe, Is this possible as well?
Deletehttps://imgur.com/a/iTjPmqz
wouldnt we expect this wave 4 to eat up a lot of time as in days
Deletenever mind - just looked at your chart. i have different terminal - so you probably right again
DeleteIf we make a new low we will have an impulse down from morning high. Thay will really muddy the count!
ReplyDeletePT
ReplyDeleteis the move down today a 5 or a 3
My old and tired eyes are seeing 3 down and a sideways move which could be 4.
DeleteThat's why I said a move lower would make 5. Of course this action is so crazy nothing would surprise me. The implications of an impulse leaves us with the previously mentioned degree violation which as I said would really muddy things up.
however could also be counted a 3 down for a-sidways b- then c down which would really be ugly.
DeleteAs per my comment to Joe below, that count avoids the degree violation problem.
DeleteThe DJIA has a lower low, and 'might' be a completed diagonal.
ReplyDeleteJoe, I think my 12:08 comment and you're 1:45 answer to Marc is where we are.
ReplyDeletewe have to check at other time but i may have 1 higher degree completed - im not sure how nested your working count has become
ReplyDeleteNothing nested. Completing minuette (iii) of minute ((iii)) from Minute(ii) high on Dec 3
Deletethanks. i think i have (iii) complete, so only looking for 1 big wave to complete ((iii))
DeleteMinuette (iv) first. I mis-typed minute ((ii)) above. Too damn many parentheses in this system! Perhaps we should use some brakets instead. lol
DeleteHere we go. New low challenging bottom of channel
ReplyDeleteThat could be it folks the end of minuette (iii). If so, Santa's Christmas present for us is a 4th wave conundrum! LOL
DeleteSP500 new low of day; possible diagonal.
ReplyDeleteJoe, when does your so called "possible diagonal" get nullified?
DeleteNot until 2389 SPX.
Delete@ V ..Diagonals and triangle are patterns which 'must' prove themselves in every detail. They are valid - if properly constructed - until they invalidate. That's the way they work. There is nothing I can do about it. I have explained such many times in my posts.
DeleteThe last hour might really get crazy due to index rebalancing taking place today.
ReplyDeleteIF the diagonal ending and (iii) ~ 1.27 x (i); then wave (v) might be the extended wave in the sequence.
ReplyDelete(v) really on a positive divergence from (iii) on the EWO
DeleteSlow stochastic went to 1.59
DeleteHere is the best I can do with the count at the moment
ReplyDeletehttps://invst.ly/9lehc
TJ
Thank you, Joe
DeleteIs the count I've been following.
DeleteYep! Yep! Yep! :-))
DeleteRUT getting smashed - glad i do my own research!
ReplyDeleteWhy .. who told you RUT was going up?
DeleteNo on. Just out performing and far simpler than debating the intricacies of the SPX. Didn't get any response to my latest queries to you. I guess you were busy updating your "flat" and "triangle".
DeleteOk .. V .. I only saw one, and there was no name (symbol) on the chart. I'm not able to read your mind. So, get off your high horse or you will be 'out of here'.
DeleteWell, I mentioned it in the note before the link. You could have easily asked me if you cared,. Don't worry Joe, I'm a silent observer from now on. You claim to adhere to educating but have not responded to any of my charts since yesterday. You've proved my point.
DeleteI must have missed the on demand chart analysis tab.
Delete@V .. pardon me, but now you are being factually incorrect. There is no mention of a symbol in the chart at 1:49 pm, as you are stating at your 4:05 pm post. When I saw it and couldn't figure it out, I just 'left it'. If you can not take the time to make a 'complete' post, then don't expect me to figure it out. There are more people here than you. If you continue to be rude, and factually incorrect, then there will be one less person here - you. Last chance. If your account gets deleted it is your own fault.
Delete@V .. also I answered your post at 1:14, and chart question. So your last comment, "You claim to adhere to educating but have not responded to any of my charts since yesterday. You've proved my point," is also FACTUALLY incorrect.
Deletejoe. are we still embedded?
ReplyDeleteMarc, If you have a slow stochastics indicator on your charts just look at the daily chart and see if the readings are under 20 for 3 days or more.
Deletethanks PT . enjoy the holiday
DeleteYes, still embedded, marc.
Deleteand if i remember there was a time you said you wouldnt review counts. I think that was a good policy.
ReplyDeleteStop it.. my question for you is why did you make a degree error in your a,b,c ((A)), ((B)), ((C)) post; and why did you take my time with it?
Delete@ dumnonia-watchman; your comment was inappropriate, and has been taken down.
ReplyDeleteJoe, roughly a hundred posts up you typed:
ReplyDeleteThen, the smaller degree [..] iii can be allowed to be the length of A.
I'm curious your rationale. I assume this covers both the time and price aspects. I would like you to talk about this as it is one thing to know this is allowed another to understand why.
I know I ask the questions and you've mentioned some answers to my prior questions would be involved. Should I wait for your book to understand the why and just look out for what you say is allowed on the blog?
Gerald,
DeleteJoe may have missed this since there is a new post, so if you don't mind I will attempt an explanation. The rule involved is degree limitations. It states that a subwave is limited by the size of a larger degree wave in the same direction.
For example lets say there is an impulse labeled 1 that is 50 points.
Followed by a correction labeled 2. Now we begin another impulse which would be labeled 3. If wave 1 of 3 exceeds 50 points it would be larger than the entire wave 1 impulse . How could a sub wave of 3 be allowed to be larger than the entire impulse that preceded it? That would make a smaller degree wave bigger than larger degree wave. Just common sense. A smaller degree wave can not be bigger than larger degree wave in the same direction.
I Hope this is clear.
So in the chart Joe posted:
A&B are a larger degree waves
a,b,i,ii,iii are smaller degree waves.
Joe states that i and ii are smaller than A but iii is allowed to be as big as A. This is correct but a little ambiguous.
A more clear way to say it is that any of the up waves i,iii,v are limited by the size of A. Since they are of a smaller degree and in the same direction they can not be bigger than A.
I hope this helps Gerald and have a Merry Christmas!
hi, tom and thanks for the reply. I'm going to post my thoughts further in the post following Friday's cash close. I have more to say there with regard to your comment here.
Delete