Today's prices made a higher over the previous local highs. Then prices fell back to the 18-day SMA the line in the sand.
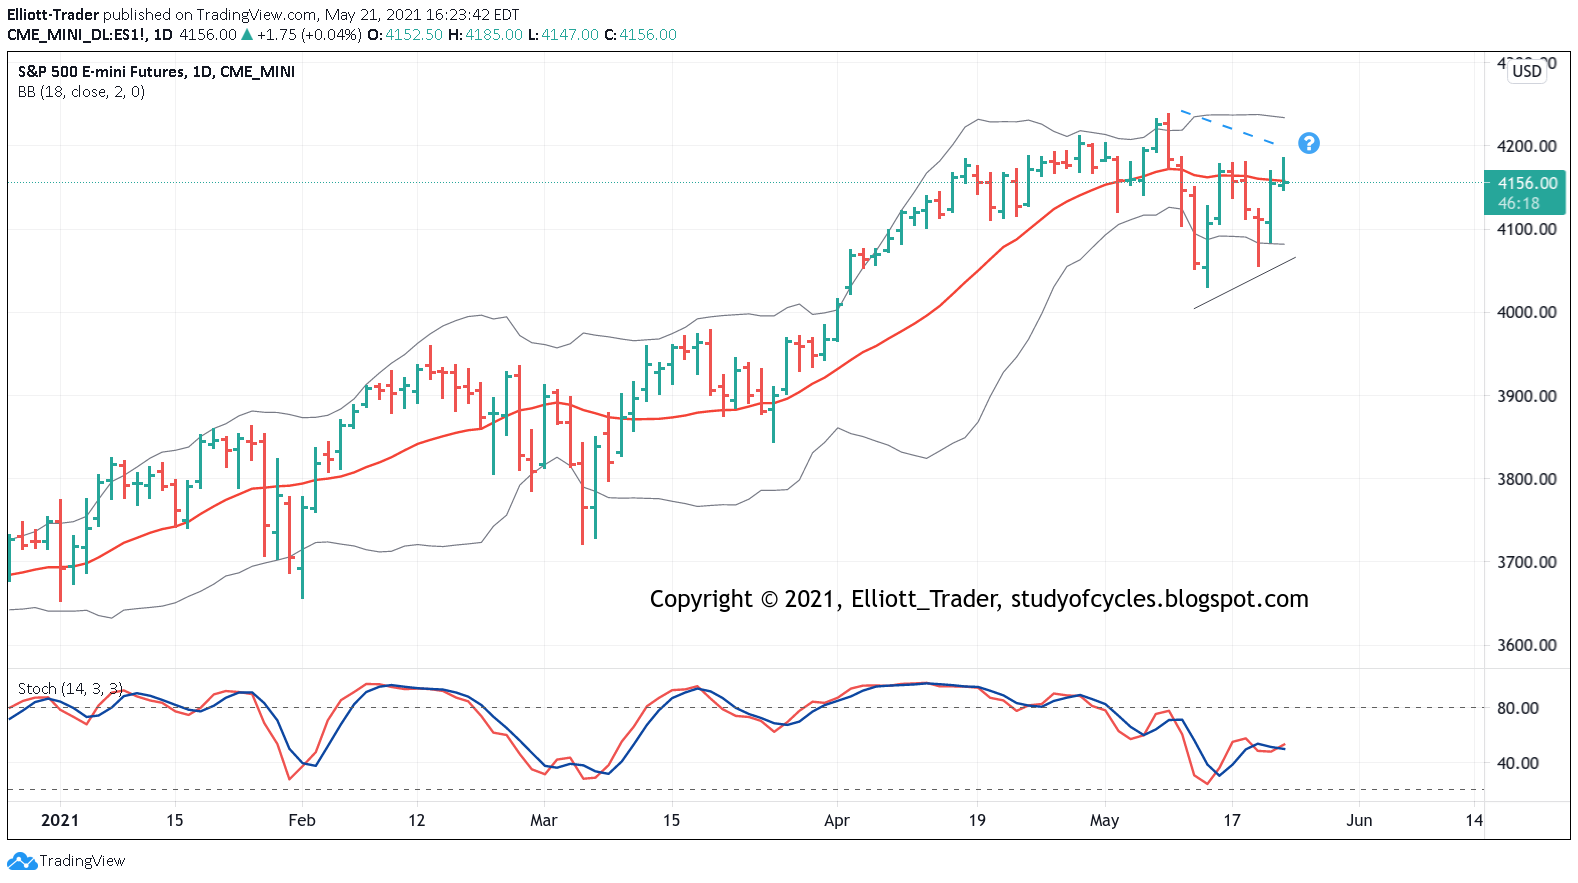
While better triangle proportions were made today, with the up wave now at 75% of the down wave, a triangle is not a sure thing. As we have said, it could fail.
The swing-line turned up today, but prices settled below the 18-day SMA which means an up trend is not in force either. For the shorter term, we indicated that on the ES 30-min chart, a continuation of the channel count can not be ruled out yet.
 |
| ES Futures - 30 min - Channel |
A fourth wave of the channel count can not be ruled out yet because, with about 106 candles on the chart, and following The Eight-Fold Path Method for Counting an Impulse, the EWO is still well within fourth wave parameters. Further, the retrace of the entire third wave is very shallow at only 23.6%. We have indicated the alternate the high might have been seen this morning, but there is nothing definitive. We remain patient, calm and flexible to see if anything is resolved in the overnight session Sunday or on Monday.
Have an excellent start to the weekend.
TraderJoe
Here's a chart of the Russell futures, which, if anything, is very supportive of the triangle idea. 3rd wave up or 3rd wave down? - answer = neither! Lazy price action for a while until the triangle resolves - probably to the upside. I could imagine this whole pandemic wave dragging out until Sept or October with 4 and 5th waves of different degrees.
ReplyDeletehttps://www.tradingview.com/x/NHmYBVH2/
ReplyDeleteSPX (dly) observations -
ReplyDeletehttps://funkyimg.com/i/3c6Kt.png
DXY (dly) observations -
ReplyDeletehttps://funkyimg.com/i/3c6KV.png
So, we have decreasing mo in the SPX, and increasing mo in the Dollar. Will price reflect the same going forward?
DeleteTLT (dly) Movin' on up?
ReplyDeletehttps://funkyimg.com/i/3c6PC.png
TMI
Deletemacd is below zero line is all you need to know
forget about longs until that changes
Sectors (dly) [if interested] -
ReplyDeletehttps://funkyimg.com/i/3c6TW.png
👍 thanks
DeleteSPY/XLU (wkly) - RORO -
ReplyDeletehttps://funkyimg.com/i/3c7ae.png
Good evening all. This five-minute pattern is plausible. But, of course, we do not 'know' it will occur. Gap direction was needed. The gap 'could be' in a third wave, as shown.
ReplyDeletehttps://invst.ly/uwwh-
Right now iii = 0.618 x i; and there is upward overlap. Wave iv should not go over 4,160.
TJ
Thanks but I am confused.
DeleteEs is over 4160
Because 4,160 has been exceeded higher there are still two possibilities:
ReplyDeletewave iv is a complex, which would provide a fifth wave up within the triangle.
or, there is a wave down, and now a flat correction.
All options still open; "no man's land".
TJ
5min - could be wrong -
ReplyDeletehttps://funkyimg.com/i/3c7n9.png
Looks like a bust. At least the reg. hidden div worked out, lol. Probably should stick to reading RSI instead. :o)
Delete5min last look tonight -
ReplyDeletehttps://funkyimg.com/i/3c7o5.png
4hr, bigger picture look -
ReplyDeletehttps://funkyimg.com/i/3c7uk.png
Good morning all.
ReplyDeleteES 30-min; there the new high for a fifth wave in-progress; can try to make 78%.
TJ
Thanks TJ.
DeleteWhats the longer term chart. Are we taking out all time highs or are we still in no man's land ?
Please stop with the constant questioning, and look back to May 17th and May 18th posts. And try to stay current. If we are in a triangle, then the all-time highs should eventually be taken out.
DeleteMay 17th -
http://studyofcycles.blogspot.com/2021/05/primary-week.html
May 18th -
http://studyofcycles.blogspot.com/2021/05/nq-100-interim-report.html
TJ
ES 2-hr; here is that 78.6% retrace potential (slightly exceeded), and the triangle potential.
ReplyDeletehttps://invst.ly/ux90m
TJ
SPY (15min) (roughly equivalent to futures hrly) -
ReplyDeletehttps://funkyimg.com/i/3c7Ap.png
Very small candles and indicators flatlined. Something's coming. :o)
DeleteES 15-min: the overnight was ugly and this may be another x((1)) count, extended wave one count. ALT is still in a longer-time wave ((4)) on this scale.
ReplyDeletehttps://invst.ly/uxadf
TJ
On a 120 min chart overnight and this am action looks like 1-2,1-2
ReplyDelete